

Healthcare Market Segmentation
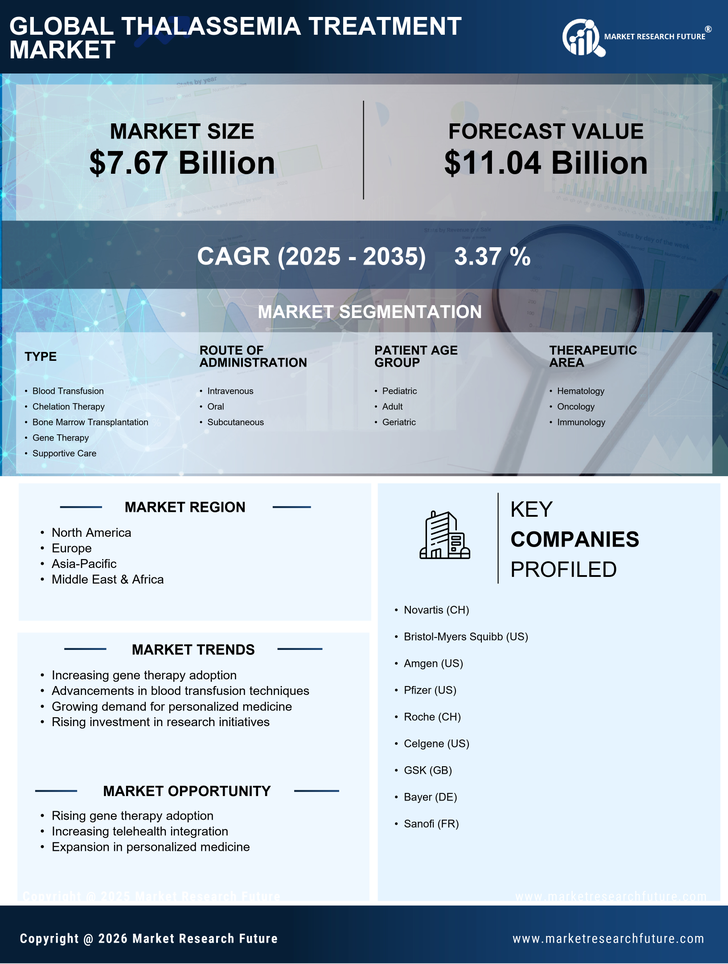
Healthcare By Type (USD Billion, 2025-2035)
- Blood Transfusion
- Chelation Therapy
- Bone Marrow Transplantation
- Gene Therapy
- Supportive Care
Healthcare By Route of Administration (USD Billion, 2025-2035)
- Intravenous
- Oral
- Subcutaneous
Healthcare By Patient Age Group (USD Billion, 2025-2035)
- Pediatric
- Adult
- Geriatric
Healthcare By Therapeutic Area (USD Billion, 2025-2035)
- Hematology
- Oncology
- Immunology


