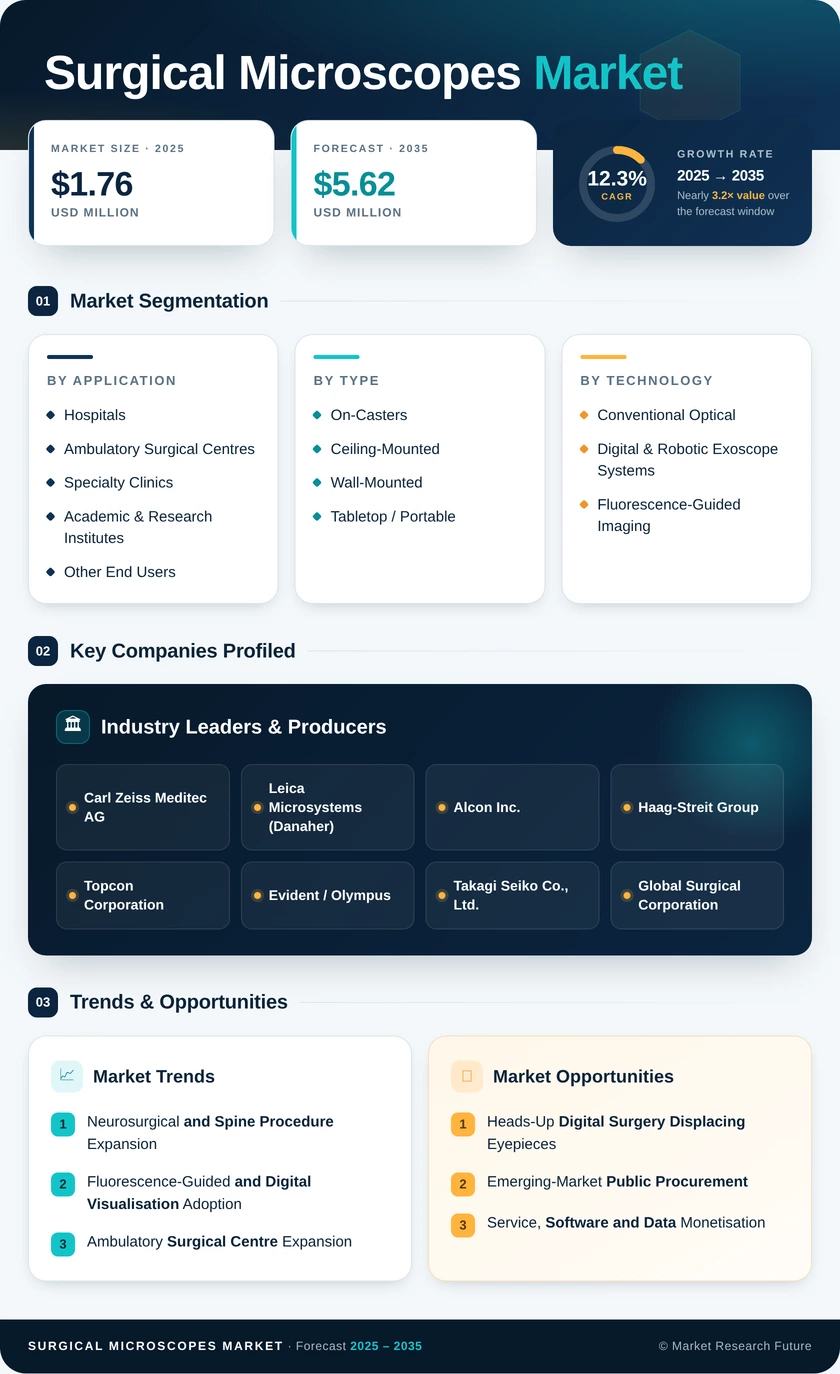
Surgical Microscopes Market (2026 - 2035)

ID: MRFR/HC/5600-HCR 200 Pages Rahul Gotadki Last Updated: September 15, 2026
Surgical Microscopes Market Research Report By Application (Neurosurgery, Ophthalmology, Dentistry, Plastic Surgery, Ear, Nose, and Throat), By Type (Fixed Surgical Microscopes, Mobile Surgical Microscopes, Tabletop Surgical Microscopes), By End Use (Hospitals, Ambulatory Surgical Centers, Research Institutes), By Magnification Power (Low Magnification, Medium Magnification, High Magnification) and By Regional (North America, Europe, South America, Asia Pacific, Middle East and Africa) - Growth & Industry Forecast 2025 To 2035
Surgical Microscopes Market
Market Size
Forecast Period2026-2035
CAGR (2026-2035)12.3%
2025 Market SizeUSD 1.76 Billion
2035 Market SizeUSD 5.62 Billion
Key Players
Carl Zeiss Meditec AG
Leica Microsystems
Alcon Inc.
Haag-Streit Group
Topcon Corporation
Evident / Olympus
Opportunities
  • Heads-Up Digital Surgery Displacing Eyepieces
  • Emerging-Market Public Procurement
  • Service, Software and Data Monetisation
  1. 1 Market Overview |
    1. 1.1 Study Assumptions & Market Definition |
    2. 1.2 Scope of the Study |
    3. 1.3 Research Methodology |
    4. 1.4 Market Summary
  2. 2 Key Report Takeaways |
    1. 2.1 By Technology |
    2. 2.2 By Sector |
    3. 2.3 By Geography
  3. 3 Market Size & Forecast (2021–2035) |
    1. 3.1 Historical Market Size (2021–2025) |
    2. 3.2 Current & Forecast Market Size (2026–2035) |
    3. 3.3 Year-over-Year Growth Analysis
  4. 4 Driver Impact Analysis |
    1. 4.1 Cataract and Vision-Restoration Volume Growth |
    2. 4.2 Neurosurgical and Spine Procedure Expansion |
    3. 4.3 Fluorescence-Guided and Digital Visualisation Adoption |
    4. 4.4 Ambulatory Surgical Centre Expansion
  5. 5 Restraints Impact Analysis |
    1. 5.1 Capital Cost and Replacement Economics |
    2. 5.2 Workforce Constraints in Emerging Systems |
    3. 5.3 Regulatory Compliance Burden
  6. 6 Opportunities |
    1. 6.1 Heads-Up Digital Surgery Displacing Eyepieces |
    2. 6.2 Emerging-Market Public Procurement |
    3. 6.3 Service, Software and Data Monetisation |
    4. 6.4 Dental and Office-Based Microsurgery |
    5. 6.5 Retrofit and Certified Pre-Owned Programmes
  7. 7 Regional Market Share & Country-Level Analysis |
    1. 7.1 North America | |
      1. 7.1.1 US | |
      2. 7.1.2 Canada | |
      3. 7.1.3 Mexico |
    2. 7.2 Europe | |
      1. 7.2.1 Germany | |
      2. 7.2.2 UK | |
      3. 7.2.3 France | |
      4. 7.2.4 Italy | |
      5. 7.2.5 Spain | |
      6. 7.2.6 Nordic Countries | |
      7. 7.2.7 Russia | |
      8. 7.2.8 Rest of Europe |
    3. 7.3 Asia-Pacific | |
      1. 7.3.1 China | |
      2. 7.3.2 India | |
      3. 7.3.3 Japan | |
      4. 7.3.4 South Korea | |
      5. 7.3.5 ASEAN | |
      6. 7.3.6 Rest of Asia-Pacific |
    4. 7.4 South America | |
      1. 7.4.1 Brazil | |
      2. 7.4.2 Argentina | |
      3. 7.4.3 Rest of South America |
    5. 7.5 Middle East & Africa | |
      1. 7.5.1 Saudi Arabia | |
      2. 7.5.2 UAE | |
      3. 7.5.3 South Africa | |
      4. 7.5.4 Egypt | |
      5. 7.5.5 Rest of Middle East & Africa
  8. 8 Future Outlook (2026–2035) |
    1. 8.1 Autonomous Positioning and Surgical AI |
    2. 8.2 Platform Economics and Recurring Revenue |
    3. 8.3 Convergence of Optical and Digital Visualisation |
    4. 8.4 Sustainability and Lifecycle Reporting
  9. 9 Market Segmentation Analysis |
    1. 9.1 By Application | |
      1. 9.1.1 Neurosurgery | |
      2. 9.1.2 Ophthalmology | |
      3. 9.1.3 ENT | |
      4. 9.1.4 Dentistry | |
      5. 9.1.5 Plastic & Reconstructive Surgery | |
      6. 9.1.6 Gynecology & Urology | |
      7. 9.1.7 Other Applications |
    2. 9.2 By End User | |
      1. 9.2.1 Hospitals | |
      2. 9.2.2 Ambulatory Surgical Centres | |
      3. 9.2.3 Specialty Clinics | |
      4. 9.2.4 Academic & Research Institutes | |
      5. 9.2.5 Other End Users |
    3. 9.3 By Mounting Type | |
      1. 9.3.1 On-Casters | |
      2. 9.3.2 Ceiling-Mounted | |
      3. 9.3.3 Wall-Mounted | |
      4. 9.3.4 Tabletop / Portable |
    4. 9.4 By Technology | |
      1. 9.4.1 Conventional Optical | |
      2. 9.4.2 Digital & Robotic Exoscope Systems | |
      3. 9.4.3 Fluorescence-Guided Imaging
  10. 10 Competitive Landscape |
    1. 10.1 Market Concentration Analysis |
    2. 10.2 Competitive Benchmarking Matrix |
    3. 10.3 Company Profiles | |
      1. 10.3.1 Carl Zeiss Meditec AG | |
      2. 10.3.2 Leica Microsystems (Danaher) | |
      3. 10.3.3 Alcon Inc. | |
      4. 10.3.4 Haag-Streit Group | |
      5. 10.3.5 Topcon Corporation | |
      6. 10.3.6 Evident / Olympus | |
      7. 10.3.7 Takagi Seiko Co., Ltd. | |
      8. 10.3.8 Global Surgical Corporation | |
      9. 10.3.9 Seiler Instrument Inc. | |
      10. 10.3.10 Karl Kaps GmbH & Co. KG | |
      11. 10.3.11 Munich Surgical Imaging GmbH | |
      12. 10.3.12 Alltion (Wuzhou) Co., Ltd.
  11. 11 Recent News & Developments
  12. 12 Report Scope & Methodology |
    1. 12.1 Study Period & Base Year |
    2. 12.2 Valuation Basis & Currency |
    3. 12.3 Abbreviations
  13. 13 Detailed Sources & Citations
  14. 14 Frequently Asked Questions
  15. 15 LIST OF TABLES |
  16. TABLE 1 Global Surgical Microscopes Market Size & Forecast, by Revenue (USD Billion), 2021–2035 |
  17. TABLE 2 Global Surgical Microscopes Market – Year-over-Year Growth Analysis, 2021–2035 |
  18. TABLE 3 Driver Impact Analysis – Estimated Contribution to CAGR, 2026–2035 |
  19. TABLE 4 Restraint Impact Analysis – Estimated Drag on CAGR, 2026–2035 |
  20. TABLE 5 Global Surgical Microscopes Market Size, by Region, 2021–2035 (USD Billion) |
  21. TABLE 6 North America Surgical Microscopes Market Size, by Country, 2021–2035 (USD Billion) |
  22. TABLE 7 Europe Surgical Microscopes Market Size, by Country, 2021–2035 (USD Billion) |
  23. TABLE 8 Asia-Pacific Surgical Microscopes Market Size, by Country, 2021–2035 (USD Billion) |
  24. TABLE 9 South America Surgical Microscopes Market Size, by Country, 2021–2035 (USD Billion) |
  25. TABLE 10 Middle East & Africa Surgical Microscopes Market Size, by Country, 2021–2035 (USD Billion) |
  26. TABLE 11 Global Surgical Microscopes Market Size, by Application, 2021–2035 (USD Billion) |
  27. TABLE 12 Global Surgical Microscopes Market Size, by End User, 2021–2035 (USD Billion) |
  28. TABLE 13 Global Surgical Microscopes Market Size, by Mounting Type, 2021–2035 (USD Billion) |
  29. TABLE 14 Global Surgical Microscopes Market Size, by Technology, 2021–2035 (USD Billion) |
  30. TABLE 15 North America Surgical Microscopes Market Size, by Application, 2021–2035 (USD Billion) |
  31. TABLE 16 North America Surgical Microscopes Market Size, by End User, 2021–2035 (USD Billion) |
  32. TABLE 17 Europe Surgical Microscopes Market Size, by Application, 2021–2035 (USD Billion) |
  33. TABLE 18 Europe Surgical Microscopes Market Size, by Technology, 2021–2035 (USD Billion) |
  34. TABLE 19 Asia-Pacific Surgical Microscopes Market Size, by Application, 2021–2035 (USD Billion) |
  35. TABLE 20 Asia-Pacific Surgical Microscopes Market Size, by End User, 2021–2035 (USD Billion) |
  36. TABLE 21 South America Surgical Microscopes Market Size, by Mounting Type, 2021–2035 (USD Billion) |
  37. TABLE 22 Middle East & Africa Surgical Microscopes Market Size, by Technology, 2021–2035 (USD Billion) |
  38. TABLE 23 Competitive Benchmarking Matrix – Global Surgical Microscopes Market, 2026 |
  39. TABLE 24 Company Profiles – Key Players, Global Surgical Microscopes Market |
  40. TABLE 25 Recent Developments & Strategic Announcements, 2023–2025 |
  41. TABLE 26 Report Scope & Methodology Summary |
  42. TABLE 27 Detailed Sources & Citations Index
  43. 16 LIST OF FIGURES |
  44. FIGURE 1 Global Surgical Microscopes Market – Market Dynamics Overview (Drivers, Restraints, Opportunities) |
  45. FIGURE 2 Industry Value Chain Analysis – Optics Manufacturing to Theatre Deployment |
  46. FIGURE 3 Porter's Five Forces Analysis – Global Surgical Microscopes Market |
  47. FIGURE 4 Market Size Trend Line, 2021–2035 (USD Billion) |
  48. FIGURE 5 Year-over-Year Growth Curve, 2022–2035 (%) |
  49. FIGURE 6 Revenue Share by Application, 2025 vs 2035 (%) |
  50. FIGURE 7 Revenue Share by End User, 2025 vs 2035 (%) |
  51. FIGURE 8 Revenue Share by Mounting Type, 2025 (%) |
  52. FIGURE 9 Revenue Share by Technology, 2025 vs 2035 (%) |
  53. FIGURE 10 Regional Revenue Share Distribution, 2025 (%) |
  54. FIGURE 11 Regional CAGR Comparison, 2026–2035 (%) |
  55. FIGURE 12 Country-Level Revenue Heat Map, 2025 |
  56. FIGURE 13 Competitive Landscape – Estimated Revenue Share Ranges, 2026 |
  57. FIGURE 14 Competitive Positioning Matrix – Premium vs Value Tier |
  58. FIGURE 15 Installed Base Age Profile and Replacement Wave, 2021–2035

Segmentation Quick Reference

DimensionSub-SegmentsDominant SegmentFastest Growing Segment
By ApplicationNeurosurgery; Ophthalmology; ENT; Dentistry; Plastic & Reconstructive Surgery; Gynecology & Urology; Other ApplicationsNeurosurgeryENT
By End UserHospitals; Ambulatory Surgical Centres; Specialty Clinics; Academic & Research Institutes; Other End UsersHospitalsAmbulatory Surgical Centres
By Mounting TypeOn-Casters; Ceiling-Mounted; Wall-Mounted; Tabletop / PortableOn-CastersTabletop / Portable
By TechnologyConventional Optical; Digital & Robotic Exoscope Systems; Fluorescence-Guided ImagingConventional OpticalDigital & Robotic Exoscope Systems
By GeographyNorth America; Europe; Asia-Pacific; South America; Middle East & AfricaNorth AmericaAsia-Pacific


Market Segmentation Overview

By Application

Sub-SegmentKey Trend
NeurosurgeryFluorescence and navigation integration becoming default specification
OphthalmologyStandardised fleet purchasing by high-volume cataract chains
ENTSkull-base and otologic caseload driving fastest application growth
DentistryEndodontic microsurgery moving into general practice.
Plastic & Reconstructive SurgeryLymphatic and supermicrosurgery raising magnification requirements.
Gynecology & UrologyFertility microsurgery sustaining steady niche demand.
Other ApplicationsVeterinary and research adoption expanding the addressable base.


Application mix explains most of the price dispersion in this category. Neurosurgery pulls the average selling price upward through configured options. At the same time, ophthalmology and dentistry carry unit volume at substantially lower price points — a barbell that vendors must serve with genuinely distinct product families rather than trimmed variants of one platform.

By End User

Sub-SegmentKey Trend
HospitalsMulti-theatre standardisation via group purchasing agreements
Ambulatory Surgical CentresPayment migration accelerating compact-platform demand.
Specialty ClinicsChain consolidation producing multi-site fleet orders
Academic & Research InstitutesTraining simulators bundled with clinical systems.
Other End UsersMilitary field hospitals and veterinary practices


Buying behaviour diverges sharply across these groups. Hospitals negotiate slowly and specify exhaustively; ambulatory centres decide fast on total-cost logic and rebuy more frequently. Vendors optimised for one motion consistently underperform in the other.

By Mounting Type

Sub-SegmentKey Trend
On-CastersPreferred where theatres are shared across specialties
Ceiling-MountedStandard in new-build hybrid operating rooms
Wall-MountedSpace-efficient choice for clinics and dental suites
Tabletop / PortableRapid growth in office-based and outreach procedures


Mounting choice is effectively an architecture decision made years before purchase. Ceiling suspension requires structural planning at the design stage, which locks in vendor relationships early and explains why new-build hospital projects are disproportionately valuable design wins.

By Technology

Sub-SegmentKey Trend
Conventional OpticalRetains majority share on reliability and lifecycle cost
Digital & Robotic Exoscope SystemsErgonomic advantages driving the fastest technology shift.
Fluorescence-Guided ImagingMoving from premium option to mid-tier standard


Technology transition is proceeding faster than replacement cycles allow. Because installed optical heads last well over a decade, digital adoption is concentrated in new installations and greenfield theatres — meaning stated share figures understate the direction of travel by a considerable margin.




Download PDF ×

We do not share your information with anyone. However, we may send you emails based on your report interest from time to time. You may contact us at any time to opt-out.