Segmentation Quick Reference
| Dimension | Sub-Segments | Dominant Segment | Fastest Growing Segment |
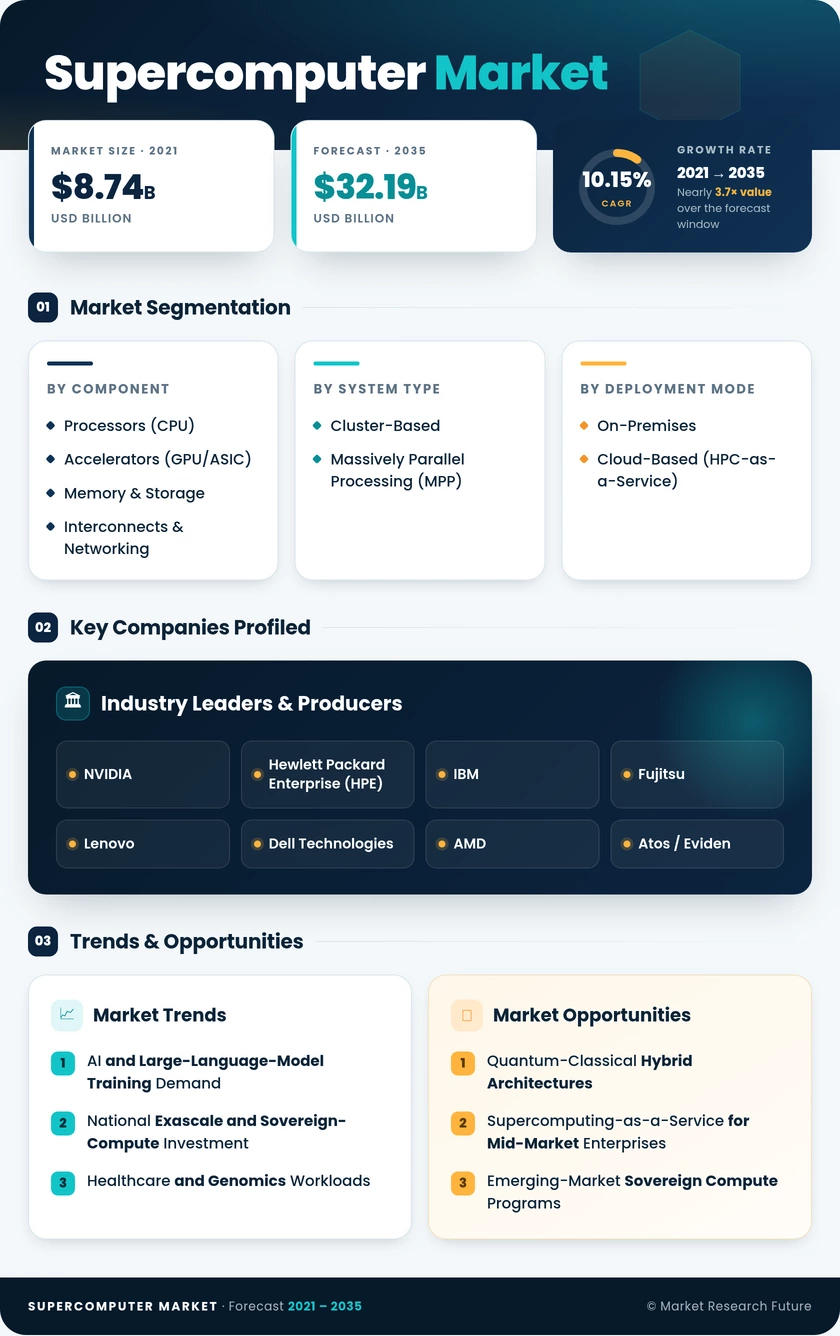
| Component | Processors (CPU); Accelerators (GPU/ASIC); Memory & Storage; Interconnects & Networking | Processors (CPU) | Accelerators (GPU/ASIC) |
| System Type | Cluster-Based; Massively Parallel Processing (MPP) | Cluster-Based | MPP |
| Deployment Mode | On-Premises; Cloud-Based (HPC-as-a-Service) | On-Premises | Cloud-Based |
| Processing Scale | Petascale; Pre-Exascale; Exascale | Petascale | Exascale |
| End-User | Government & Defense; Academic & Research; Healthcare & Life Sciences; Energy & Earth Sciences; Financial Services; Manufacturing & Engineering | Government & Defense | Healthcare & Life Sciences |
| Geography | North America; Europe; Asia-Pacific; South America; Middle East & Africa | North America | Asia-Pacific |
Market Segmentation Overview
By Component
| Sub-Segment | Key Trend |
| Processors (CPU) | Transition from monolithic dies to chiplet-based designs (AMD EPYC, Intel Xeon Max), improving core density and energy efficiency. |
| Accelerators (GPU/ASIC) | Rapid uptake driven by AI/ML training; NVIDIA Blackwell and AMD Instinct roadmaps dominate procurement pipelines. |
| Memory & Storage | HBM3E and CXL-attached memory pools expanding bandwidth per node for data-intensive workloads |
| Interconnects & Networking | InfiniBand NDR 400G and emerging 800G XDR fabrics replacing legacy Ethernet for low-latency scale-out |
Processor architectures are evolving toward heterogeneous chiplet designs that pair general-purpose cores with specialized compute tiles, while accelerator vendors race to deliver higher memory bandwidth through HBM stacking. Interconnect upgrades are a critical enabler, as exascale systems require bisection bandwidth that legacy 100G fabrics cannot deliver.
By System Type
| Sub-Segment | Key Trend |
| Cluster-Based | Dominant architecture for commercial HPC; modular scale-out with commodity-derived components |
| Massively Parallel Processing (MPP) | Custom-engineered systems for national labs; tightly coupled interconnects for latency-critical simulation. |
Cluster-based systems account for the majority of installations globally due to their flexibility and lower per-node cost. MPP systems, while fewer in number, capture a disproportionate share of revenue because of their multi-hundred-million-dollar price tags and bespoke engineering requirements.
By Deployment Mode
| Sub-Segment | Key Trend |
| On-Premises | Preferred for classified and latency-sensitive workloads; long refresh cycles of 5–7 years. |
| Cloud-Based (HPC-as-a-Service) | Fastest-growing mode; burst-capacity model reducing capital barriers for mid-market users |
On-premises deployments remain the revenue backbone, but cloud-based HPC is eroding market share at the margins as managed-service offerings from AWS, Azure, and Google Cloud mature. Hybrid models—where base workloads run on-premises and peak demand spills to the cloud—are becoming the standard architecture for academic and pharmaceutical buyers.
By Processing Scale
| Sub-Segment | Key Trend |
| Petascale | Broadest installed base; backbone of weather forecasting, materials science, and financial modeling |
| Pre-Exascale | Bridge generation: several systems approaching exascale via software optimization and accelerator upgrades |
| Exascale | Frontier-class machines enabling previously intractable simulations; rapid deployment pipeline through 2030 |
Petascale systems still represent the majority of installed capacity worldwide. Exascale installations, though limited in count, generate outsized revenue and drive technology roadmaps that cascade cost and performance benefits to lower tiers within 3–5 years of initial deployment.
By End-User
| Sub-Segment | Key Trend |
| Government & Defense | Largest buyer segment: nuclear stockpile stewardship, intelligence, and weather prediction |
| Academic & Research | University consortia and national labs; grant-funded shared-access models |
| Healthcare & Life Sciences | Fastest-growing vertical; genomics, molecular dynamics, and AI-driven drug discovery |
| Energy & Earth Sciences | Reservoir simulation, seismic processing, and climate modeling |
| Financial Services | Risk analytics, Monte Carlo simulation, and regulatory stress testing |
| Manufacturing & Engineering | Computational fluid dynamics, crash testing, and additive-manufacturing design |
Government agencies anchor the buyer base with multi-year procurement contracts, while healthcare is the fastest-expanding vertical as precision medicine and pandemic-preparedness programs allocate dedicated supercomputing budgets. Financial services and manufacturing represent steady mid-single-digit growth segments driven by regulatory requirements and competitive simulation accuracy.