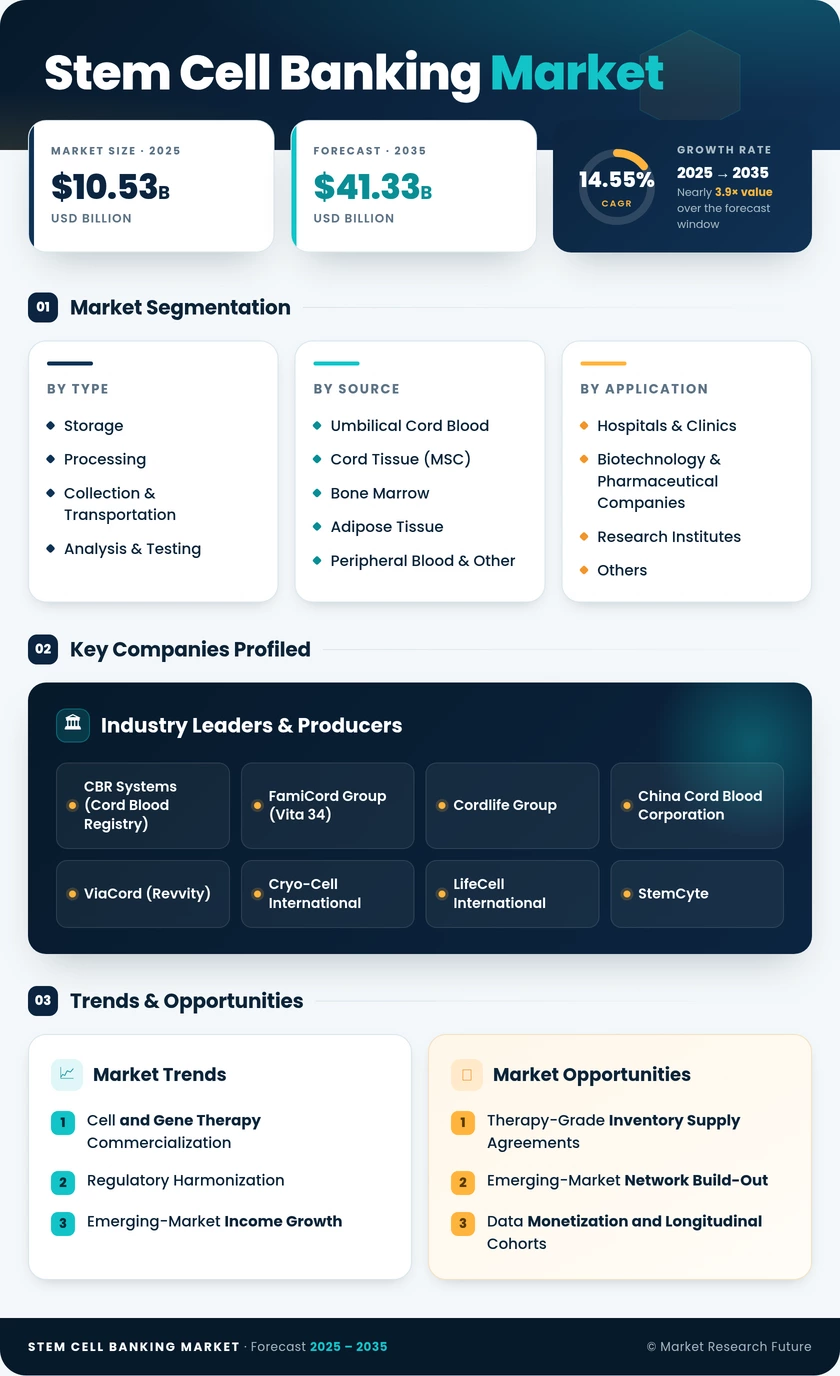
Stem Cell Banking Market (2026 - 2035)

ID: MRFR/HC/6969-HCR 200 Pages Nidhi Mandole Last Updated: September 15, 2026
Stem Cell Banking Market Research Report: Size, Share, Trend Analysis By Stem Cell Source (Umbilical Cord Blood, Adult Stem Cells, Embryonic Stem Cells, Perinatal Stem Cells), By Cell Type (Hematopoietic Stem Cells, Mesenchymal Stem Cells, Neural Stem Cells, Induced Pluripotent Stem Cells), By Storage Type (Cryopreservation, Stem Cell Culture, Tissue Preservation), By End Users (Hospitals, Research Institutions, Biotechnology Companies, Pharmaceutical Companies) and By Regional (North America, Europe, South America, Asia Pacific, Middle East and Africa) - Growth Outlook & Industry Forecast 2025 To 2035
Stem Cell Banking Market
Market Size
Forecast Period2026-2035
CAGR (2026-2035)14.55%
2025 Market SizeUSD 10.53 Billion
2035 Market SizeUSD 41.33 Billion
Key Players
CBR Systems
FamiCord Group
Cordlife Group
China Cord Blood Corporation
ViaCord
Cryo-Cell International
Opportunities
  • Therapy-Grade Inventory Supply Agreements
  • Emerging-Market Network Build-Out
  • Data Monetization and Longitudinal Cohorts
  1. 1 Market Overview |
    1. 1.1 Study Assumptions & Market Definition |
    2. 1.2 Scope of the Study |
    3. 1.3 Research Methodology
  2. 2 Market Summary & Key Report Takeaways |
    1. 2.1 By Bank Type |
    2. 2.2 By Application & End User |
    3. 2.3 By Geography
  3. 3 Global Market Size & Forecast (2021–2035) |
    1. 3.1 Historical Market Size (2021–2025) |
    2. 3.2 Current & Forecast Market Size (2026–2035) |
    3. 3.3 Year-over-Year Growth Analysis
  4. 4 Market Drivers Analysis |
    1. 4.1 Cell and Gene Therapy Commercialization |
    2. 4.2 Regulatory Harmonization |
    3. 4.3 Emerging-Market Income Growth |
    4. 4.4 Processing Automation
  5. 5 Market Restraints Analysis |
    1. 5.1 Low Autologous Utilization |
    2. 5.2 Cost and Affordability Pressure |
    3. 5.3 Custody and Continuity Risk
  6. 6 Market Opportunity Analysis |
    1. 6.1 Therapy-Grade Inventory Supply Agreements |
    2. 6.2 Emerging-Market Network Build-Out |
    3. 6.3 Data Monetization and Longitudinal Cohorts |
    4. 6.4 Expanded Tissue Diversification |
    5. 6.5 Insurance and Employer Benefit Channels |
    6. 6.6 Industry Value Chain Analysis |
    7. 6.7 Porter's Five Forces Analysis
  7. 7 Regional Analysis |
    1. 7.1 North America | |
      1. 7.1.1 US | |
      2. 7.1.2 Canada | |
      3. 7.1.3 Mexico |
    2. 7.2 Europe | |
      1. 7.2.1 Germany | |
      2. 7.2.2 UK | |
      3. 7.2.3 France | |
      4. 7.2.4 Italy | |
      5. 7.2.5 Spain | |
      6. 7.2.6 Nordic Countries | |
      7. 7.2.7 Russia | |
      8. 7.2.8 Rest of Europe |
    3. 7.3 Asia-Pacific | |
      1. 7.3.1 China | |
      2. 7.3.2 India | |
      3. 7.3.3 Japan | |
      4. 7.3.4 South Korea | |
      5. 7.3.5 ASEAN | |
      6. 7.3.6 Rest of Asia-Pacific |
    4. 7.4 South America | |
      1. 7.4.1 Brazil | |
      2. 7.4.2 Argentina | |
      3. 7.4.3 Rest of South America |
    5. 7.5 Middle East & Africa | |
      1. 7.5.1 Saudi Arabia | |
      2. 7.5.2 UAE | |
      3. 7.5.3 South Africa | |
      4. 7.5.4 Egypt | |
      5. 7.5.5 Rest of Middle East & Africa
  8. 8 Future Outlook (2026–2035) |
    1. 8.1 Automation and Digital Chain of Custody |
    2. 8.2 Platform Economics and Bundling |
    3. 8.3 Allogeneic Shift and Inventory Value |
    4. 8.4 Sustainability and Energy Cost Exposure
  9. 9 Market Segmentation Analysis |
    1. 9.1 By Bank Type | |
      1. 9.1.1 Public | |
      2. 9.1.2 Private | |
      3. 9.1.3 Hybrid |
    2. 9.2 By Stem Cell Source | |
      1. 9.2.1 Umbilical Cord Blood | |
      2. 9.2.2 Cord Tissue (MSC) | |
      3. 9.2.3 Bone Marrow | |
      4. 9.2.4 Adipose Tissue | |
      5. 9.2.5 Peripheral Blood & Other |
    3. 9.3 By Service Type | |
      1. 9.3.1 Collection and Transportation | |
      2. 9.3.2 Processing | |
      3. 9.3.3 Analysis and Testing | |
      4. 9.3.4 Storage |
    4. 9.4 By Application | |
      1. 9.4.1 Personalized Banking | |
      2. 9.4.2 Regenerative & Clinical Therapeutics | |
      3. 9.4.3 Research and Drug Discovery | |
      4. 9.4.4 Other Applications |
    5. 9.5 By End User | |
      1. 9.5.1 Hospitals and Clinics | |
      2. 9.5.2 Biotechnology and Pharmaceutical Companies | |
      3. 9.5.3 Research Institutes | |
      4. 9.5.4 Others
  10. 10 Competitive Landscape |
    1. 10.1 Market Share Analysis (2026) |
    2. 10.2 Competitive Benchmarking Matrix |
    3. 10.3 Company Profiles | |
      1. 10.3.1 CBR Systems (Cord Blood Registry) | |
      2. 10.3.2 FamiCord Group (Vita 34) | |
      3. 10.3.3 Cordlife Group | |
      4. 10.3.4 China Cord Blood Corporation | |
      5. 10.3.5 ViaCord (Revvity) | |
      6. 10.3.6 Cryo-Cell International | |
      7. 10.3.7 LifeCell International | |
      8. 10.3.8 StemCyte | |
      9. 10.3.9 Cryoviva Biotech | |
      10. 10.3.10 Americord Registry | |
      11. 10.3.11 Smart Cells International
  11. 11 Recent Developments & News
  12. 12 Report Scope & Methodology |
    1. 12.1 Study Period & Base Year |
    2. 12.2 Data Sources & Citations |
    3. 12.3 Abbreviations
  13. 13 Detailed Sources and Citations
  14. 14 Frequently Asked Questions (FAQs)
  15. 15 LIST OF TABLES |
  16. TABLE 1 Global Stem Cell Banking Market Size & Forecast, by Revenue (USD billion), 2021–2035 |
  17. TABLE 2 Global Stem Cell Banking Market – Year-over-Year Growth Analysis, 2021–2035 |
  18. TABLE 3 Driver Impact Analysis Matrix, 2026–2035 |
  19. TABLE 4 Restraint Impact Analysis Matrix, 2026–2035 |
  20. TABLE 5 Global Market Size, by Region, 2021–2035 (USD billion) |
  21. TABLE 6 North America Market Size, by Country, 2021–2035 (USD billion) |
  22. TABLE 7 Europe Market Size, by Country, 2021–2035 (USD billion) |
  23. TABLE 8 Asia-Pacific Market Size, by Country, 2021–2035 (USD billion) |
  24. TABLE 9 South America Market Size, by Country, 2021–2035 (USD billion) |
  25. TABLE 10 Middle East & Africa Market Size, by Country, 2021–2035 (USD billion) |
  26. TABLE 11 Global Market Size, by Bank Type, 2021–2035 (USD billion) |
  27. TABLE 12 Global Market Size, by Stem Cell Source, 2021–2035 (USD billion) |
  28. TABLE 13 Global Market Size, by Service Type, 2021–2035 (USD billion) |
  29. TABLE 14 Global Market Size, by Application, 2021–2035 (USD billion) |
  30. TABLE 15 Global Market Size, by End User, 2021–2035 (USD billion) |
  31. TABLE 16 North America Market Size, by Bank Type and Source, 2021–2035 (USD billion) |
  32. TABLE 17 Europe Market Size, by Bank Type and Source, 2021–2035 (USD billion) |
  33. TABLE 18 Asia-Pacific Market Size, by Bank Type and Source, 2021–2035 (USD billion) |
  34. TABLE 19 South America Market Size, by Service Type, 2021–2035 (USD billion) |
  35. TABLE 20 Middle East & Africa Market Size, by End User, 2021–2035 (USD billion) |
  36. TABLE 21 Competitive Benchmarking Matrix, 2026 |
  37. TABLE 22 Company Profiles – Key Players |
  38. TABLE 23 Recent Developments & Strategic Announcements, 2023–2025 |
  39. TABLE 24 Report Scope & Methodology Summary |
  40. TABLE 25 Detailed Sources and Citations
  41. 16 LIST OF FIGURES |
  42. FIGURE 1 Market Dynamics – Drivers, Restraints, Opportunities and Challenges |
  43. FIGURE 2 Industry Value Chain Analysis |
  44. FIGURE 3 Porter's Five Forces Analysis |
  45. FIGURE 4 Global Market Size Trend, 2021–2035 (USD billion) |
  46. FIGURE 5 Year-over-Year Growth Curve, 2022–2035 (%) |
  47. FIGURE 6 Market Share by Bank Type, 2025 vs 2035 (%) |
  48. FIGURE 7 Market Share by Stem Cell Source, 2025 (%) |
  49. FIGURE 8 Market Share by Service Type, 2025 (%) |
  50. FIGURE 9 Market Share by Application, 2025 (%) |
  51. FIGURE 10 Market Share by End User, 2025 (%) |
  52. FIGURE 11 Regional Share Distribution, 2025 (%) |
  53. FIGURE 12 Regional CAGR Comparison, 2026–2035 (%) |
  54. FIGURE 13 North America Country-Level Share, 2025 (%) |
  55. FIGURE 14 Europe Country-Level Share, 2025 (%) |
  56. FIGURE 15 Asia-Pacific Country-Level Share, 2025 (%) |
  57. FIGURE 16 Competitive Landscape – Revenue Share Positioning, 2026 |
  58. FIGURE 17 Strategic Positioning Quadrant of Key Players |
  59. FIGURE 18 Future Outlook Themes Roadmap, 2026–2035

Segmentation Quick Reference

DimensionSub-SegmentsDominant SegmentFastest Growing Segment
By Bank TypePublic, Private, HybridPrivateHybrid
By Stem Cell SourceUmbilical Cord Blood, Cord Tissue (MSC), Bone Marrow, Adipose Tissue, Peripheral Blood & OtherUmbilical Cord BloodAdipose Tissue
By Service TypeCollection and Transportation, Processing, Analysis and Testing, StorageStorageProcessing
By ApplicationPersonalized Banking, Regenerative & Clinical Therapeutics, Research and Drug Discovery, Other ApplicationsPersonalized BankingResearch and Drug Discovery
By End UserHospitals and Clinics, Biotechnology and Pharmaceutical Companies, Research Institutes, OthersHospitals and ClinicsBiotechnology and Pharmaceutical Companies
By GeographyNorth America, Europe, Asia-Pacific, South America, Middle East & AfricaNorth AmericaAsia-Pacific


Market Segmentation Overview

By Bank Type

Sub-SegmentKey Trend
PublicGovernment-funded inventory expansion tied to national transplant registries
PrivatePrepaid multi-decade contracts sustaining high-margin recurring revenue
HybridDual-channel economics spreading fixed laboratory cost across paid and altruistic units.


Bank type determines revenue architecture more than any other dimension. Private operators optimize for lifetime customer value, public banks answer to health-ministry funding cycles, and hybrid entrants are building the only model capable of serving consumer and therapy-developer demand from one facility.

By Stem Cell Source

Sub-SegmentKey Trend
Umbilical Cord BloodContinued primacy on the strength of established hematopoietic transplant outcomes
Cord Tissue (MSC)Attach-rate growth as regenerative indication pipelines mature
Bone MarrowSteady adult transplant demand, limited consumer relevance
Adipose TissueFastest expansion, opening adult intake outside the maternity window
Peripheral Blood & OtherApheresis convenience supporting niche clinical and research volumes


Source diversification is the clearest strategic hedge available to operators. Facilities capable of handling adipose and dental pulp alongside perinatal material decouple enrollment growth from national birth rates.

By Service Type

Sub-SegmentKey Trend
Collection and TransportationCourier network density becoming a service-level differentiator
ProcessingClosed-system automation lifting recovery consistency and unit pricing.
Analysis and TestingHLA typing and viability certification bundled into premium tiers
StorageAnnuity revenue base under gradual pricing pressure


Service mix is shifting toward higher-value activity. Pure custodians face commoditization, while laboratories with GMP-grade manipulation capability capture disproportionate margin.

By Application

Sub-SegmentKey Trend
Personalized BankingCore consumer volume, growth tied to affluence and awareness
Regenerative & Clinical TherapeuticsApproved product volume converting inventory into clinical supply
Research and Drug DiscoveryPharmaceutical preclinical demand driving the fastest segment growth
Other ApplicationsVeterinary, cosmetic, and exploratory uses at the periphery


Application mix reveals where the business model is heading. Consumer banking funds the infrastructure; research and therapeutic supply will determine which operators earn premium valuations by 2035.

By End User

Sub-SegmentKey Trend
Hospitals and ClinicsCollection-point control conferring channel leverage
Biotechnology and Pharmaceutical CompaniesContract-based sourcing of characterized starting material
Research InstitutesGrant-funded longitudinal cohort demand
OthersStandalone laboratories and contract research organizations


End-user concentration is loosening as biotechnology buyers scale. Operators that once sold exclusively to families now negotiate multi-year supply agreements with therapy developers, a fundamentally different commercial motion requiring different capabilities.




Download PDF ×

We do not share your information with anyone. However, we may send you emails based on your report interest from time to time. You may contact us at any time to opt-out.