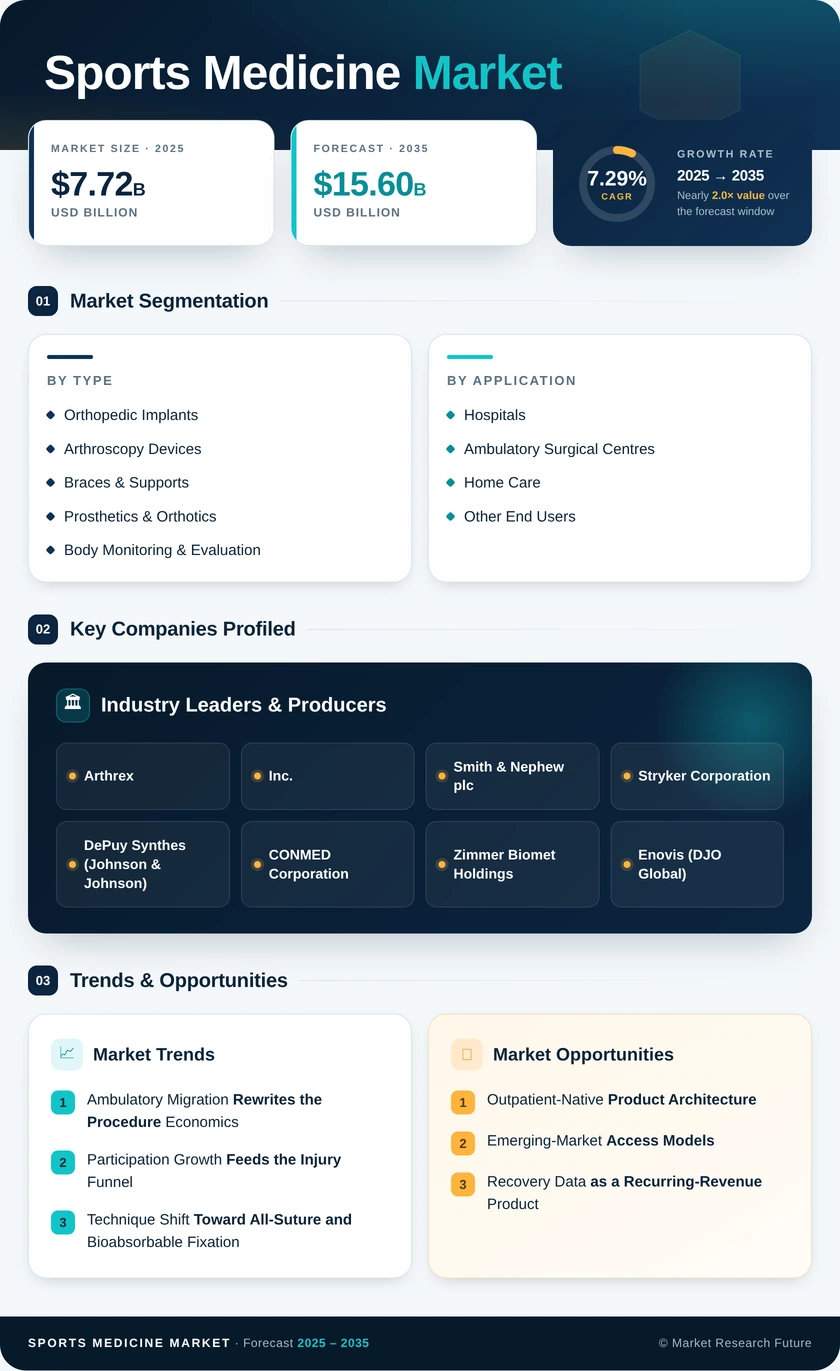
Sports Medicine Market (2026 - 2035)

ID: MRFR/HC/2407-CR 200 Pages Satyendra Maurya Last Updated: September 15, 2026
Sports Medicine Market Research Report By Application (Injury Prevention, Athletic Performance Enhancement, Rehabilitation, Pain Management, Health Monitoring), By Product Type (Braces Supports, Therapeutic Devices, Surgery Equipment, Pain Management, Rehabilitation Equipment), By End Use (Hospitals, Sports Clinics, Home Healthcare, Fitness Centers, Rehabilitation Centers), By Distribution Channel (Direct Sales, Online Sales, Retail Sales, Wholesale, Distributors) and By Regional (North America, Europe, South America, Asia Pacific, Middle East and Africa) - Growth & Industry Forecast Till 2035
Sports Medicine Market
Market Size
Forecast Period2026-2035
CAGR (2026-2035)7.29%
2025 Market SizeUSD 7.72 Billion
2035 Market SizeUSD 15.60 Billion
Key Players
Arthrex, Inc.
Smith & Nephew plc
Stryker Corporation
DePuy Synthes
CONMED Corporation
Zimmer Biomet Holdings
Opportunities
  • Outpatient-Native Product Architecture
  • Emerging-Market Access Models
  • Recovery Data as a Recurring-Revenue Product
  1. 1 Market Overview |
    1. 1.1 Study Assumptions & Market Definition |
    2. 1.2 Scope of the Study |
    3. 1.3 Research Methodology
  2. 2 Market Summary & Key Report Takeaways |
    1. 2.1 By Product Type |
    2. 2.2 By Application |
    3. 2.3 By End User |
    4. 2.4 By Geography
  3. 3 Global Market Size & Forecast (2021–2035) |
    1. 3.1 Historical Market Size (2021–2025) |
    2. 3.2 Current & Forecast Market Size (2026–2035) |
    3. 3.3 Market Size by Revenue (USD Billion) |
    4. 3.4 Year-over-Year Growth Analysis
  4. 4 Driver Impact Analysis |
    1. 4.1 Ambulatory Migration of Orthopedic Procedures |
    2. 4.2 Rising Youth and Amateur Sports Participation |
    3. 4.3 All-Suture and Bioabsorbable Fixation Adoption |
    4. 4.4 Sovereign Sports Investment in Emerging Economies
  5. 5 Restraints Impact Analysis |
    1. 5.1 Price Compression From Consolidated Purchasing |
    2. 5.2 Regulatory Cost and Portfolio Pruning |
    3. 5.3 Clinical Workforce Constraints
  6. 6 Market Opportunity Analysis |
    1. 6.1 Outpatient-Native Product Architecture |
    2. 6.2 Emerging-Market Access Models |
    3. 6.3 Recovery Data as Recurring Revenue |
    4. 6.4 Biologic Augmentation With Defensible Evidence |
    5. 6.5 Women's Sport as an Underserved Clinical Segment |
    6. 6.6 Industry Value Chain Analysis |
    7. 6.7 Porter's Five Forces Analysis
  7. 7 Regional Market Share & Country-Level Analysis |
    1. 7.1 North America | |
      1. 7.1.1 US | |
      2. 7.1.2 Canada | |
      3. 7.1.3 Mexico |
    2. 7.2 Europe | |
      1. 7.2.1 Germany | |
      2. 7.2.2 UK | |
      3. 7.2.3 France | |
      4. 7.2.4 Italy | |
      5. 7.2.5 Spain | |
      6. 7.2.6 Nordic Countries | |
      7. 7.2.7 Russia | |
      8. 7.2.8 Rest of Europe |
    3. 7.3 Asia-Pacific | |
      1. 7.3.1 China | |
      2. 7.3.2 India | |
      3. 7.3.3 Japan | |
      4. 7.3.4 South Korea | |
      5. 7.3.5 ASEAN | |
      6. 7.3.6 Rest of Asia-Pacific |
    4. 7.4 South America | |
      1. 7.4.1 Brazil | |
      2. 7.4.2 Argentina | |
      3. 7.4.3 Rest of South America |
    5. 7.5 Middle East & Africa | |
      1. 7.5.1 Saudi Arabia | |
      2. 7.5.2 UAE | |
      3. 7.5.3 South Africa | |
      4. 7.5.4 Egypt | |
      5. 7.5.5 Rest of Middle East & Africa
  8. 8 Future Outlook (2026–2035) |
    1. 8.1 Computer-Assisted and Robotic Arthroscopy |
    2. 8.2 Outcome-Linked Commercial Models |
    3. 8.3 Prevention Moves Upstream |
    4. 8.4 Supply Chain Localisation and Sustainability
  9. 9 Market Segmentation Analysis |
    1. 9.1 By Product Type | |
      1. 9.1.1 Orthopedic Implants | |
      2. 9.1.2 Arthroscopy Devices | |
      3. 9.1.3 Braces & Supports | |
      4. 9.1.4 Prosthetics & Orthotics | |
      5. 9.1.5 Body Monitoring & Evaluation Products | |
      6. 9.1.6 Body Compression & Recovery Products | |
      7. 9.1.7 Accessories & Other Products |
    2. 9.2 By Application | |
      1. 9.2.1 Knee | |
      2. 9.2.2 Shoulder | |
      3. 9.2.3 Foot & Ankle | |
      4. 9.2.4 Hip & Groin | |
      5. 9.2.5 Elbow | |
      6. 9.2.6 Hand & Wrist | |
      7. 9.2.7 Spine | |
      8. 9.2.8 Other Injuries |
    3. 9.3 By End User | |
      1. 9.3.1 Hospitals | |
      2. 9.3.2 Ambulatory Surgical Centres (ASCs) | |
      3. 9.3.3 Home Care | |
      4. 9.3.4 Other End Users
  10. 10 Competitive Landscape |
    1. 10.1 Market Share Analysis (2026) |
    2. 10.2 Competitive Benchmarking Matrix |
    3. 10.3 Company Profiles | |
      1. 10.3.1 Arthrex, Inc. | |
      2. 10.3.2 Smith & Nephew plc | |
      3. 10.3.3 Stryker Corporation | |
      4. 10.3.4 DePuy Synthes (Johnson & Johnson) | |
      5. 10.3.5 CONMED Corporation | |
      6. 10.3.6 Zimmer Biomet Holdings | |
      7. 10.3.7 Enovis (DJO Global) | |
      8. 10.3.8 Össur hf. | |
      9. 10.3.9 Breg, Inc. | |
      10. 10.3.10 Bauerfeind AG | |
      11. 10.3.11 Performance Health
  11. 11 Recent News & Developments (2023–2025)
  12. 12 Report Scope & Methodology |
    1. 12.1 Study Period & Base Year |
    2. 12.2 Data Sources & Triangulation |
    3. 12.3 Abbreviations
  13. 13 Detailed Sources & Citations
  14. 14 Frequently Asked Questions (FAQs)
  15. 15 LIST OF TABLES |
  16. TABLE 1 Global Sports Medicine Market Size & Forecast, by Revenue (USD Billion), 2021–2035 |
  17. TABLE 2 Global Sports Medicine Market — Year-over-Year Growth Analysis, 2021–2035 |
  18. TABLE 3 Driver Impact Analysis Matrix, 2026–2035 |
  19. TABLE 4 Restraint Impact Analysis Matrix, 2026–2035 |
  20. TABLE 5 Global Sports Medicine Market Size, by Region, 2021–2035 (USD Billion) |
  21. TABLE 6 North America Sports Medicine Market Size, by Country, 2021–2035 (USD Billion) |
  22. TABLE 7 Europe Sports Medicine Market Size, by Country, 2021–2035 (USD Billion) |
  23. TABLE 8 Asia-Pacific Sports Medicine Market Size, by Country, 2021–2035 (USD Billion) |
  24. TABLE 9 South America Sports Medicine Market Size, by Country, 2021–2035 (USD Billion) |
  25. TABLE 10 Middle East & Africa Sports Medicine Market Size, by Country, 2021–2035 (USD Billion) |
  26. TABLE 11 Global Sports Medicine Market Size, by Product Type, 2021–2035 (USD Billion) |
  27. TABLE 12 Global Sports Medicine Market Size, by Application, 2021–2035 (USD Billion) |
  28. TABLE 13 Global Sports Medicine Market Size, by End User, 2021–2035 (USD Billion) |
  29. TABLE 14 North America Sports Medicine Market Size, by Product Type, 2021–2035 (USD Billion) |
  30. TABLE 15 North America Sports Medicine Market Size, by Application, 2021–2035 (USD Billion) |
  31. TABLE 16 North America Sports Medicine Market Size, by End User, 2021–2035 (USD Billion) |
  32. TABLE 17 Europe Sports Medicine Market Size, by Product Type, 2021–2035 (USD Billion) |
  33. TABLE 18 Europe Sports Medicine Market Size, by Application, 2021–2035 (USD Billion) |
  34. TABLE 19 Europe Sports Medicine Market Size, by End User, 2021–2035 (USD Billion) |
  35. TABLE 20 Asia-Pacific Sports Medicine Market Size, by Product Type, 2021–2035 (USD Billion) |
  36. TABLE 21 Asia-Pacific Sports Medicine Market Size, by Application, 2021–2035 (USD Billion) |
  37. TABLE 22 Asia-Pacific Sports Medicine Market Size, by End User, 2021–2035 (USD Billion) |
  38. TABLE 23 South America Sports Medicine Market Size, by Product Type, 2021–2035 (USD Billion) |
  39. TABLE 24 South America Sports Medicine Market Size, by Application, 2021–2035 (USD Billion) |
  40. TABLE 25 South America Sports Medicine Market Size, by End User, 2021–2035 (USD Billion) |
  41. TABLE 26 Middle East & Africa Sports Medicine Market Size, by Product Type, 2021–2035 (USD Billion) |
  42. TABLE 27 Middle East & Africa Sports Medicine Market Size, by Application, 2021–2035 (USD Billion) |
  43. TABLE 28 Middle East & Africa Sports Medicine Market Size, by End User, 2021–2035 (USD Billion) |
  44. TABLE 29 United States Sports Medicine Market Size, by Product Type, 2021–2035 (USD Billion) |
  45. TABLE 30 United States Sports Medicine Market Size, by Application, 2021–2035 (USD Billion) |
  46. TABLE 31 Germany Sports Medicine Market Size, by Product Type, 2021–2035 (USD Billion) |
  47. TABLE 32 Germany Sports Medicine Market Size, by End User, 2021–2035 (USD Billion) |
  48. TABLE 33 China Sports Medicine Market Size, by Product Type, 2021–2035 (USD Billion) |
  49. TABLE 34 China Sports Medicine Market Size, by Application, 2021–2035 (USD Billion) |
  50. TABLE 35 India Sports Medicine Market Size, by Product Type, 2021–2035 (USD Billion) |
  51. TABLE 36 India Sports Medicine Market Size, by End User, 2021–2035 (USD Billion) |
  52. TABLE 37 Japan Sports Medicine Market Size, by Application, 2021–2035 (USD Billion) |
  53. TABLE 38 Brazil Sports Medicine Market Size, by Product Type, 2021–2035 (USD Billion) |
  54. TABLE 39 Saudi Arabia Sports Medicine Market Size, by End User, 2021–2035 (USD Billion) |
  55. TABLE 40 Competitive Benchmarking Matrix — Global Sports Medicine Market, 2026 |
  56. TABLE 41 Company Profiles — Key Players, Global Sports Medicine Market |
  57. TABLE 42 Recent Developments & Strategic Announcements, 2023–2025 |
  58. TABLE 43 Report Scope & Methodology Summary |
  59. TABLE 44 Detailed Sources & Citations Index
  60. 16 LIST OF FIGURES |
  61. FIGURE 1 Global Sports Medicine Market — Market Dynamics Snapshot (Drivers, Restraints, Opportunities) |
  62. FIGURE 2 Industry Value Chain Analysis — Sports Medicine Market |
  63. FIGURE 3 Porter's Five Forces Analysis — Sports Medicine Market |
  64. FIGURE 4 Global Market Size Trend & Forecast, 2021–2035 (USD Billion) |
  65. FIGURE 5 Year-over-Year Growth Rate Trend, 2022–2035 (%) |
  66. FIGURE 6 Market Share by Product Type, 2025 vs 2035 (%) |
  67. FIGURE 7 Market Share by Application, 2025 vs 2035 (%) |
  68. FIGURE 8 Market Share by End User, 2025 vs 2035 (%) |
  69. FIGURE 9 Regional Market Share Distribution, 2025 (%) |
  70. FIGURE 10 Regional Market Share Distribution, 2035 (%) |
  71. FIGURE 11 Regional CAGR Comparison, 2026–2035 (%) |
  72. FIGURE 12 North America Country-Level Share Breakdown, 2025 (%) |
  73. FIGURE 13 Europe Country-Level Share Breakdown, 2025 (%) |
  74. FIGURE 14 Asia-Pacific Country-Level Share Breakdown, 2025 (%) |
  75. FIGURE 15 Competitive Landscape — Estimated Revenue Share by Company, 2026 (%) |
  76. FIGURE 16 Competitive Positioning Matrix — Portfolio Breadth vs Clinical Evidence Depth |
  77. FIGURE 17 Care Setting Migration — Hospital vs ASC Procedure Share, 2021–2035 |
  78. FIGURE 18 Driver Impact Weighting Chart, 2026–2035

Segmentation Quick Reference

DimensionSub-SegmentsDominant SegmentFastest Growing Segment
By Product TypeOrthopedic Implants; Arthroscopy Devices; Braces & Supports; Prosthetics & Orthotics; Body Monitoring & Evaluation Products; Body Compression & Recovery Products; Accessories & Other ProductsOrthopedic ImplantsBody Monitoring & Evaluation Products
By ApplicationKnee; Shoulder; Foot & Ankle; Hip & Groin; Elbow; Hand & Wrist; Spine; Other InjuriesKneeShoulder
By End UserHospitals; Ambulatory Surgical Centres (ASCs); Home Care; Other End UsersHospitalsAmbulatory Surgical Centres (ASCs)
By GeographyNorth America; Europe; Asia-Pacific; South America; Middle East & AfricaNorth AmericaAsia-Pacific


Market Segmentation Overview

By Product Type

Sub-SegmentKey Trend
Orthopedic ImplantsShift from metallic hardware toward all-suture and bioabsorbable fixation
Arthroscopy DevicesSingle-use consumable models replacing reusable instrument sets
Braces & SupportsConservative-first care pathways expand pre- and post-operative bracing
Prosthetics & OrthoticsAdaptive and para-athletics demand lifts specialist device design
Body Monitoring & Evaluation ProductsSensor-enabled recovery tracking creates subscription revenue
Body Compression & Recovery ProductsRecreational athlete self-care spending drives retail channel growth
Accessories & Other ProductsBundled procedure kits absorb accessory content into case pricing


Product economics are migrating away from one-time hardware sales toward consumables and connected recovery hardware. Vendors with instrument ecosystems that lock in disposable pull-through hold the strongest margin position through 2035.

By Application

Sub-SegmentKey Trend
KneeACL and meniscal repair volume remains the anchor procedure category
ShoulderRotator cuff repair displaces conservative management in older cohorts
Foot & AnkleRunning and court-sport participation growth widens indication base
Hip & GroinImproved recognition of femoroacetabular impingement lifts arthroscopy
ElbowOverhead-throwing athlete procedures concentrate in North America and Asia
Hand & WristContact-sport fracture management standardises around low-profile fixation
SpineCollision-sport axial injuries drive specialist referral pathways
Other InjuriesSoft tissue and muscle repair benefits from biologic adjunct research


Load-bearing joints dominate revenue, but the fastest incremental gains sit in shoulder and hip, where diagnostic imaging access has expanded the addressable patient pool faster than surgical capacity has grown.

By End User

Sub-SegmentKey Trend
HospitalsRetain complex, revision, and comorbid cases as routine volume departs
Ambulatory Surgical Centres (ASCs)Reimbursement parity and surgeon ownership accelerate procedure migration
Home CareTele-rehabilitation and post-operative bracing extend the care episode
Other End UsersUniversity, club, and team facilities adopt screening and prevention tools


Care-setting migration is the defining structural shift of the forecast decade. Suppliers that redesign inventory, instrumentation, and service models around low-overhead ambulatory environments will capture disproportionate share of incremental growth.

By Region

Sub-SegmentKey Trend
North AmericaASC buildout and biologics adoption sustain global price leadership
EuropeRegulatory compliance costs consolidate supply while day-case pathways expand
Asia-PacificLocal manufacturing incentives and sports science investment drive fastest growth
South AmericaFootball-driven injury volume and private insurance expansion underpin demand
Middle East & AfricaSovereign sports programmes and medical tourism build new clinical capacity


Geographic momentum is shifting east and south. While North America remains the revenue centre of gravity through 2035, more than a third of incremental global growth over the forecast period originates in Asia-Pacific and the Middle East.




Download PDF ×

We do not share your information with anyone. However, we may send you emails based on your report interest from time to time. You may contact us at any time to opt-out.