Spinal Cord Stimulator Market
ID: MRFR/HC/7310-HCR
200 Pages
Satyendra Maurya
Last Updated: May 15, 2026
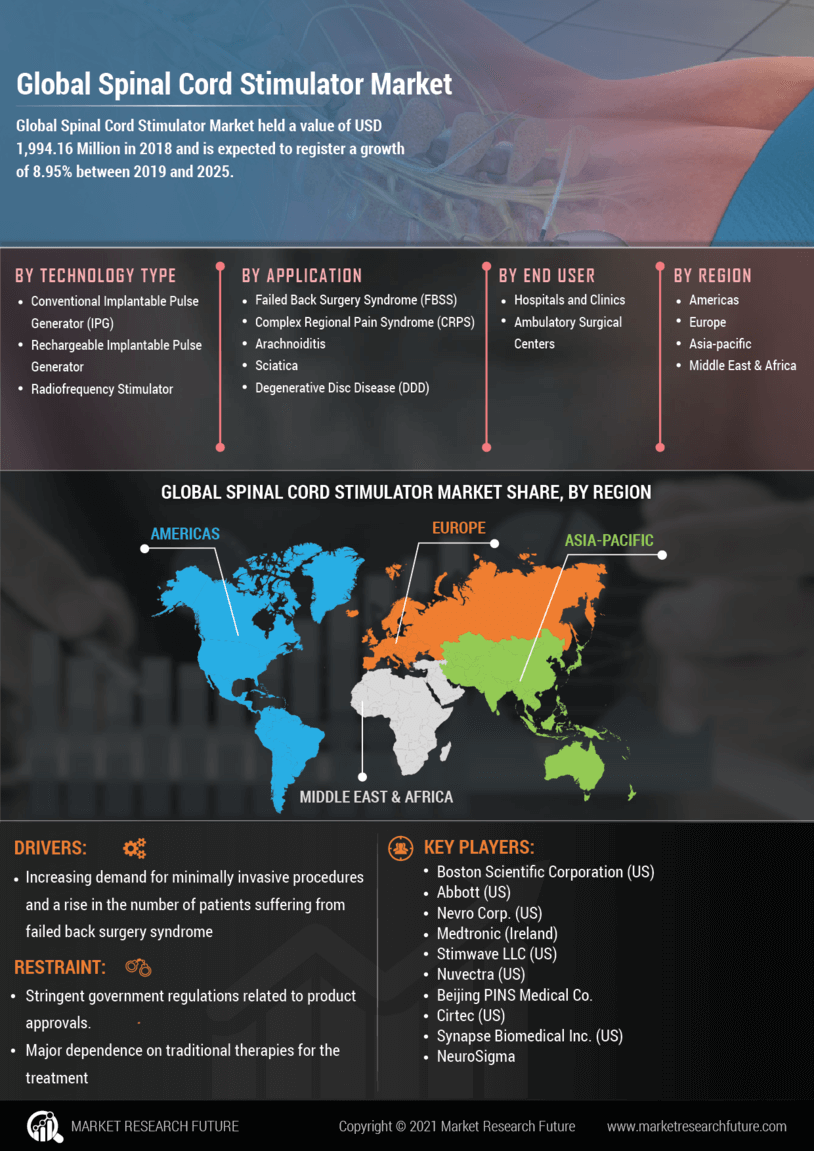
Spinal Cord Stimulator Market Research Report: Size, Share, Trend Analysis By Types (Non-Implantable, Implantable, Rechargeable, Non-Rechargeable), By Applications (Chronic Pain Management, Neuropathic Pain, Decompression Syndrome, Failed Back Surgery Syndrome), By End Users (Hospitals, Ambulatory Surgical Centers, Pain Management Clinics, Home Care Settings), By Technology (Conventional Spinal Cord Stimulators, Burst Spinal Cord Stimulators, High-Frequency Spinal Cord Stimulators) and By Regional (North America, Europe, South America, Asia Pacific, Middle East and Africa) - Growth Outlook & Industry Forecast 2025 To 2035