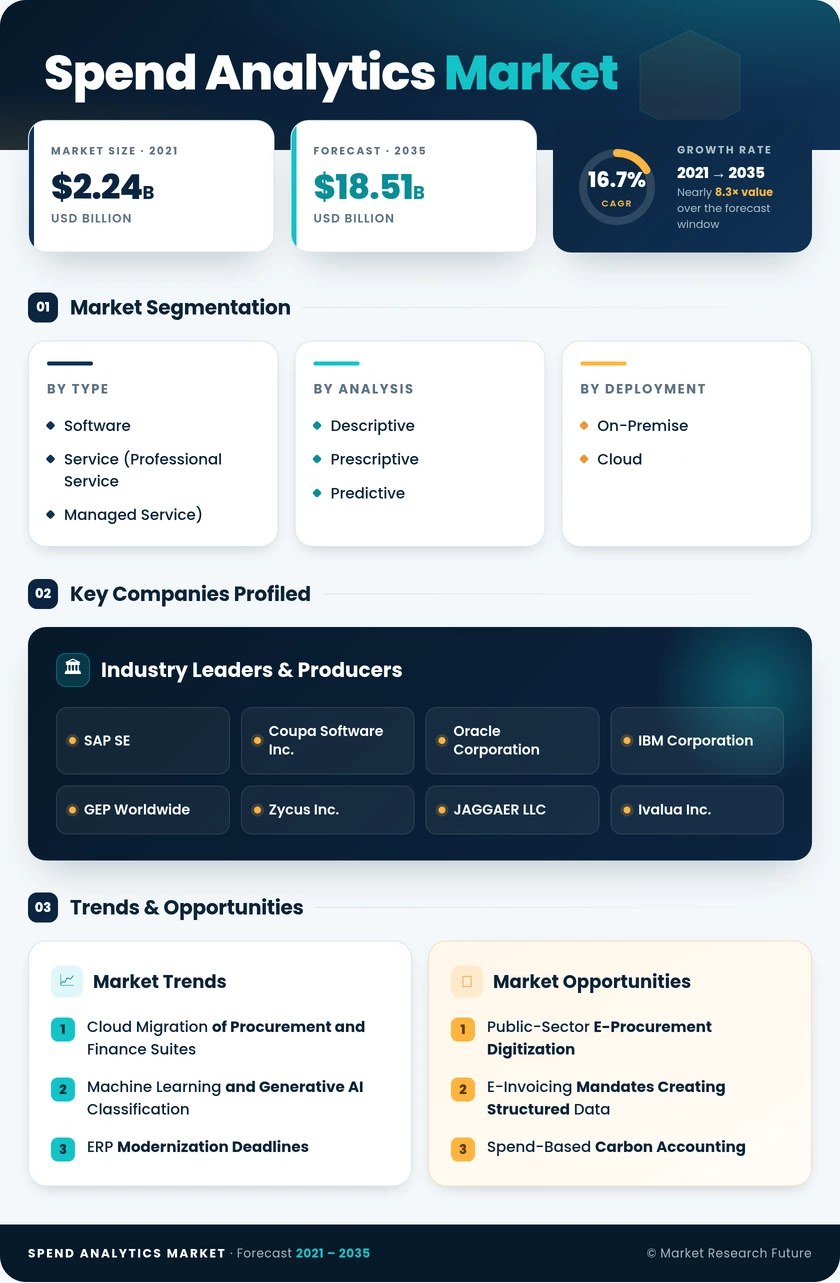
Spend Analytics Market (2026 - 2035)

ID: MRFR/ICT/30918-HCR 100 Pages Aarti Dhapte Last Updated: October 23, 2026
Spend Analytics Market Size, Share and Research Report By Type (Software, Service (Professional Service, and Managed Service)), By Analysis (Descriptive, Prescriptive, and Predictive), By Deployment (On-Premise, and Cloud), By End-user Industry (Manufacturing, Supply Chain & Logistic, Retail, BFSI, IT & Telecommunication, Education, Healthcare, and Other End-user Industries) And By Region (North America, Europe, Asia-Pacific, And Rest Of The World) – Industry Forecast Till 2035
Spend Analytics Market
Market Size
Forecast Period2026-2035
CAGR (2026-2035)16.7%
2025 Market SizeUSD 3.95 Billion
2035 Market SizeUSD 18.51 Billion
Key Players
SAP SE
Coupa Software Inc.
Oracle Corporation
IBM Corporation
GEP Worldwide
Zycus Inc.
Opportunities
  • Spend-Based Carbon Accounting
  • Emerging-Market Expansion
  • Benchmarking and Data Monetization
  1. 1 Market Summary | |
  2. 2 Key Report Takeaways | |
    1. 2.1 By Type | |
    2. 2.2 By Analysis | |
    3. 2.3 By Deployment | |
    4. 2.4 By End-user Industry | |
    5. 2.5 By Region | |
  3. 3 Market Size and Forecast (2021–2035) | |
  4. 4 Driver Impact Analysis | |
    1. 4.1 Cloud Migration of Procurement and Finance Suites | |
    2. 4.2 Machine Learning and Generative AI Classification | |
    3. 4.3 ERP Modernization Deadlines | |
    4. 4.4 Scope 3 and ESG Disclosure Mandates | |
    5. 4.5 Inflation and Cost-Reduction Pressure | |
    6. 4.6 Public-Sector E-Procurement Digitization | |
    7. 4.7 E-Invoicing Mandates Creating Structured Data | |
  5. 5 Restraints Impact Analysis | |
    1. 5.1 Data Quality and Taxonomy Inconsistency | |
    2. 5.2 Data Privacy and Security Concerns | |
    3. 5.3 Uncertain Return on Investment | |
    4. 5.4 Legacy System Migration Complexity | |
    5. 5.5 Analytics Talent Shortage | |
  6. 6 Opportunities | |
    1. 6.1 Spend-Based Carbon Accounting | |
    2. 6.2 Emerging-Market Expansion | |
    3. 6.3 Benchmarking and Data Monetization | |
    4. 6.4 Mid-Market Packaged Offerings | |
    5. 6.5 Tariff and Supply-Risk Scenario Modeling | |
  7. 7 Regional Market Share and Country-Level Analysis | |
    1. 7.1 North America | | |
      1. 7.1.1 United States | | |
      2. 7.1.2 Canada | | |
      3. 7.1.3 Mexico | |
    2. 7.2 Europe | | |
      1. 7.2.1 Germany | | |
      2. 7.2.2 United Kingdom | | |
      3. 7.2.3 France | | |
      4. 7.2.4 Italy | | |
      5. 7.2.5 Spain | | |
      6. 7.2.6 Nordic Countries | | |
      7. 7.2.7 Russia | | |
      8. 7.2.8 Rest of Europe | |
    3. 7.3 Asia-Pacific | | |
      1. 7.3.1 China | | |
      2. 7.3.2 India | | |
      3. 7.3.3 Japan | | |
      4. 7.3.4 South Korea | | |
      5. 7.3.5 ASEAN | | |
      6. 7.3.6 Rest of Asia-Pacific | |
    4. 7.4 Latin America | | |
      1. 7.4.1 Brazil | | |
      2. 7.4.2 Argentina | | |
      3. 7.4.3 Rest of Latin America | |
    5. 7.5 Middle East & Africa | | |
      1. 7.5.1 Saudi Arabia | | |
      2. 7.5.2 UAE | | |
      3. 7.5.3 South Africa | | |
      4. 7.5.4 Egypt | | |
      5. 7.5.5 Rest of Middle East & Africa | |
  8. 8 Future Outlook (2026–2035) | |
    1. 8.1 Agentic AI and Autonomous Sourcing | |
    2. 8.2 Suite Consolidation versus Best-of-Breed | |
    3. 8.3 Sustainability-Linked Procurement | |
    4. 8.4 Continuous, Transaction-Level Visibility | |
  9. 9 Segmentation Analysis | |
    1. 9.1 By Type | | |
      1. 9.1.1 Software | | |
      2. 9.1.2 Service | | | |
        1. 9.1.2.1 Professional Service | | | |
        2. 9.1.2.2 Managed Service | |
    2. 9.2 By Analysis | | |
      1. 9.2.1 Descriptive | | |
      2. 9.2.2 Prescriptive | | |
      3. 9.2.3 Predictive | |
    3. 9.3 By Deployment | | |
      1. 9.3.1 On-Premise | | |
      2. 9.3.2 Cloud | |
    4. 9.4 By End-user Industry | | |
      1. 9.4.1 Manufacturing | | |
      2. 9.4.2 Supply Chain & Logistic | | |
      3. 9.4.3 Retail | | |
      4. 9.4.4 BFSI | | |
      5. 9.4.5 IT & Telecommunication | | |
      6. 9.4.6 Education | | |
      7. 9.4.7 Healthcare | | |
      8. 9.4.8 Other End-user Industries | |
  10. 10 Competitive Landscape | |
  11. 11 Recent News & Developments | |
  12. 12 Report Scope and Methodology | |
  13. 13 Detailed Sources and Citations | |
  14. 14 Frequently Asked Questions (FAQs) | | LIST OF TABLES | |
  15. TABLE 1 Market Snapshot Summary, 2025–2035 | |
  16. TABLE 2 Global Market Size & Forecast, 2021–2035 (USD Billion) | |
  17. TABLE 3 Driver Impact Analysis | |
  18. TABLE 4 Restraints Impact Analysis | |
  19. TABLE 5 Regional Summary, 2025 | |
  20. TABLE 6 North America, by Country, 2025 | |
  21. TABLE 7 Europe, by Country, 2025 | |
  22. TABLE 8 Asia-Pacific, by Country, 2025 | |
  23. TABLE 9 Latin America, by Country, 2025 | |
  24. TABLE 10 Middle East & Africa, by Country, 2025 | |
  25. TABLE 11 Segmentation by Type, 2025 | |
  26. TABLE 12 Segmentation by Analysis, 2025 | |
  27. TABLE 13 Segmentation by Deployment, 2025 | |
  28. TABLE 14 Segmentation by End-user Industry, 2025 | |
  29. TABLE 15 Competitive Benchmarking Matrix | |
  30. TABLE 16 Report Scope and Methodology | |
  31. TABLE 17 Detailed Sources and Citations | |
  32. TABLE 18 Segmentation Quick Reference | | LIST OF FIGURES | |
  33. FIGURE 1 Market Dynamics Overview — Drivers, Restraints and Opportunities | |
  34. FIGURE 2 Industry Value Chain Analysis | |
  35. FIGURE 3 Porter's Five Forces Analysis | |
  36. FIGURE 4 Global Market Size Trend, 2021–2035 (USD Billion) | |
  37. FIGURE 5 Share by Type, 2025 | |
  38. FIGURE 6 Share by Analysis, 2025 | |
  39. FIGURE 7 Share by Deployment, 2025 | |
  40. FIGURE 8 Share by End-user Industry, 2025 | |
  41. FIGURE 9 Regional Share, 2025 | |
  42. FIGURE 10 Country-Level Growth Comparison, 2026–2035 | |
  43. FIGURE 11 Competitive Positioning Matrix | |
  44. FIGURE 12 Vendor Revenue Share Ranges, 2025

Segmentation Quick Reference

DimensionSub-SegmentsDominant SegmentFastest Growing Segment
By TypeSoftware; Service (Professional Service, Managed Service)Software (64.0% share)Service (18.9% CAGR)
By AnalysisDescriptive; Prescriptive; PredictiveDescriptive (46.0% share)Predictive (19.6% CAGR)
By DeploymentOn-Premise; CloudCloud (18.4% CAGR)Cloud (18.4% CAGR)
By End-user IndustryManufacturing; Supply Chain & Logistic; Retail; BFSI; IT & Telecommunication; Education; Healthcare; Other End-user IndustriesManufacturing (22.5% share)Healthcare (19.2% CAGR)
By RegionNorth America; Europe; Asia-Pacific; Latin America; Middle East & AfricaNorth America (38.5% share)Asia-Pacific (19.8% CAGR)

Market Segmentation Overview

By Type

Sub-SegmentKey Trend
SoftwareAI classification engines and embedded copilots
ServiceShift from project work to recurring contracts
Professional ServiceSpend baselining bundled into ERP migrations
Managed ServiceOutsourced cleansing, enrichment and classification

Software leads with a 64.0% share because classification engines and spend cubes are the core purchase in nearly every program. Service grows fastest, at an 18.9% CAGR. Within it, Managed Service contracts expand as buyers outsource recurring data cleansing, while Professional Service teams handle taxonomy design and ERP integration.

By Analysis

Sub-SegmentKey Trend
DescriptiveCategory roll-ups and supplier visibility as the entry point
PrescriptiveAutomated savings and consolidation recommendations
PredictiveMachine-learning price, demand and risk forecasts

Descriptive analysis leads with a 46.0% share, since category roll-ups and supplier visibility come first in any deployment. Predictive analysis grows fastest, at a 19.6% CAGR, as machine-learning forecasts of prices and supplier risk mature. Prescriptive tools then convert those forecasts into recommended sourcing actions.

By Deployment

Sub-SegmentKey Trend
On-PremiseRetained under data residency and defense security rules
CloudMulti-tenant benchmarks and continuous model updates

Cloud leads and grows fastest, at an 18.4% CAGR, helped by shorter deployments, continuous model updates and community benchmarks. On-Premise remains relevant in defense, government and banking, where data residency rules restrict multi-tenant hosting. Sovereign cloud options are gradually eroding that installed base.

By End-user Industry

Sub-SegmentKey Trend
ManufacturingDirect-material and commodity price analytics
Supply Chain & LogisticFreight and carrier spend volatility tracking
RetailPrivate-label sourcing and margin protection
BFSIThird-party risk and vendor rationalization
IT & TelecommunicationCloud and software license optimization
EducationPublic funding accountability reporting
HealthcareHospital supply cost control
Other End-user IndustriesEnergy, public sector and hospitality programs

Manufacturing leads with a 22.5% share, driven by direct-material complexity and commodity price exposure. Healthcare grows fastest, at a 19.2% CAGR, as hospital systems tighten supply cost control. Supply Chain & Logistic and Retail buyers concentrate on freight volatility and private-label sourcing, respectively.


Download PDF ×

We do not share your information with anyone. However, we may send you emails based on your report interest from time to time. You may contact us at any time to opt-out.