Table of Contents
1. Executive Summary
1.1. Market Attractiveness Analysis
1.1.1. Global Space Launch Services Market, by Service Type
1.1.2. Global Space Launch Services Market, by Orbit
1.1.3. Global Space Launch Services Market, by Size
1.1.4. Global Space Launch Services Market, by End Use
1.1.5. Global Space Launch Services Market, by Region
2. Market Introduction
2.1. Market Definition
2.2. Scope of the Study
2.3. Market Structure
2.4. Key Buying Criteria
2.5. Market Factor Indicator Analysis
3. Research Methodology
3.1. Research Process
3.2. Primary Research
3.3. Secondary Research
3.4. Market Size Estimation
3.5. Forecast Model
3.6. List of Assumptions
4. Market Insights
5. Market Dynamics
5.1. Introduction
5.2. Drivers
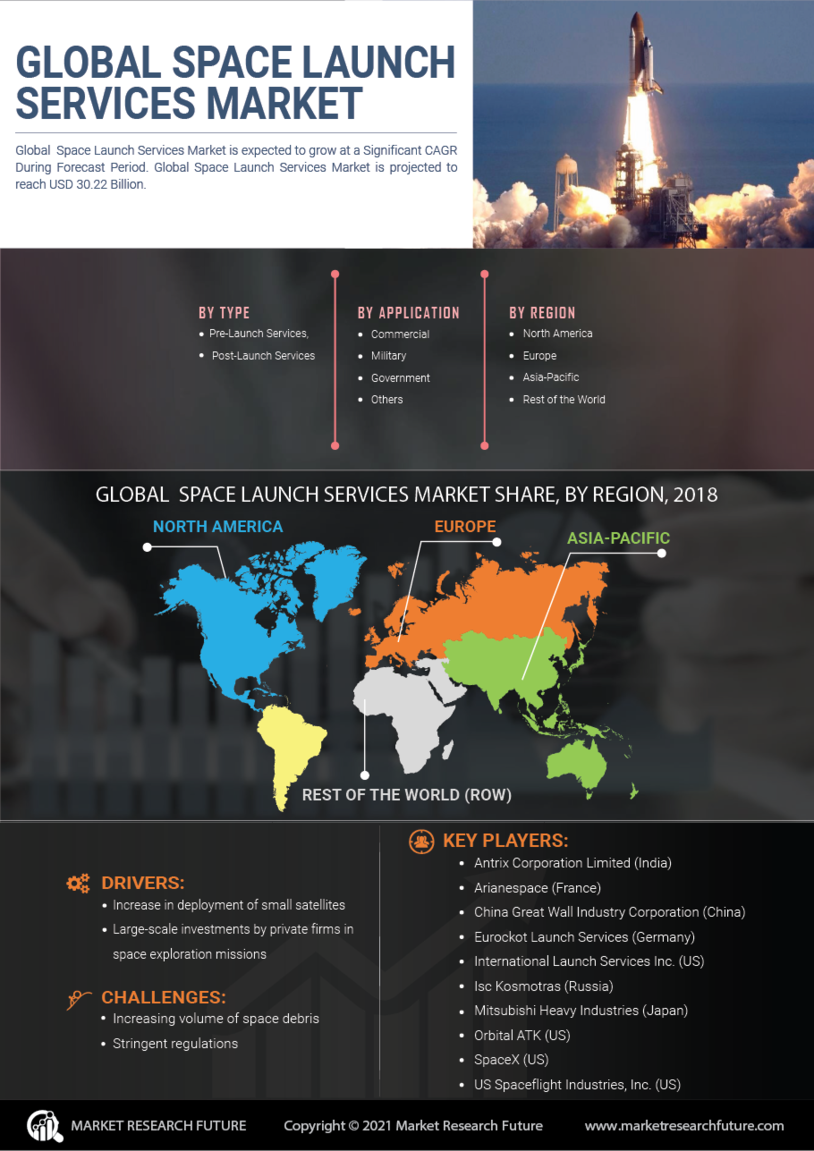
5.2.1. Increase in Deployment of Small Satellites
5.2.2. Large-Scale Investments by Private Firms in Space Exploration Missions
5.2.3. Drivers Impact Analysis
5.3. Restraints
5.3.1. Increasing Volume of Space Debris
5.3.2. Stringent Regulations
5.3.3. Restraint Impact Analysis
5.4. Opportunities
5.4.1. Technological Advancements to Lower Cost of Spacecraft Launches
5.5. Market/Technological Trends
5.6. Patent Trends
5.7. Regulatory Landscape/Standards
6. Market Factor Analysis
6.1. Value Chain/Supply Chain Analysis
6.1.1. R&D
6.1.2. Manufacturing
6.1.3. Distribution & Sales
6.1.4. Post-Sales Monitoring
6.2. Porterβs Five Forces Analysis
6.2.1. Threat of New Entrants
6.2.2. Bargaining Power of Buyers
6.2.3. Threat of Substitutes
6.2.4. Rivalry
6.2.5. Bargaining Power of Suppliers
7. Global Space Launch Services Market, by Service Type
7.1. Introduction
7.2. Pre-Launch Services
7.3. Post-Launch Services
8. Global Space Launch Services Market, by Orbit
8.1. Introduction
8.2. Low Earth Orbit
8.3. Medium Earth Orbit
8.4. Geosynchronous Orbit
8.5. Beyond Geosynchronous Orbit
9. Global Space Launch Services Market, by Size
9.1. Introduction
9.2. Small Lift Launch Vehicles (Less than 350,000 Kg)
9.3. Medium to Heavy Vehicles (More than 350,000 Kg)
10. Global Space Launch Services Market, by End Use
10.1. Introduction
10.2. Commercial
10.3. Military & Government
11. Global Space Launch Services Market, by Region
11.1. Introduction
11.2. North America
11.2.1. US
11.2.2. Canada
11.3. Europe
11.3.1. UK
11.3.2. Germany
11.3.3. France
11.3.4. Italy
11.3.5. Rest of Europe
11.4. Asia-Pacific
11.4.1. China
11.4.2. Japan
11.4.3. India
11.4.4. Australia
11.4.5. Rest of Asia-Pacific
11.5. Middle East & Africa
11.5.1. Saudi Arabia
11.5.2. UAE
11.5.3. Rest of the Middle East & Africa
11.6. Latin America
11.6.1. Brazil
11.6.2. Rest of Latin America
12. Competitive Landscape
12.1. Competitive Overview
12.2. Competitor Dashboard
12.3. Major Growth Strategies in the Global Space Launch Services Market
12.4. Competitive Benchmarking
12.5. Market Share Analysis
12.6. Leading Player in Terms of Number of Developments in the Global Space Launch Services Market
12.7. Key Developments & Growth Strategies
12.7.1. New Service Launches
12.7.2. Mergers & Acquisitions
12.7.3. Joint Ventures
13. Company Profiles
13.1. Key Market Players
13.1.1. Antrix Corporation Limited
13.1.1.1. Company Overview
13.1.1.2. Products Offered
13.1.1.3. Financial Overview
13.1.1.4. Key Developments
13.1.1.5. SWOT Analysis
13.1.1.6. Key Strategies
13.1.2. Arianespace
13.1.3. China Great Wall Industry Corporation
13.1.4. Eurockot Launch Services
13.1.5. International Launch Services Inc.
13.1.6. Isc Kosmotras
13.1.7. Mitsubishi Heavy Industries
13.1.8. Orbital ATK
13.1.9. SpaceX
13.1.10. US Spaceflight Industries, Inc.
14. Appendix
14.1. References
14.2. Related Reports
14.3. List of Abbreviationsβ
List of Tables
TABLE 1 LIST OF ASSUMPTIONS
TABLE 2 MAJOR PATENTS GRANTED FOR SPACE LAUNCH SERVICES (2014β2019)
TABLE 3 GLOBAL SPACE LAUNCH SERVICES MARKET, BY SERVICE TYPE 2020β2027 (USD MILLION)
TABLE 4 GLOBAL SPACE LAUNCH SERVICES MARKET, BY ORBIT 2020β2027 (USD MILLION)
TABLE 5 GLOBAL SPACE LAUNCH SERVICES MARKET, BY SIZE 2020β2027 (USD MILLION)
TABLE 6 GLOBAL SPACE LAUNCH SERVICES MARKET, BY END USE 2020β2027 (USD MILLION)
TABLE 7 GLOBAL SPACE LAUNCH SERVICES MARKET, BY REGION, 2020β2027 (USD MILLION)
TABLE 8 NORTH AMERICA: SPACE LAUNCH SERVICES MARKET, BY COUNTRY, 2020β2027 (USD MILLION)
TABLE 9 NORTH AMERICA: SPACE LAUNCH SERVICES MARKET, BY SERVICE TYPE, 2020β2027 (USD MILLION)
TABLE 10 NORTH AMERICA: SPACE LAUNCH SERVICES MARKET, BY ORBIT, 2020β2027 (USD MILLION)
TABLE 11 NORTH AMERICA: SPACE LAUNCH SERVICES MARKET, BY SIZE, 2020β2027 (USD MILLION)
TABLE 12 NORTH AMERICA: SPACE LAUNCH SERVICES MARKET, BY END USE, 2020β2027 (USD MILLION)
TABLE 13 US: SPACE LAUNCH SERVICES MARKET, BY SERVICE TYPE, 2020β2027 (USD MILLION)
TABLE 14 US: SPACE LAUNCH SERVICES MARKET, BY ORBIT, 2020β2027 (USD MILLION)
TABLE 15 US: SPACE LAUNCH SERVICES MARKET, BY SIZE, 2020β2027 (USD MILLION)
TABLE 16 US: SPACE LAUNCH SERVICES MARKET, BY END USE, 2020β2027 (USD MILLION)
TABLE 17 CANADA: SPACE LAUNCH SERVICES MARKET, BY SERVICE TYPE, 2020β2027 (USD MILLION)
TABLE 18 CANADA: SPACE LAUNCH SERVICES MARKET, BY ORBIT, 2020β2027 (USD MILLION)
TABLE 19 CANADA: SPACE LAUNCH SERVICES MARKET, BY SIZE, 2020β2027 (USD MILLION)
TABLE 20 CANADA: SPACE LAUNCH SERVICES MARKET, BY END USE, 2020β2027 (USD MILLION)
TABLE 21 EUROPE: SPACE LAUNCH SERVICES MARKET, BY COUNTRY, 2020β2027 (USD MILLION)
TABLE 22 EUROPE: SPACE LAUNCH SERVICES MARKET, BY SERVICE TYPE, 2020β2027 (USD MILLION)
TABLE 23 EUROPE: SPACE LAUNCH SERVICES MARKET, BY ORBIT, 2020β2027 (USD MILLION)
TABLE 24 EUROPE: SPACE LAUNCH SERVICES MARKET, BY SIZE, 2020β2027 (USD MILLION)
TABLE 25 EUROPE: SPACE LAUNCH SERVICES MARKET, BY END USE, 2020β2027 (USD MILLION)
TABLE 26 UK: SPACE LAUNCH SERVICES MARKET, BY SERVICE TYPE, 2020β2027 (USD MILLION)
TABLE 27 UK: SPACE LAUNCH SERVICES MARKET, BY ORBIT, 2020β2027 (USD MILLION)
TABLE 28 UK: SPACE LAUNCH SERVICES MARKET, BY SIZE, 2020β2027 (USD MILLION)
TABLE 29 UK: SPACE LAUNCH SERVICES MARKET, BY END USE, 2020β2027 (USD MILLION)
TABLE 30 GERMANY: SPACE LAUNCH SERVICES MARKET, BY SERVICE TYPE, 2020β2027 (USD MILLION)
TABLE 31 GERMANY: SPACE LAUNCH SERVICES MARKET, BY ORBIT, 2020β2027 (USD MILLION)
TABLE 32 GERMANY: SPACE LAUNCH SERVICES MARKET, BY SIZE, 2020β2027 (USD MILLION)
TABLE 33 GERMANY: SPACE LAUNCH SERVICES MARKET, BY END USE, 2020β2027 (USD MILLION)
TABLE 34 FRANCE: SPACE LAUNCH SERVICES MARKET, BY SERVICE TYPE, 2020β2027 (USD MILLION)
TABLE 35 FRANCE: SPACE LAUNCH SERVICES MARKET, BY ORBIT, 2020β2027 (USD MILLION)
TABLE 36 FRANCE: SPACE LAUNCH SERVICES MARKET, BY SIZE, 2020β2027 (USD MILLION)
TABLE 37 FRANCE: SPACE LAUNCH SERVICES MARKET, BY END USE, 2020β2027 (USD MILLION)
TABLE 38 ITALY: SPACE LAUNCH SERVICES MARKET, BY SERVICE TYPE, 2020β2027 (USD MILLION)
TABLE 39 ITALY: SPACE LAUNCH SERVICES MARKET, BY ORBIT, 2020β2027 (USD MILLION)
TABLE 40 ITALY: SPACE LAUNCH SERVICES MARKET, BY SIZE, 2020β2027 (USD MILLION)
TABLE 41 ITALY: SPACE LAUNCH SERVICES MARKET, BY END USE, 2020β2027 (USD MILLION)
TABLE 42 REST OF EUROPE: SPACE LAUNCH SERVICES MARKET, BY SERVICE TYPE, 2020β2027 (USD MILLION)
TABLE 43 REST OF EUROPE: SPACE LAUNCH SERVICES MARKET, BY ORBIT, 2020β2027 (USD MILLION)
TABLE 44 REST OF EUROPE: SPACE LAUNCH SERVICES MARKET, BY SIZE, 2020β2027 (USD MILLION)
TABLE 45 REST OF EUROPE: SPACE LAUNCH SERVICES MARKET, BY END USE, 2020β2027 (USD MILLION)
TABLE 46 ASIA-PACIFIC: SPACE LAUNCH SERVICES MARKET, BY COUNTRY, 2020β2027 (USD MILLION)
TABLE 47 ASIA-PACIFIC: SPACE LAUNCH SERVICES MARKET, BY SERVICE TYPE, 2020β2027 (USD MILLION)
TABLE 48 ASIA-PACIFIC: SPACE LAUNCH SERVICES MARKET, BY ORBIT, 2020β2027 (USD MILLION)
TABLE 49 ASIA-PACIFIC: SPACE LAUNCH SERVICES MARKET, BY SIZE, 2020β2027 (USD MILLION)
TABLE 50 ASIA-PACIFIC: SPACE LAUNCH SERVICES MARKET, BY END USE, 2020β2027 (USD MILLION)
TABLE 51 CHINA: SPACE LAUNCH SERVICES MARKET, BY SERVICE TYPE, 2020β2027 (USD MILLION)
TABLE 52 CHINA: SPACE LAUNCH SERVICES MARKET, BY ORBIT, 2020β2027 (USD MILLION)
TABLE 53 CHINA: SPACE LAUNCH SERVICES MARKET, BY SIZE, 2020β2027 (USD MILLION)
TABLE 54 CHINA: SPACE LAUNCH SERVICES MARKET, BY END USE, 2020β2027 (USD MILLION)
TABLE 55 INDIA: SPACE LAUNCH SERVICES MARKET, BY SERVICE TYPE, 2020β2027 (USD MILLION)
TABLE 56 INDIA: SPACE LAUNCH SERVICES MARKET, BY ORBIT, 2020β2027 (USD MILLION)
TABLE 57 INDIA: SPACE LAUNCH SERVICES MARKET, BY SIZE, 2020β2027 (USD MILLION)
TABLE 58 INDIA: SPACE LAUNCH SERVICES MARKET, BY END USE, 2020β2027 (USD MILLION)
TABLE 59 JAPAN: SPACE LAUNCH SERVICES MARKET, BY SERVICE TYPE, 2020β2027 (USD MILLION)
TABLE 60 JAPAN: SPACE LAUNCH SERVICES MARKET, BY ORBIT, 2020β2027 (USD MILLION)
TABLE 61 JAPAN: SPACE LAUNCH SERVICES MARKET, BY SIZE, 2020β2027 (USD MILLION)
TABLE 62 JAPAN: SPACE LAUNCH SERVICES MARKET, BY END USE, 2020β2027 (USD MILLION)
TABLE 63 AUSTRALIA: SPACE LAUNCH SERVICES MARKET, BY SERVICE TYPE, 2020β2027 (USD MILLION)
TABLE 64 AUSTRALIA: SPACE LAUNCH SERVICES MARKET, BY ORBIT, 2020β2027 (USD MILLION)
TABLE 65 AUSTRALIA: SPACE LAUNCH SERVICES MARKET, BY SIZE, 2020β2027 (USD MILLION)
TABLE 66 AUSTRALIA: SPACE LAUNCH SERVICES MARKET, BY END USE, 2020β2027 (USD MILLION)
TABLE 67 REST OF ASIA-PACIFIC: SPACE LAUNCH SERVICES MARKET, BY SERVICE TYPE, 2020β2027 (USD MILLION)
TABLE 68 REST OF ASIA-PACIFIC: SPACE LAUNCH SERVICES MARKET, BY ORBIT, 2020β2027 (USD MILLION)
TABLE 69 REST OF ASIA-PACIFIC: SPACE LAUNCH SERVICES MARKET, BY SIZE, 2020β2027 (USD MILLION)
TABLE 70 REST OF ASIA-PACIFIC: SPACE LAUNCH SERVICES MARKET, BY END USE, 2020β2027 (USD MILLION)
TABLE 71 MIDDLE EAST & AFRICA: SPACE LAUNCH SERVICES MARKET, BY COUNTRY, 2020β2027 (USD MILLION)
TABLE 72 MIDDLE EAST & AFRICA: SPACE LAUNCH SERVICES MARKET, BY SERVICE TYPE, 2020β2027 (USD MILLION)
TABLE 73 MIDDLE EAST & AFRICA: SPACE LAUNCH SERVICES MARKET, BY ORBIT, 2020β2027 (USD MILLION)
TABLE 74 MIDDLE EAST & AFRICA: SPACE LAUNCH SERVICES MARKET, BY SIZE, 2020β2027 (USD MILLION)
TABLE 75 MIDDLE EAST & AFRICA: SPACE LAUNCH SERVICES MARKET, BY END USE, 2020β2027 (USD MILLION)
TABLE 76 SAUDI ARABIA: SPACE LAUNCH SERVICES MARKET, BY SERVICE TYPE, 2020β2027 (USD MILLION)
TABLE 77 SAUDI ARABIA: SPACE LAUNCH SERVICES MARKET, BY ORBIT, 2020β2027 (USD MILLION)
TABLE 78 SAUDI ARABIA: SPACE LAUNCH SERVICES MARKET, BY SIZE, 2020β2027 (USD MILLION)
TABLE 79 SAUDI ARABIA: SPACE LAUNCH SERVICES MARKET, BY END USE, 2020β2027 (USD MILLION)
TABLE 80 UAE: SPACE LAUNCH SERVICES MARKET, BY SERVICE TYPE, 2020β2027 (USD MILLION)
TABLE 81 UAE: SPACE LAUNCH SERVICES MARKET, BY ORBIT, 2020β2027 (USD MILLION)
TABLE 82 UAE: SPACE LAUNCH SERVICES MARKET, BY SIZE, 2020β2027 (USD MILLION)
TABLE 83 UAE: SPACE LAUNCH SERVICES MARKET, BY END USE, 2020β2027 (USD MILLION)
TABLE 84 REST OF THE MIDDLE EAST & AFRICA: SPACE LAUNCH SERVICES MARKET, BY SERVICE TYPE, 2020β2027 (USD MILLION)
TABLE 85 REST OF THE MIDDLE EAST & AFRICA: SPACE LAUNCH SERVICES MARKET, BY ORBIT, 2020β2027 (USD MILLION)
TABLE 86 REST OF THE MIDDLE EAST & AFRICA: SPACE LAUNCH SERVICES MARKET, BY SIZE, 2020β2027 (USD MILLION)
TABLE 87 REST OF THE MIDDLE EAST & AFRICA: SPACE LAUNCH SERVICES MARKET, BY END USE, 2020β2027 (USD MILLION)
TABLE 88 LATIN AMERICA: SPACE LAUNCH SERVICES MARKET, BY COUNTRY, 2020β2027 (USD MILLION)
TABLE 89 LATIN AMERICA: SPACE LAUNCH SERVICES MARKET, BY SERVICE TYPE, 2020β2027 (USD MILLION)
TABLE 90 LATIN AMERICA: SPACE LAUNCH SERVICES MARKET, BY ORBIT, 2020β2027 (USD MILLION)
TABLE 91 LATIN AMERICA: SPACE LAUNCH SERVICES MARKET, BY SIZE, 2020β2027 (USD MILLION)
TABLE 92 LATIN AMERICA: SPACE LAUNCH SERVICES MARKET, BY END USE, 2020β2027 (USD MILLION)
TABLE 93 BRAZIL: SPACE LAUNCH SERVICES MARKET, BY SERVICE TYPE, 2020β2027 (USD MILLION)
TABLE 94 BRAZIL: SPACE LAUNCH SERVICES MARKET, BY ORBIT, 2020β2027 (USD MILLION)
TABLE 95 BRAZIL: SPACE LAUNCH SERVICES MARKET, BY SIZE, 2020β2027 (USD MILLION)
TABLE 96 BRAZIL: SPACE LAUNCH SERVICES MARKET, BY END USE, 2020β2027 (USD MILLION)
TABLE 97 REST OF LATIN AMERICA: SPACE LAUNCH SERVICES MARKET, BY SERVICE TYPE, 2020β2027 (USD MILLION)
TABLE 98 REST OF LATIN AMERICA: SPACE LAUNCH SERVICES MARKET, BY ORBIT, 2020β2027 (USD MILLION)
TABLE 99 REST OF LATIN AMERICA: SPACE LAUNCH SERVICES MARKET, BY SIZE, 2020β2027 (USD MILLION)
TABLE 100 REST OF LATIN AMERICA: SPACE LAUNCH SERVICES MARKET, BY END USE, 2020β2027 (USD MILLION)
TABLE 101 THE MOST ACTIVE PLAYERS IN THE GLOBAL SPACE LAUNCH SERVICES MARKET
TABLE 102 CONTRACTS & AGREEMENTS
TABLE 103 MERGERS & ACQUISITIONS
TABLE 104 NEW SERVICE LAUNCHES
TABLE 105 EXPANSIONS & INVESTMENTS
TABLE 106 JOINT VENTURES & PARTNERSHIPS
β
List of Figures
FIGURE 1 MARKET SYNOPSIS
FIGURE 2 GLOBAL SPACE LAUNCH SERVICES MARKET: MARKET ATTRACTIVENESS ANALYSIS
FIGURE 3 GLOBAL SPACE LAUNCH SERVICES MARKET ANALYSIS, BY SERVICE TYPE
FIGURE 4 GLOBAL SPACE LAUNCH SERVICES MARKET ANALYSIS, BY ORBIT
FIGURE 5 GLOBAL SPACE LAUNCH SERVICES MARKET ANALYSIS, BY SIZE
FIGURE 5 GLOBAL SPACE LAUNCH SERVICES MARKET ANALYSIS, BY END USE
FIGURE 6 GLOBAL SPACE LAUNCH SERVICES MARKET ANALYSIS, BY REGION
FIGURE 7 GLOBAL SPACE LAUNCH SERVICES MARKET: MARKET STRUCTURE
FIGURE 8 RESEARCH PROCESS OF MRFR
FIGURE 10 NORTH AMERICA: MARKET SIZE & MARKET SHARE, BY COUNTRY, 2020 VS 2027
FIGURE 11 EUROPE: MARKET SIZE & MARKET SHARE, BY COUNTRY, 2020 VS 2027
FIGURE 12 ASIA-PACIFIC: MARKET SIZE & MARKET SHARE, BY COUNTRY, 2020 VS 2027
FIGURE 13 MIDDLE EAST & AFRICA: MARKET SIZE & MARKET SHARE, BY COUNTRY, 2020 VS 2027
FIGURE 14 LATIN AMERICA: MARKET SIZE & MARKET SHARE, BY COUNTRY, 2020 VS 2027
FIGURE 15 MARKET DYNAMICS OVERVIEW
FIGURE 16 DRIVERS IMPACT ANALYSIS: GLOBAL SPACE LAUNCH SERVICES MARKET
FIGURE 17 RESTRAINTS IMPACT ANALYSIS: GLOBAL SPACE LAUNCH SERVICES MARKET
FIGURE 18 PORTERβS FIVE FORCES ANALYSIS OF THE GLOBAL SPACE LAUNCH SERVICES MARKET
FIGURE 19 SUPPLY CHAIN: GLOBAL SPACE LAUNCH SERVICES MARKET
FIGURE 20 GLOBAL SPACE LAUNCH SERVICES MARKET SHARE, BY SERVICE TYPE, 2020 (% SHARE)
FIGURE 21 GLOBAL SPACE LAUNCH SERVICES MARKET SHARE, BY ORBIT, 2020 (% SHARE)
FIGURE 22 GLOBAL SPACE LAUNCH SERVICES MARKET SHARE, BY SIZE, 2020 (% SHARE)
FIGURE 23 GLOBAL SPACE LAUNCH SERVICES MARKET SHARE, BY END USE, 2020 (% SHARE)
FIGURE 24 GLOBAL SPACE LAUNCH SERVICES MARKET SHARE, BY REGION, 2020 (% SHARE)
FIGURE 25 NORTH AMERICA: SPACE LAUNCH SERVICES MARKET SHARE, BY COUNTRY, 2020 (% SHARE)
FIGURE 26 EUROPE: SPACE LAUNCH SERVICES MARKET SHARE, BY COUNTRY, 2020 (% SHARE)
FIGURE 27 ASIA-PACIFIC: SPACE LAUNCH SERVICES MARKET SHARE, BY COUNTRY, 2020 (% SHARE)
FIGURE 28 MIDDLE EAST & AFRICA: SPACE LAUNCH SERVICES MARKET SHARE, BY COUNTRY, 2020 (% SHARE)
FIGURE 29 LATIN AMERICA: SPACE LAUNCH SERVICES MARKET SHARE, BY COUNTRY, 2020 (% SHARE)
FIGURE 30 COMPETITOR DASHBOARD: GLOBAL SPACE LAUNCH SERVICES MARKET
FIGURE 31 CAPITAL MARKET RATIO AND FINANCIAL MATRIX
FIGURE 32 CONTRACTS & AGREEMENTS: THE MAJOR STRATEGY ADOPTED BY KEY PLAYERS IN THE GLOBAL SPACE LAUNCH SERVICES MARKET
FIGURE 33 BENCHMARKING OF MAJOR COMPETITORS
FIGURE 34 MAJOR MANUFACTURERS MARKET SHARE ANALYSIS, 2020
$44,243.66 Million
13.43%
North America
2020-2030
Space Launch Services Market Overview
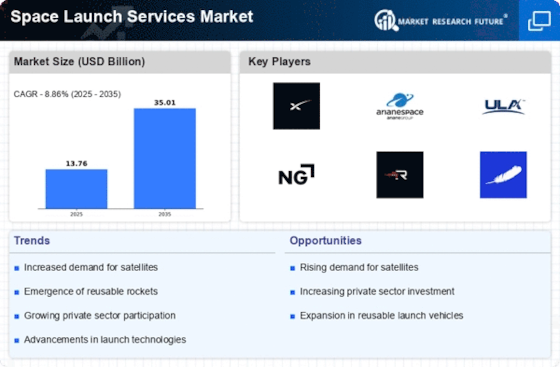
According to the market report, the worldwide Space Launch Services Market Size is projected to reach 44,243.66 Million by 2030, developing at a CAGR of 13.43% from 2020 to 2030.
Space Launch Services Market is related to the exercises done by space launch specialist co-ops. These are activities associated with space satellites that involve seamless integration of all components and services to ensure a smooth launch phase. This market comprises different occasions like requesting, development, transformation, stacking, incorporation of payload, and launch. The passage of private launch specialist organizations has brought about a decline in the dispatch cost and presentation of innovations, consequently denoting another stage on the lookout. The extensive investments in these programs are consequential to the rising space research activities across the world. The expansion in several satellite and testing test launches are drivers for the Space Launch Services Market development in the forecasted period. Likewise, the expanded government speculations and private assets additionally sway the market development altogether.
Notwithstanding, high introductory expenses related to the launch services consider as Space Launch Services Market restraints that hamper the market growth. Likewise, the interoperability issues looked at by organizations debilitates the market development. The absence of a talented labor force and protection from versatility toward new advances is another factor that hampers the Space Launch Services Market share. In the interim, endeavors to lessen the cost of dispatch administrations offer a rewarding chance for the market players working in the Space Launch Services industry.
The Space Launch Services Market examination is finished by considering every one of the driving components liable for the space dispatch administrations market development universally. Likewise, the Space Launch Services Market development is expected to grow at a high rate from 2020-2025.
The Global Space Launch Services Market has seen high development lately, inferable from an expansion in the sending of little satellites and a rising number of room investigation missions by private firms. Also, the improvement of satellites for everyday interchanges, public protection, horticultural observing, and climate checking is driving the development of the Space Launch Services Market. Nonetheless, the expanding volume of room flotsam and jetsam and rigid guidelines for satellite dispatching is used to hamper market development.
COVID-19 Analysis
The new COVID-19 outbreak hugely affected the economic condition across the globe. Due to the quick spread of the infection, a few nations are hoping to carry out severe measures with the end goal of controlling the spread of the illness. The severe measures executed to control the spread of the infections have restricted organizations working in the Space Launch Services programs worldwide. Because of postponements in proposed satellite projects, the pandemic unfavorably affects makers working in this Space Launch Services Market. The endeavors are taken to recuperate financial misfortunes by the organizations. Yet, government associations worldwide will look good for developing the Space Launch Services Marketin the future period.
Market Dynamics
Expansion in the arrangement of little satellites is considered the major driver is driving the growth of the Space Launch Services Market. Small satellites are utilized for different military and business applications like surveillance and interchanges. The recent development and organization of these satellites have expanded radically over the last couple of years because of the rising utilization of satellites for reconnaissance and interchanges by business and military end-clients. This is relied upon to drive the interest for Space Launch Services for the estimated time frame. Huge scale investment by private firms in space investigation missions is also likely to drive the development of the Space Launch Services Market.
The pre-launch services portion represented the bigger portion in the Space Launch Services Market. The pre-launch services are provided the market key players with better opportunities to grow. The high development can be credited to the expanding interest for pre-launch services, for example, dispatch procurement and coordination, reconciliation and coordination, the executive's administrations, and following and telemetry support. By using effective opportunities, the market can grow to a large extent in the future period.
The expanding volume of space garbage and rigid government guidelines is considered the major restraints in the Space Launch Services Market. The government has instated many rules and guidelines, making it difficult for the market to grow. There is also a rise in space debris due to satellites' launches, polluting the space environment to a great extent. These restraints are hampering the market development in the forecasted period. The market must ensure to take effective steps in preventing these restraints from effective the growth and development of the Space Launch Services Market.
Space Launch Services are a progression of space satellites that incorporate a consistent mix, everything being equal, and administrations to guarantee a smooth launch stage. The huge interests in these projects are effective to the rising space research exercises across the world. The expanding utilization of mechanically progressed ideas in these projects has been colossally valuable for the enormous scope of organizations, yet in addition for new companies hoping to fit in a generally aggressive space. The rising government spending allotments for space projects will make a monstrous development stage for the organizations working on the lookout. Combining ideas, such as computerized reasoning and 3D demonstrating for satellite plans, will help develop the Space Launch Services Market in the coming years.
Market segmentation
Based on the payload, the satellite portion of the Space Launch Services Market is projected to develop at the most effective CAGR during the estimated time frame. The expanding interest in Earth perception and correspondence satellites is projected to drive the development of the satellite portion. These satellites are expected to check the Earth's surface to acquire important data for planning, mineral investigation, land-use arranging, and asset the board, among different exercises.
Based on Orbit, the LEO section is relied upon to lead the Space Launch Services Market from 2020 to 2025. Most space-related missions are focused on at Low Earth Orbit (LEO). The organization of little satellites in space and expansion in the number of spaceflights to convey freight to the International Space Station (ISS) are key components adding to the development of the LEO section of the Space Launch Services market.
Based on the launch platform, the land portion is projected to lead the Space Launch Services Market during the conjecture time frame, attributable to an increment in the number of satellite dispatches from ground-based destinations. The land stage is practical and innovatively overhauled when contrasted with different stages.
Regional analysis
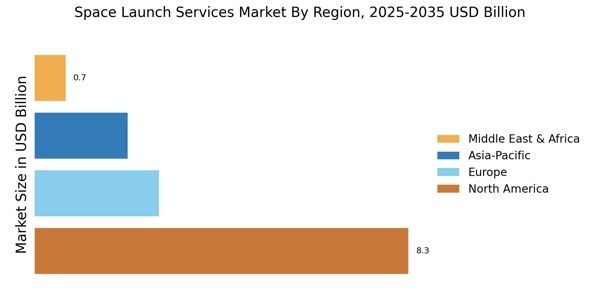
According to the regional analysis report, North America overwhelmed the Space Launch Services Market in 2020 and is projected to stay the biggest territorial market during the figure time frame because of the great speculations by space offices and private firms in improving advanced satellites. Europe is relied upon to be the second-biggest region in the Space Launch Services Market. This can be ascribed to space investigation exercises in Russia, Germany, the UK, and France. Also, major LSPs Arianespace, Eurockot Launch Services, and ISC Kosmotras are driving business sector development in the region.
Key Market Players
Major players of the Space Launch Services Market are mentioned below:
Recent development
Report Overview
Market overview highlights the global recognition of Space Launch Services Market Analysis overview
Report Attribute/Metric | Details |
---|---|
Market Size | USD 44,243.66 Million (2030) |
CAGR | 13.43% (2030) |
Base Year | 2019 |
Forecast Period | 2030 |
Historical Data | 2018 |
Forecast Units | Value (USD Million) |
Report Coverage | Revenue Forecast, Competitive Landscape, Growth Factors, and Trends |
Segments Covered | Service Type, End-Use |
Geographies Covered | North America, Europe, Asia-Pacific, and Rest of the World (RoW) |
Key Vendors | Antrix Corporation Limited (India), Arianespace (France), China Great Wall Industry Corporation (China), Eurockot Launch Services (Germany), International Launch Services Inc. (US), Isc Kosmotras (Russia), Mitsubishi Heavy Industries (Japan), Orbital ATK (US), SpaceX (US), US Spaceflight Industries, Inc. (US) |
Key Market Opportunities | Frequent satellite launches |
Key Market Drivers |
|
Frequently Asked Questions (FAQ) :
space launch services market is expected to scale at a rate of 13.43% in the near future.
space launch services market size by 2030 can be USD 44,243.66 Million.
Space Launch Services Market can witness growth in the coming years on account of the increasing use of small satellites coupled with the surge in space exploration missions carried out by private companies. Also, the advancements in satellites for national defense, day-to-day communications, weather and agricultural monitoring can also benefit the global market.
The key growth deterrent in the global market can be the rising volume of space debris.
The high spending by private firms and space agencies on development of top quality satellites make North America the leading market.