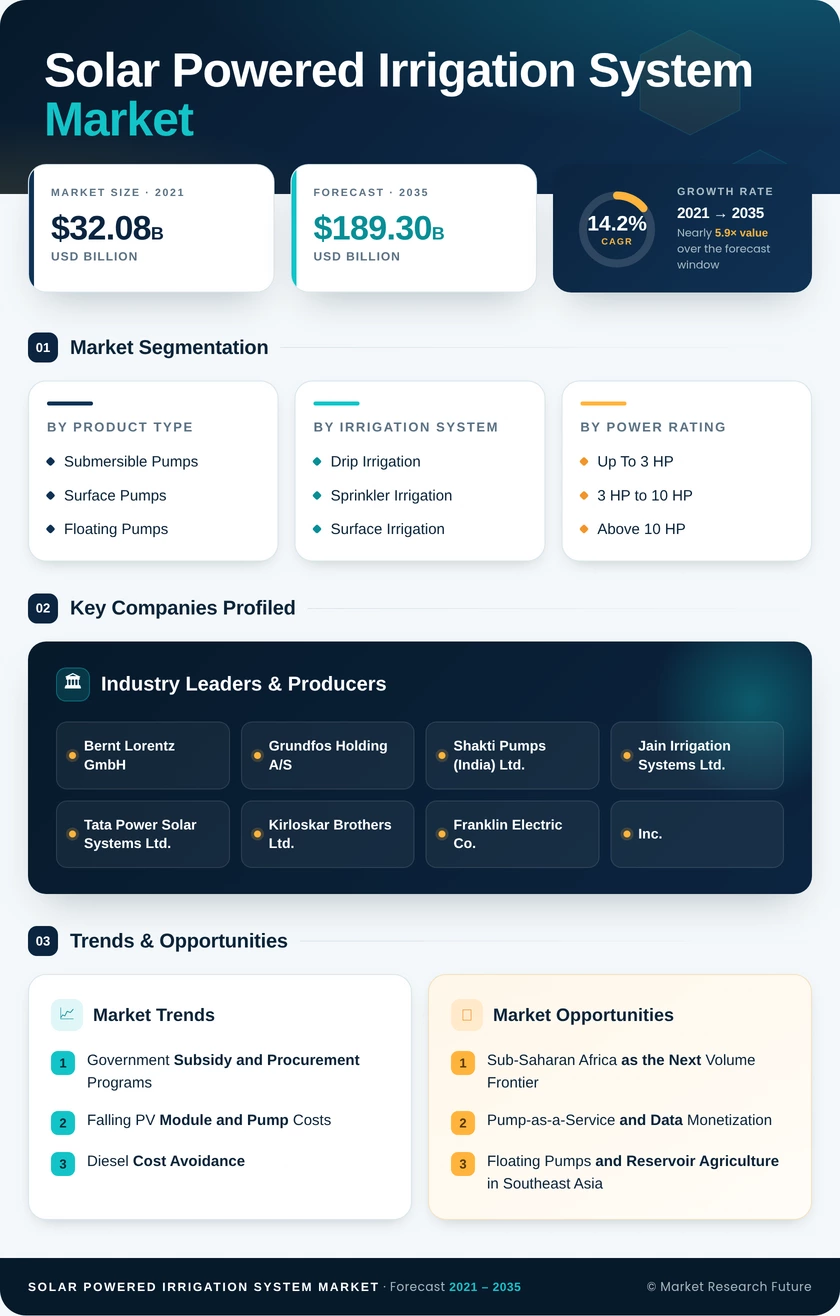
Solar Powered Irrigation System Market (2026 - 2035)

ID: MRFR/EnP/9869-HCR 128 Pages Garvit Vyas Last Updated: October 14, 2026
Solar Powered Irrigation System Market Research Report By Product Type (Submersible Pumps, Surface Pumps, Floating Pumps), By Irrigation System (Drip Irrigation, Sprinkler Irrigation, Surface Irrigation, Center Pivot and Lateral-Move), By Power Rating (Up To 3 HP, 3.1 HP to 10 HP, Above 10 HP), By Component (Solar Panels, Pumps, Controllers, Inverters, Others), By End-User (Smallholder Farms, Commercial Farms, Agricultural Cooperatives, Greenhouses, Livestock Watering) - Forecast to 2035
Solar Powered Irrigation System Market
Market Size
Forecast Period2026-2035
CAGR (2026-2035)14.2%
2025 Market SizeUSD 50.60 Billion
2035 Market SizeUSD 189.30 Billion
Key Players
Bernt Lorentz GmbH
Grundfos Holding A/S
Shakti Pumps Ltd.
Jain Irrigation Systems Ltd.
Tata Power Solar Systems Ltd.
Kirloskar Brothers Ltd.
Opportunities
  • Sub-Saharan Africa as the Next Volume Frontier
  • Pump-as-a-Service and Data Monetization
  • Floating Pumps and Reservoir Agriculture in Southeast Asia
  1. 1 Market Summary | |
  2. 2 Key Report Takeaways | |
    1. 2.1 By Product Type | |
    2. 2.2 By Irrigation System | |
    3. 2.3 By Power Rating | |
    4. 2.4 By Component | |
    5. 2.5 By End-User | |
    6. 2.6 By Region | |
  3. 3 Market Size and Forecast (2021–2035) | |
  4. 4 Driver Impact Analysis | |
    1. 4.1 Government Subsidy and Procurement Programs | |
    2. 4.2 Falling PV Module and Pump Costs | |
    3. 4.3 Diesel Cost Avoidance | |
    4. 4.4 Water Scarcity and Efficiency Mandates | |
    5. 4.5 Pay-as-You-Go and Off-Grid Financing | |
    6. 4.6 Agricultural Decarbonization Commitments | |
    7. 4.7 Smart Controllers and Remote Monitoring | |
  5. 5 Restraints Impact Analysis | |
    1. 5.1 High Upfront Capital Cost | |
    2. 5.2 Groundwater Over-Extraction Risk | |
    3. 5.3 Limited After-Sales and Technical Service | |
    4. 5.4 Seasonal Irradiance Limits at Higher Latitudes | |
    5. 5.5 Theft and Vandalism of Solar Panels | |
  6. 6 Opportunities | |
    1. 6.1 Sub-Saharan Africa as the Next Volume Frontier | |
    2. 6.2 Pump-as-a-Service and Data Monetization | |
    3. 6.3 Floating Pumps and Reservoir Agriculture in Southeast Asia | |
    4. 6.4 Grid-Connected Feeder Solarization | |
    5. 6.5 Diesel Fleet Retrofits in South America and the Middle East | |
  7. 7 Regional Market Share and Country-Level Analysis | |
    1. 7.1 North America | | |
      1. 7.1.1 United States | | |
      2. 7.1.2 Canada | | |
      3. 7.1.3 Mexico | |
    2. 7.2 Europe | | |
      1. 7.2.1 Germany | | |
      2. 7.2.2 United Kingdom | | |
      3. 7.2.3 France | | |
      4. 7.2.4 Italy | | |
      5. 7.2.5 Spain | | |
      6. 7.2.6 Nordic Countries | | |
      7. 7.2.7 Russia | | |
      8. 7.2.8 Rest of Europe | |
    3. 7.3 Asia-Pacific | | |
      1. 7.3.1 China | | |
      2. 7.3.2 India | | |
      3. 7.3.3 Japan | | |
      4. 7.3.4 South Korea | | |
      5. 7.3.5 ASEAN | | |
      6. 7.3.6 Rest of Asia-Pacific | |
    4. 7.4 South America | | |
      1. 7.4.1 Brazil | | |
      2. 7.4.2 Argentina | | |
      3. 7.4.3 Rest of South America | |
    5. 7.5 Middle East & Africa | | |
      1. 7.5.1 Saudi Arabia | | |
      2. 7.5.2 UAE | | |
      3. 7.5.3 South Africa | | |
      4. 7.5.4 Egypt | | |
      5. 7.5.5 Rest of Middle East & Africa | |
  8. 8 Future Outlook (2026–2035) | |
    1. 8.1 Intelligent Controllers Redefine System Value | |
    2. 8.2 Carbon and Blended Finance Scale Affordability | |
    3. 8.3 Groundwater Governance Shapes Design | |
    4. 8.4 Supply Chain Localization | |
  9. 9 Segmentation Analysis | |
    1. 9.1 By Product Type | | |
      1. 9.1.1 Submersible Pumps | | |
      2. 9.1.2 Surface Pumps | | |
      3. 9.1.3 Floating Pumps | |
    2. 9.2 By Irrigation System | | |
      1. 9.2.1 Drip Irrigation | | |
      2. 9.2.2 Sprinkler Irrigation | | |
      3. 9.2.3 Surface Irrigation | | |
      4. 9.2.4 Center Pivot and Lateral-Move | |
    3. 9.3 By Power Rating | | |
      1. 9.3.1 Up To 3 HP | | |
    4. 3.1 HP to 10 HP | | |
      1. 9.3.2 Above 10 HP | |
    5. 9.4 By Component | | |
      1. 9.4.1 Solar Panels | | |
      2. 9.4.2 Pumps | | |
      3. 9.4.3 Controllers | | |
      4. 9.4.4 Inverters | | |
      5. 9.4.5 Others | |
    6. 9.5 By End-User | | |
      1. 9.5.1 Smallholder Farms | | |
      2. 9.5.2 Commercial Farms | | |
      3. 9.5.3 Agricultural Cooperatives | | |
      4. 9.5.4 Greenhouses | | |
      5. 9.5.5 Livestock Watering | |
  10. 10 Competitive Landscape | |
  11. 11 Recent News & Developments | |
  12. 12 Report Scope and Methodology | |
  13. 13 Detailed Sources and Citations | |
  14. 14 Frequently Asked Questions (FAQs) | | LIST OF TABLES | |
  15. TABLE 1 Market Snapshot, 2025 and 2035 | |
  16. TABLE 2 Global Market Size & Forecast, by Revenue (USD Billion), 2021–2035 | |
  17. TABLE 3 Driver Impact Analysis | |
  18. TABLE 4 Restraints Impact Analysis | |
  19. TABLE 5 Regional Summary, 2025 | |
  20. TABLE 6 North America Market, by Country, 2025 | |
  21. TABLE 7 Europe Market, by Country, 2025 | |
  22. TABLE 8 Asia-Pacific Market, by Country, 2025 | |
  23. TABLE 9 South America Market, by Country, 2025 | |
  24. TABLE 10 Middle East & Africa Market, by Country, 2025 | |
  25. TABLE 11 Global Market, by Product Type, 2025 | |
  26. TABLE 12 Global Market, by Irrigation System, 2025 | |
  27. TABLE 13 Global Market, by Power Rating, 2025 | |
  28. TABLE 14 Global Market, by Component, 2025 | |
  29. TABLE 15 Global Market, by End-User, 2025 | |
  30. TABLE 16 Competitive Benchmarking Matrix, 2025 | |
  31. TABLE 17 Report Scope and Methodology | |
  32. TABLE 18 Detailed Sources and Citations | | LIST OF FIGURES | |
  33. FIGURE 1 Market Dynamics Overview (Drivers, Restraints, Opportunities) | |
  34. FIGURE 2 Industry Value Chain Analysis | |
  35. FIGURE 3 Porter's Five Forces Analysis | |
  36. FIGURE 4 Global Market Size Trend (USD Billion), 2021–2035 | |
  37. FIGURE 5 Market Share, by Product Type, 2025 | |
  38. FIGURE 6 Market Share, by Irrigation System, 2025 | |
  39. FIGURE 7 Market Share, by Power Rating, 2025 | |
  40. FIGURE 8 Market Share, by Component, 2025 | |
  41. FIGURE 9 Market Share, by End-User, 2025 | |
  42. FIGURE 10 Regional Market Share, 2025 | |
  43. FIGURE 11 Asia-Pacific Country Share, 2025 | |
  44. FIGURE 12 Middle East & Africa Growth Outlook, 2026–2035 | |
  45. FIGURE 13 Competitive Landscape Positioning Matrix | |
  46. FIGURE 14 Estimated Revenue Share Ranges of Key Players, 2025

Segmentation Quick Reference

DimensionSub-SegmentsDominant SegmentFastest Growing Segment
By Product TypeSubmersible Pumps, Surface Pumps, Floating PumpsSubmersible Pumps (50.4% share)Floating Pumps (17.9% CAGR)
By Irrigation SystemDrip Irrigation, Sprinkler Irrigation, Surface IrrigationDrip Irrigation (39.6% share)Drip Irrigation (39.6% share)
By Power RatingUp To 3 HP, 3 HP to 10 HP, Above 10 HPUp To 3 HP (45.2% share)Above 10 HP (18.9% CAGR)
By ComponentSolar Panels, Pumps, Controllers, Inverters, OthersSolar Panels (32.9% share)Controllers (20.0% CAGR)
By End-UserSmallholder Farms, Commercial Farms, Agricultural CooperativesSmallholder Farms (51.7% share)Commercial Farms (16.3% CAGR)
By RegionNorth America, Europe, Asia-Pacific, South America, Middle East & AfricaAsia-Pacific (46.2% share)Middle East & Africa (17.4% CAGR)

Market Segmentation Overview

By Product Type

Sub-SegmentKey Trend
Submersible PumpsRising borewell depths drive demand for higher-head models
Surface PumpsLow-cost lifting from rivers, canals, and shallow wells
Floating PumpsAdoption in reservoirs, ponds, and aquaculture zones

Submersible Pumps lead because falling water tables in South Asia and East Africa push farmers toward deep-well lifting that surface units cannot handle. Floating Pumps grow fastest, driven by Southeast Asian reservoir farming where land is scarce and evaporation control adds value. Surface Pumps hold steady where water sources remain shallow and budgets are tight.

By Irrigation System

Sub-SegmentKey Trend
Drip IrrigationSubsidy-linked micro-irrigation and low-pressure solar pairing
Sprinkler IrrigationField crops and pasture coverage in temperate regions
Surface IrrigationGradual decline under water-efficiency regulation

Drip Irrigation both leads and grows fastest because its low operating pressure lets small arrays deliver adequate flow, and governments increasingly require micro-irrigation for pump subsidies. Sprinkler Irrigation serves grain and fodder producers in Europe and South America. Surface Irrigation loses ground as water regulators discourage flood methods.

By Power Rating

Sub-SegmentKey Trend
Up To 3 HPSubsidy caps and smallholder affordability
3 HP to 10 HPShared wells and mid-sized farm adoption
Above 10 HPCommercial agribusiness diesel replacement

Up To 3 HP systems lead because most subsidy schemes cap support at these ratings and smallholders dominate installed volumes. Above 10 HP systems grow fastest as commercial farms in Brazil, Saudi Arabia, and India replace diesel fleets with high-capacity solar drives. The 3 HP to 10 HP band bridges cooperatives and mid-sized growers.

By Component

Sub-SegmentKey Trend
Solar PanelsFalling module prices and higher-efficiency cells
PumpsBrushless DC motors gaining share at small capacities
ControllersTelemetry, irradiance tracking, and soil-sensor integration
InvertersAC pump retrofits on converted diesel farms
OthersAnti-theft mounts, cabling, and storage tanks

Solar Panels lead component revenue as the largest bill-of-materials item, even after steep module price declines. Controllers grow fastest because buyers now expect remote diagnostics and automatic speed matching to irradiance. Pumps and Inverters remain essential, with inverter demand tied closely to AC retrofit projects.

By End-User

Sub-SegmentKey Trend
Smallholder FarmsSubsidy programs and PAYG repayment plans
Commercial FarmsHigh-capacity systems and diesel fleet conversion
Agricultural CooperativesGroup procurement and shared well infrastructure

Smallholder Farms lead thanks to India's subsidy pipelines and PAYG models across Africa that spread costs over two to three years. Commercial Farms grow fastest as agribusiness operators convert diesel fleets and invest in advanced controllers. Agricultural Cooperatives gain traction where pooled capital makes larger shared wells viable.


Download PDF ×

We do not share your information with anyone. However, we may send you emails based on your report interest from time to time. You may contact us at any time to opt-out.