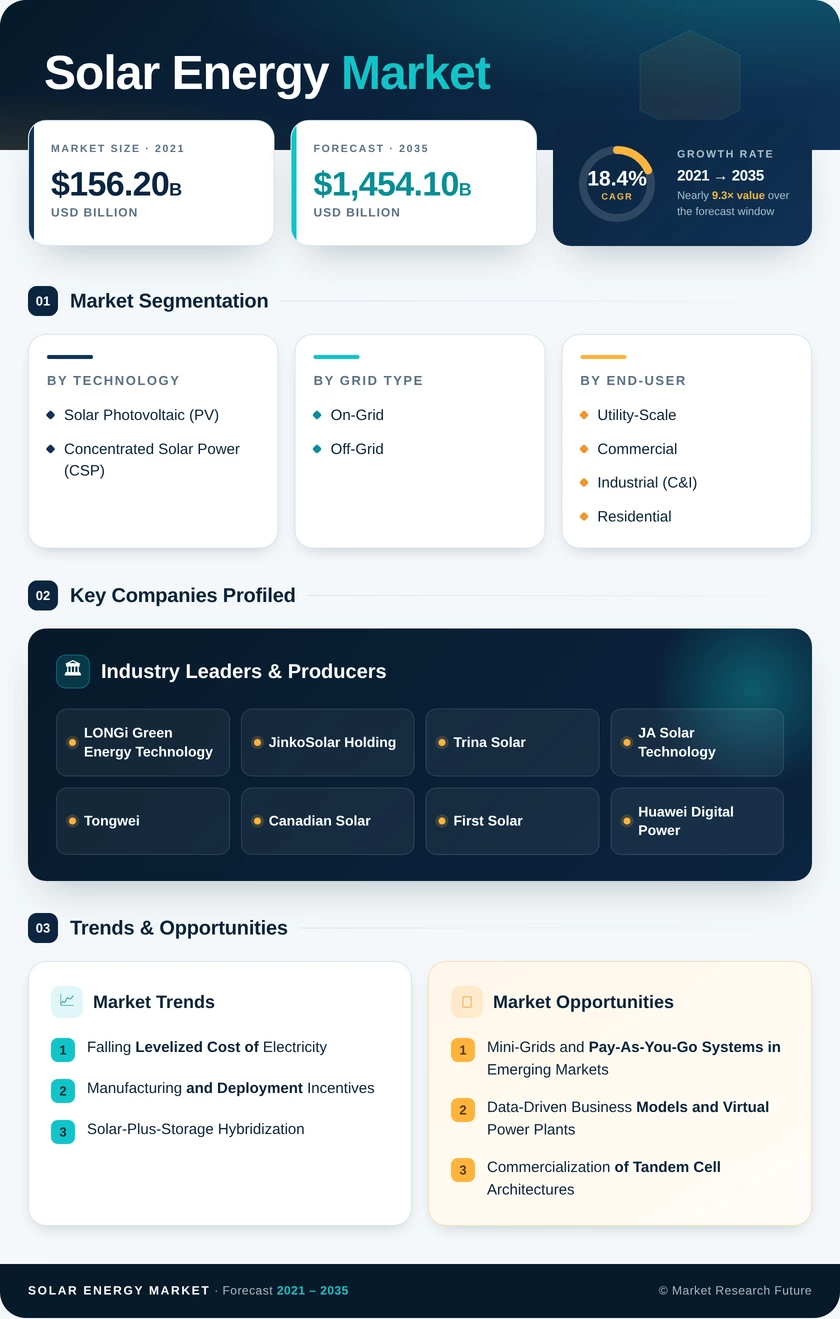
Solar Energy Market (2026 - 2035)

ID: MRFR/EnP/9431-HCR 100 Pages Garvit Vyas Last Updated: October 22, 2026
Solar Energy Market Research Report By Technology (Solar Photovoltaic (PV), Concentrated Solar Power (CSP)), By Grid Type (On-Grid, Off-Grid), By End-User (Utility-Scale, Commercial and Industrial (C&I), Residential), By Component (Qualitative Analysis) (Solar Modules/Panels, Inverters (String, Central, Micro), Mounting and Tracking Systems, Balance-of-System and Electricals, Energy Storage and Hybrid Integration) and By Region - Industry Forecast to 2035
Solar Energy Market
Market Size
Forecast Period2026-2035
CAGR (2026-2035)18.4%
2025 Market SizeUSD 268.5 Billion
2035 Market SizeUSD 1,454.1 Billion
Key Players
LONGi Green Energy Technology
JinkoSolar Holding
Trina Solar
JA Solar Technology
Tongwei
Canadian Solar
Opportunities
  • Mini-Grids and Pay-As-You-Go Systems in Emerging Markets
  • Data-Driven Business Models and Virtual Power Plants
  • Commercialization of Tandem Cell Architectures
  1. 1 Market Summary | |
  2. 2 Key Report Takeaways | |
    1. 2.1 By Technology | |
    2. 2.2 By Grid Type | |
    3. 2.3 By End-User | |
    4. 2.4 By Component (Qualitative Analysis) | |
    5. 2.5 By Region | |
  3. 3 Market Size and Forecast (2021–2035) | |
    1. 3.1 Historical Market Size (2021–2024) | |
    2. 3.2 Base Year Market Size (2025) | |
    3. 3.3 Forecast Market Size (2026–2035) | |
    4. 3.4 Industry Value Chain Analysis | |
    5. 3.5 Porter's Five Forces Analysis | |
  4. 4 Driver Impact Analysis | |
    1. 4.1 Falling Levelized Cost of Electricity | |
    2. 4.2 Manufacturing and Deployment Incentives | |
    3. 4.3 Solar-Plus-Storage Hybridization | |
    4. 4.4 Rising Electricity Demand and Electrification | |
    5. 4.5 Corporate Procurement and PPAs | |
    6. 4.6 Gulf Gigaproject Procurement | |
    7. 4.7 Energy Access Programs in Emerging Economies | |
  5. 5 Restraints Impact Analysis | |
    1. 5.1 Grid Interconnection Backlogs | |
    2. 5.2 Trade Barriers and Tariff Uncertainty | |
    3. 5.3 Curtailment and Negative Pricing | |
    4. 5.4 Manufacturing Overcapacity and Price Volatility | |
    5. 5.5 Land Use and Permitting Constraints | |
  6. 6 Opportunities | |
    1. 6.1 Mini-Grids and Pay-As-You-Go Systems in Emerging Markets | |
    2. 6.2 Data-Driven Business Models and Virtual Power Plants | |
    3. 6.3 Commercialization of Tandem Cell Architectures | |
    4. 6.4 Solar-Powered Green Hydrogen in the Gulf | |
    5. 6.5 Agrivoltaics and Floating Installations | |
  7. 7 Regional Market Share and Country-Level Analysis | |
    1. 7.1 North America | | |
      1. 7.1.1 United States | | |
      2. 7.1.2 Canada | | |
      3. 7.1.3 Mexico | |
    2. 7.2 Europe | | |
      1. 7.2.1 United Kingdom | | |
      2. 7.2.2 Germany | | |
      3. 7.2.3 France | | |
      4. 7.2.4 Spain | | |
      5. 7.2.5 Nordic Countries | | |
      6. 7.2.6 Russia | | |
      7. 7.2.7 Rest of Europe | |
    3. 7.3 Asia-Pacific | | |
      1. 7.3.1 China | | |
      2. 7.3.2 India | | |
      3. 7.3.3 Japan | | |
      4. 7.3.4 South Korea | | |
      5. 7.3.5 Malaysia | | |
      6. 7.3.6 Thailand | | |
      7. 7.3.7 Indonesia | | |
      8. 7.3.8 Vietnam | | |
      9. 7.3.9 Australia | | |
      10. 7.3.10 Rest of Asia-Pacific | |
    4. 7.4 South America | | |
      1. 7.4.1 Brazil | | |
      2. 7.4.2 Argentina | | |
      3. 7.4.3 Colombia | | |
      4. 7.4.4 Rest of South America | |
    5. 7.5 Middle East and Africa | | |
      1. 7.5.1 Saudi Arabia | | |
      2. 7.5.2 United Arab Emirates | | |
      3. 7.5.3 South Africa | | |
      4. 7.5.4 Egypt | | |
      5. 7.5.5 Rest of Middle East and Africa | |
  8. 8 Future Outlook (2026–2035) | |
    1. 8.1 AI-Enabled Operations and Forecasting | |
    2. 8.2 Storage-Firmed Solar as Default Capacity | |
    3. 8.3 Realignment of Manufacturing Geography | |
    4. 8.4 Lifecycle Accountability and Circularity | |
  9. 9 Segmentation Analysis | |
    1. 9.1 By Technology | | |
      1. 9.1.1 Solar Photovoltaic (PV) | | |
      2. 9.1.2 Concentrated Solar Power (CSP) | |
    2. 9.2 By Grid Type | | |
      1. 9.2.1 On-Grid | | |
      2. 9.2.2 Off-Grid | |
    3. 9.3 By End-User | | |
      1. 9.3.1 Utility-Scale | | |
      2. 9.3.2 Commercial and Industrial (C&I) | | |
      3. 9.3.3 Residential | |
    4. 9.4 By Component (Qualitative Analysis) | | |
      1. 9.4.1 Solar Modules/Panels | | |
      2. 9.4.2 Inverters (String, Central, Micro) | | |
      3. 9.4.3 Mounting and Tracking Systems | | |
      4. 9.4.4 Balance-of-System and Electricals | | |
      5. 9.4.5 Energy Storage and Hybrid Integration | |
  10. 10 Competitive Landscape | |
    1. 10.1 Market Concentration Analysis | |
    2. 10.2 Competitive Benchmarking Matrix | |
    3. 10.3 Company Profiles | | |
      1. 10.3.1 LONGi Green Energy Technology | | |
      2. 10.3.2 JinkoSolar Holding | | |
      3. 10.3.3 Trina Solar | | |
      4. 10.3.4 JA Solar Technology | | |
      5. 10.3.5 Tongwei | | |
      6. 10.3.6 Canadian Solar | | |
      7. 10.3.7 First Solar | | |
      8. 10.3.8 Huawei Digital Power | | |
      9. 10.3.9 Sungrow Power Supply | | |
      10. 10.3.10 Enphase Energy | | |
      11. 10.3.11 SMA Solar Technology | | |
      12. 10.3.12 Nextracker | |
  11. 11 Recent News & Developments | |
  12. 12 Report Scope and Methodology | |
  13. 13 Detailed Sources and Citations | |
  14. 14 Frequently Asked Questions (FAQs) | | LIST OF TABLES | |
  15. TABLE 1 Global Solar Energy Revenue Summary, 2025 and 2035 (USD Billion) | |
  16. TABLE 2 Global Solar Energy Revenue & Forecast, 2021–2035 (USD Billion) | |
  17. TABLE 3 Driver Impact Analysis, 2026–2035 | |
  18. TABLE 4 Restraints Impact Analysis, 2026–2035 | |
  19. TABLE 5 Global Solar Energy Revenue, by Region, 2025 | |
  20. TABLE 6 North America Solar Energy Revenue, by Country, 2025 | |
  21. TABLE 7 Europe Solar Energy Revenue, by Country, 2025 | |
  22. TABLE 8 Asia-Pacific Solar Energy Revenue, by Country, 2025 | |
  23. TABLE 9 South America Solar Energy Revenue, by Country, 2025 | |
  24. TABLE 10 Middle East and Africa Solar Energy Revenue, by Country, 2025 | |
  25. TABLE 11 Global Solar Energy Revenue, by Technology, 2021–2035 (USD Billion) | |
  26. TABLE 12 Global Solar Energy Revenue, by Grid Type, 2021–2035 (USD Billion) | |
  27. TABLE 13 Global Solar Energy Revenue, by End-User, 2021–2035 (USD Billion) | |
  28. TABLE 14 Global Solar Energy Component Assessment (Qualitative Analysis) | |
  29. TABLE 15 Competitive Benchmarking Matrix, 2025 | |
  30. TABLE 16 Report | | Solar Energy Market — Table of Contents & Market Segmentation | | Executive Summary | |
  31. 1 Market Summary | |
  32. 2 Key Report Takeaways | |
    1. 2.1 By Technology | |
    2. 2.2 By Grid Type | |
    3. 2.3 By End-User | |
    4. 2.4 By Component (Qualitative Analysis) | |
  33. 3 Market Size and Forecast (2021–2035) | |
  34. 4 Driver Impact Analysis | |
  35. 5 Restraints Impact Analysis | |
  36. 6 Opportunities | |
  37. 7 Regional Market Share and Country-Level Analysis | |
    1. 7.1 North America | |
    2. 7.2 Europe | |
    3. 7.3 Asia-Pacific | |
    4. 7.4 South America | |
    5. 7.5 Middle East & Africa | |
  38. 8 Future Outlook (2026–2035) | |
  39. 9 Segmentation Analysis | |
    1. 9.1 By Technology | | |
      1. 9.1.1 Solar Photovoltaic (PV) | | |
      2. 9.1.2 Concentrated Solar Power (CSP) | |
    2. 9.2 By Grid Type | | |
      1. 9.2.1 On-Grid | | |
      2. 9.2.2 Off-Grid | |
    3. 9.3 By End-User | | |
      1. 9.3.1 Utility-Scale | | |
      2. 9.3.2 Commercial and Industrial (C&I) | | |
      3. 9.3.3 Residential | |
    4. 9.4 By Component (Qualitative Analysis) | | |
      1. 9.4.1 Solar Modules/Panels | | |
      2. 9.4.2 Inverters (String, Central, Micro) | | |
      3. 9.4.3 Mounting and Tracking Systems | | |
      4. 9.4.4 Balance-of-System and Electricals | | |
      5. 9.4.5 Energy Storage and Hybrid Integration | |
  40. 10 Competitive Landscape | |
  41. 11 Recent News & Developments | |
  42. 12 Report Scope and Methodology | |
  43. 13 Detailed Sources and Citations | |
  44. 14 Frequently Asked Questions | | LIST OF TABLES | |
  45. TABLE 1 Solar Energy Market Summary Table | |
  46. TABLE 2 Solar Energy Market Market Size and Forecast, 2021–2035 | |
  47. TABLE 3 Driver Impact Analysis | |
  48. TABLE 4 Restraints Impact Analysis | |
  49. TABLE 5 Regional Market Share Summary | |
  50. TABLE 6 North America Country-Level Analysis | |
  51. TABLE 7 Europe Country-Level Analysis | |
  52. TABLE 8 Asia-Pacific Country-Level Analysis | |
  53. TABLE 9 South America Country-Level Analysis | |
  54. TABLE 10 Middle East & Africa Country-Level Analysis | |
  55. TABLE 11 Solar Energy Market Segmentation by By Technology | |
  56. TABLE 12 Solar Energy Market Segmentation by By Grid Type | |
  57. TABLE 13 Solar Energy Market Segmentation by By End-User | |
  58. TABLE 14 Solar Energy Market Segmentation by By Component (Qualitative Analysis) | |
  59. TABLE 15 Competitive Benchmarking Matrix | |
  60. TABLE 16 Report Scope and Methodology | |
  61. TABLE 17 Detailed Sources and Citations | | LIST OF FIGURES | |
  62. FIGURE 1 Solar Energy Market Market Size Trend, 2021–2035 | |
  63. FIGURE 2 Solar Energy Market Year-over-Year Growth Outlook | |
  64. FIGURE 3 Regional Revenue Share Analysis | |
  65. FIGURE 4 Driver and Restraint Impact Matrix | |
  66. FIGURE 5 Competitive Landscape Snapshot | |
  67. FIGURE 6 Segment Share by By Technology | |
  68. FIGURE 7 Segment Share by By Grid Type | |
  69. FIGURE 8 Segment Share by By End-User | |
  70. FIGURE 9 Segment Share by By Component (Qualitative Analysis)

Segmentation Quick Reference

DimensionSub-SegmentsDominant SegmentFastest Growing Segment
By TechnologySolar Photovoltaic (PV), Concentrated Solar Power (CSP)Solar Photovoltaic (PV)Concentrated Solar Power (CSP)
By Grid TypeOn-Grid, Off-GridOn-GridOff-Grid
By End-UserUtility-Scale, Commercial and Industrial (C&I), ResidentialUtility-ScaleCommercial and Industrial (C&I)
By Component (Qualitative Analysis)Solar Modules/Panels, Inverters (String, Central, Micro), Mounting and Tracking Systems, Balance-of-System and Electricals, Energy Storage and Hybrid IntegrationSolar Modules/PanelsInverters (String, Central, Micro)
By RegionNorth America, Europe, Asia-Pacific, South America, Middle East and AfricaAsia-PacificMiddle East and Africa

Market Segmentation Overview

By Technology

Sub-SegmentKey Trend
Solar Photovoltaic (PV)Falling module costs, n-type cell efficiency gains, tracker adoption
Concentrated Solar Power (CSP)Molten-salt storage for overnight dispatch and industrial process heat

Within the Solar Energy Market, Solar Photovoltaic (PV) technology accounts for virtually all new capacity and is set to grow at an 18.6% CAGR through 2035. Mass-produced n-type cells, bifacial modules and single-axis trackers continue to push yields up and costs down. Concentrated Solar Power (CSP), worth USD 2.4 billion in 2025, persists in niches where molten-salt storage delivers overnight dispatch or industrial heat. Battery-backed PV now undercuts it on cost in most high-irradiance regions.

By Grid Type

Sub-SegmentKey Trend
On-GridUtility auctions, rooftop net-billing schemes, corporate PPAs
Off-GridUniversal-access programs, pay-as-you-go financing, mini-grids

On-Grid systems anchor the Solar Energy Market, holding 84.1% of 2025 revenue through utility tenders, rooftop net-billing schemes and corporate PPAs. Off-Grid applications are smaller but grow faster, with a projected 20.6% CAGR. Growth comes from pay-as-you-go home systems, productive-use kits and solar mini-grids that serve households and businesses beyond the transmission network. Bundled lithium-iron-phosphate batteries and mobile-money payments have made off-grid service commercially viable without permanent subsidy.

By End-User

Sub-SegmentKey Trend
Utility-ScaleCompetitive auctions, sub-USD 0.03/kWh tariffs, hybrid tenders
Commercial and Industrial (C&I)Rising industrial tariffs, corporate decarbonization targets
ResidentialBattery bundling, lease and subscription financing, self-consumption rules

Utility-Scale projects are the largest end-user block in the Solar Energy Market at a 49.2% share, supported by competitive auctions that deliver record-low tariffs. Commercial and Industrial (C&I) deployments, valued at USD 76.3 billion in 2025, benefit from rising industrial power tariffs and corporate decarbonization goals. Residential is the fastest-growing end user, with a projected 20.1% CAGR. Solar panel installation increasingly arrives bundled with batteries, heat pumps and EV chargers, financed through leases and subscriptions.

By Component (Qualitative Analysis)

Sub-SegmentKey Trend
Solar Modules/PanelsVolume growth offsets steep price deflation
Inverters (String, Central, Micro)Grid-forming capability, cybersecurity, module-level monitoring
Mounting and Tracking SystemsSingle-axis tracker adoption in utility projects
Balance-of-System and ElectricalsHigher-voltage architectures, interconnection upgrades
Energy Storage and Hybrid IntegrationEvening-peak value, firm-capacity tenders

Component economics in the Solar Energy Market are shifting from modules toward integration. Solar Modules/Panels still carry the largest share of system cost, even after steep price declines. Inverters (String, Central, Micro) are gaining value through grid-forming and cybersecurity features. Single-axis Mounting and Tracking Systems lift yield by 15–25%. Balance-of-System and Electricals take a growing share of capex, while Energy Storage and Hybrid Integration records the fastest-growing attach rate.


Download PDF ×

We do not share your information with anyone. However, we may send you emails based on your report interest from time to time. You may contact us at any time to opt-out.