SEGMENTATION QUICK REFERENCE
| Dimension | Sub-Segments | Dominant Segment | Fastest Growing Segment |
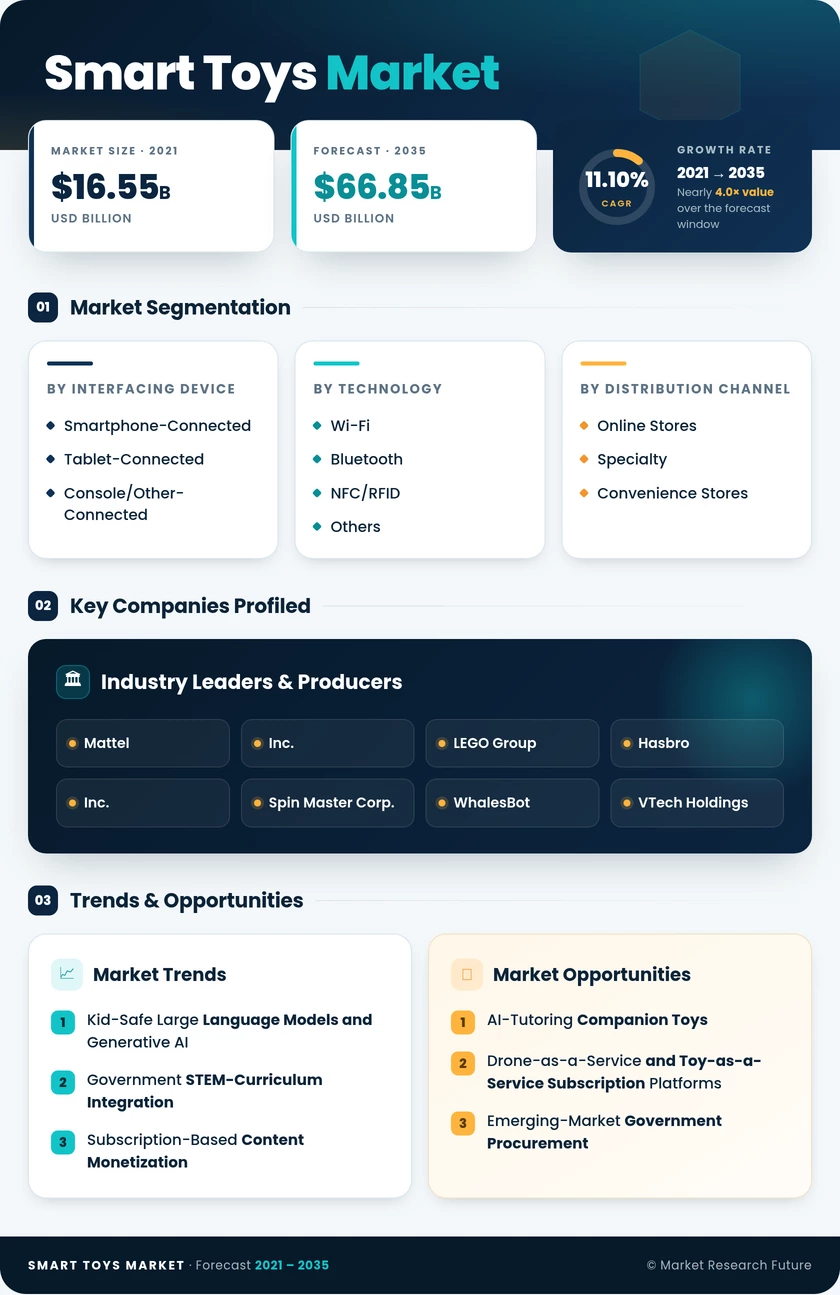
| By Interfacing Device | Smartphone-Connected, Tablet-Connected, Console/Other-Connected | Smartphone-Connected | Console/Other-Connected |
| By Smart Toys Market | Wi-Fi, Bluetooth, NFC/RFID and Others | Wi-Fi | NFC/RFID and Others |
| By Distribution Channel | Online Stores, Specialty and Convenience Stores | Online Stores | Specialty and Convenience Stores |
| By Geography | North America, Europe, Asia-Pacific, South America, Middle East & Africa | North America | Asia-Pacific |
MARKET SEGMENTATION OVERVIEW
By Interfacing Device
| Sub-Segment | Key Trend |
| Smartphone-Connected | Companion-app proliferation and BLE pairing drive mass-market penetration. |
| Tablet-Connected | Classroom tablet deployments create institutional demand for tablet-paired learning toys. |
| Console/Other-Connected | AR-peripheral toy attachments for gaming consoles emerge as a premium hybrid category. |
Smartphone-connected toys remain the volume leader because they leverage hardware parents already own. Console-connected toys represent the growth frontier, merging gaming console processing power with physical play to create a differentiated entertainment experience.
By Smart Toys Market
| Sub-Segment | Key Trend |
| Wi-Fi | Always-on cloud connectivity enables OTA content updates and real-time AI processing. |
| Bluetooth | Low-power, low-cost standard ideal for battery-constrained, proximity-based play |
| NFC/RFID and Others | Tap-and-play collectible mechanics bridge physical figurines with digital content worlds. |
Wi-Fi technology underpins the most feature-rich smart toys, while NFC/RFID is expanding rapidly as manufacturers adopt tap-to-unlock play mechanics originally popularized in the toys-to-life genre.
By Distribution Channel
| Sub-Segment | Key Trend |
| Online Stores | D2C and marketplace channels dominate through targeted digital marketing and review ecosystems |
| Specialty and Convenience Stores | Experiential retail formats (in-store demo zones, coding workshops) lift conversion rates. |
Online channels command the majority of sales, but specialty retailers are recapturing share by offering hands-on trial experiences that reduce purchase-decision anxiety for premium-priced connected toys.