Information and Communications Smart Glass Market Segmentation
Information and Communications Smart Glass Market By Smart Glass Market (USD Billion, 2025-2035)
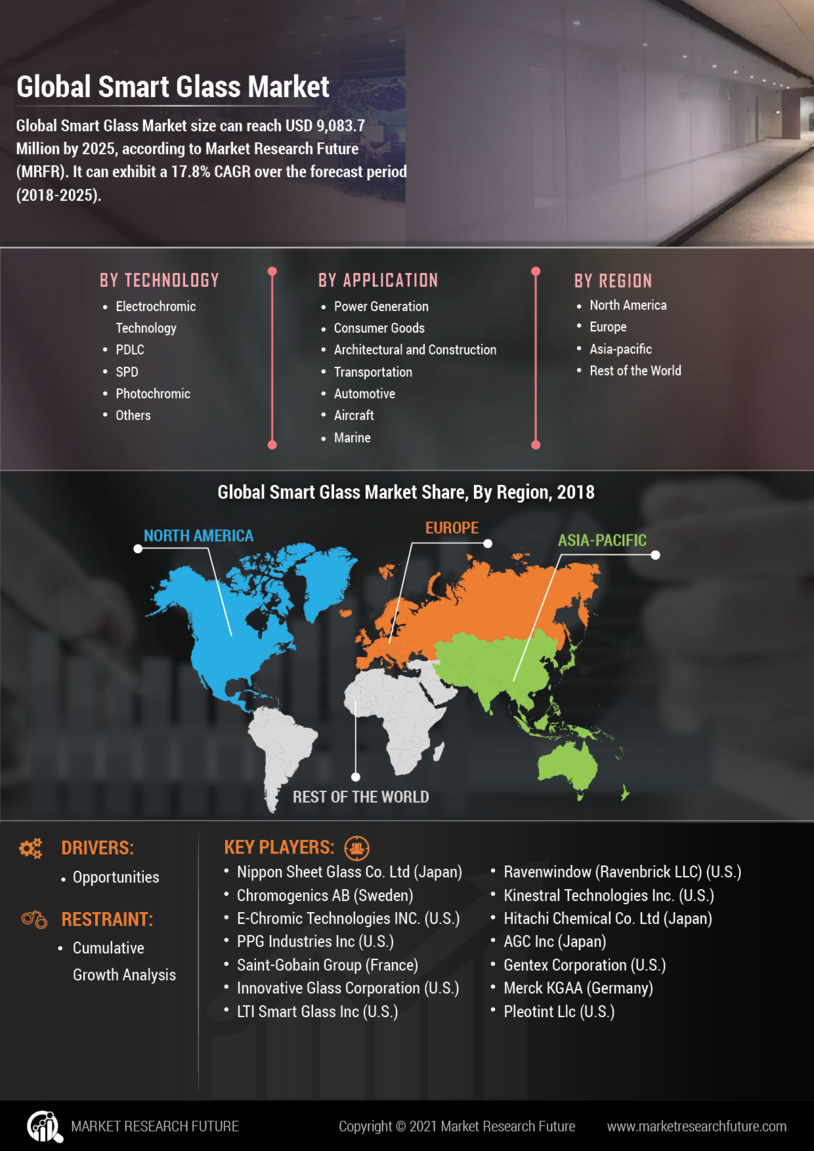
- Electrochromic Smart Glass Market
- PDLC
- SPD
- Photochromic Smart Glass Market
Information and Communications Smart Glass Market By Application (USD Billion, 2025-2035)
- Architectural and Smart Glass Market
- Transportation
- Automotive
- Aircraft
- Marine
- Consumer Goods
- Power Generation