Certified Global Research Member
Isomar fd.webp Wcrc 57.webp
Key Questions Answered
  • Global Market Outlook
  • In-depth analysis of global and regional trends
  • Analyze and identify the major players in the market, their market share, key developments, etc.
  • To understand the capability of the major players based on products offered, financials, and strategies.
  • Identify disrupting products, companies, and trends.
  • To identify opportunities in the market.
  • Analyze the key challenges in the market.
  • Analyze the regional penetration of players, products, and services in the market.
  • Comparison of major players’ financial performance.
  • Evaluate strategies adopted by major players.
  • Recommendations
Why Choose Market Research Future?
  • Vigorous research methodologies for specific market.
  • Knowledge partners across the globe
  • Large network of partner consultants.
  • Ever-increasing/ Escalating data base with quarterly monitoring of various markets
  • Trusted by fortune 500 companies/startups/ universities/organizations
  • Large database of 5000+ markets reports.
  • Effective and prompt pre- and post-sales support.

Smart City Market Research Report Information By Component (Hardware, Software, Services), Application (Utility (Smart Meter Management, Smart Lighting Management, Smart Energy Management, Other), Transport (Smart Parking Management, Smart Ticketing, Intelligent Transportation System, Other), Government (Smart Governance, Smart Environmental Solutions, Other), Residential (Smart Homes, Smart Building), Smart Education, Smart Healthcare, Other), and Region (North America, Europe, Asia-Pacific & Rest Of The World)- Industry Forecast 2032


ID: MRFR/SEM/1955-CR | 187 Pages | Author: Aarti Dhapte| November 2023

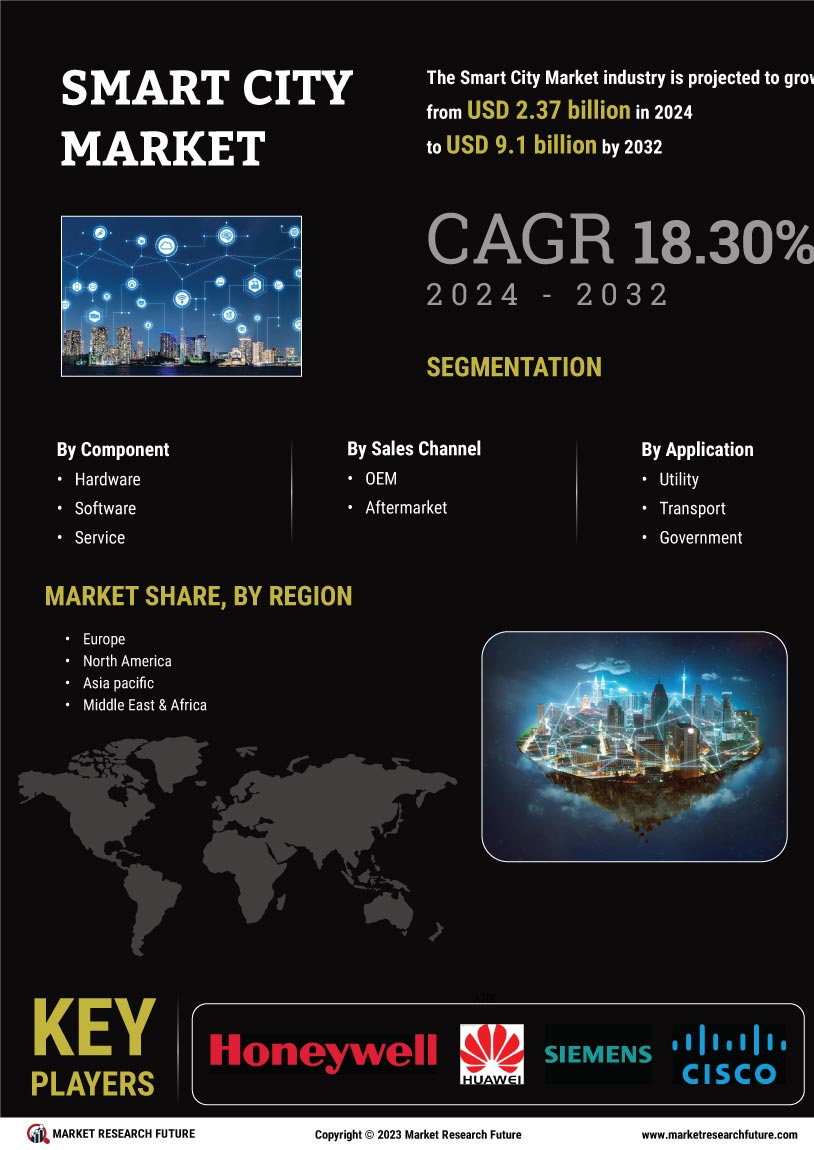
Smart City Market Segmentation


Smart City Component Outlook (USD Billion, 2018-2032)


  • Hardware


  • Software


  • Service


    • Consulting Services


    • Deployment & Integration Services


    • Infrastructure Monitoring and Management Services


Smart City Sales Channel Outlook (USD Billion, 2018-2032)


  • OEM


  • Aftermarket


Smart City Application Outlook (USD Billion, 2018-2032)


  • Utility


    • Smart Meter Management


    • Smart Lighting Management


    • Smart Energy Management


    • Smart Waste Management


    • Others


  • Transport


    • Smart Parking Management


    • Smart Ticketing


    • Intelligent Transportation System


    • Connected Car System


    • Others


  • Government


    • Smart Governance


    • Smart Environmental Solutions


    • Others


  • Residential


    • Smart Homes


    • Smart Building


  • Smart Education


  • Smart Healthcare


  • Others


Automotive Retread Tires Regional Outlook (USD Billion, 2018-2032)


  • North America Outlook (USD Billion, 2018-2032)


    • North America Smart City by Product Outlook


      • Hardware


      • Software


      • Service


        • Consulting Services


        • Deployment & Integration Services


        • Infrastructure Monitoring and Management Services


    • North America Smart City by Sales Channel Outlook


      • OEM


      • Aftermarket


    • North America Smart City by Application Outlook


      • Utility


        • Smart Meter Management


        • Smart Lighting Management


        • Smart Energy Management


        • Smart Waste Management


        • Others


      • Transport


        • Smart Parking Management


        • Smart Ticketing


        • Intelligent Transportation System


        • Connected Car System


        • Others


      • Government


        • Smart Governance


        • Smart Environmental Solutions


        • Others


      • Residential


        • Smart Homes


        • Smart Building


      • Smart Education


      • Smart Healthcare


      • Others


    • US Outlook (USD Billion, 2018-2032)


    • US Smart City by Product Outlook


      • Hardware


      • Software


      • Service


        • Consulting Services


        • Deployment & Integration Services


        • Infrastructure Monitoring and Management Services


    • US Smart City by Sales Channel Outlook


      • OEM


      • Aftermarket


    • US Smart City by Application Outlook


      • Utility


        • Smart Meter Management


        • Smart Lighting Management


        • Smart Energy Management


        • Smart Waste Management


        • Others


      • Transport


        • Smart Parking Management


        • Smart Ticketing


        • Intelligent Transportation System


        • Connected Car System


        • Others


      • Government


        • Smart Governance


        • Smart Environmental Solutions


        • Others


      • Residential


        • Smart Homes


        • Smart Building


      • Smart Education


      • Smart Healthcare


      • Others


    • Canada Outlook (USD Billion, 2018-2032)


    • Canada Smart City by Product Outlook


      • Hardware


      • Software


      • Service


        • Consulting Services


        • Deployment & Integration Services


        • Infrastructure Monitoring and Management Services


    • Canada Smart City by Sales Channel Outlook


      • OEM


      • Aftermarket


    • Canada Smart City by Application Outlook


      • Utility


        • Smart Meter Management


        • Smart Lighting Management


        • Smart Energy Management


        • Smart Waste Management


        • Others


      • Transport


        • Smart Parking Management


        • Smart Ticketing


        • Intelligent Transportation System


        • Connected Car System


        • Others


      • Government


        • Smart Governance


        • Smart Environmental Solutions


        • Others


      • Residential


        • Smart Homes


        • Smart Building


      • Smart Education


      • Smart Healthcare


      • Others


    • Mexico Outlook (USD Billion, 2018-2032)


    • Mexico Smart City by Product Outlook


      • Hardware


      • Software


      • Service


        • Consulting Services


        • Deployment & Integration Services


        • Infrastructure Monitoring and Management Services


    • Mexico Smart City by Sales Channel Outlook


      • OEM


      • Aftermarket


    • Mexico Smart City by Application Outlook


      • Utility


        • Smart Meter Management


        • Smart Lighting Management


        • Smart Energy Management


        • Smart Waste Management


        • Others


      • Transport


        • Smart Parking Management


        • Smart Ticketing


        • Intelligent Transportation System


        • Connected Car System


        • Others


      • Government


        • Smart Governance


        • Smart Environmental Solutions


        • Others


      • Residential


        • Smart Homes


        • Smart Building


      • Smart Education


      • Smart Healthcare


      • Others


  • Europe Outlook (USD Billion, 2018-2032)


    • Europe Smart City by Product Outlook


      • Hardware


      • Software


      • Service


        • Consulting Services


        • Deployment & Integration Services


        • Infrastructure Monitoring and Management Services


    • Europe Smart City by Sales Channel Outlook


      • OEM


      • Aftermarket


    • Europe Smart City by Application Outlook


      • Utility


        • Smart Meter Management


        • Smart Lighting Management


        • Smart Energy Management


        • Smart Waste Management


        • Others


      • Transport


        • Smart Parking Management


        • Smart Ticketing


        • Intelligent Transportation System


        • Connected Car System


        • Others


      • Government


        • Smart Governance


        • Smart Environmental Solutions


        • Others


      • Residential


        • Smart Homes


        • Smart Building


      • Smart Education


      • Smart Healthcare


      • Others


    • Germany Outlook (USD Billion, 2018-2032)


    • Germany Smart City by Product Outlook


      • Hardware


      • Software


      • Service


        • Consulting Services


        • Deployment & Integration Services


        • Infrastructure Monitoring and Management Services


    • Germany Smart City by Sales Channel Outlook


      • OEM


      • Aftermarket


    • Germany Smart City by Application Outlook


      • Utility


        • Smart Meter Management


        • Smart Lighting Management


        • Smart Energy Management


        • Smart Waste Management


        • Others


      • Transport


        • Smart Parking Management


        • Smart Ticketing


        • Intelligent Transportation System


        • Connected Car System


        • Others


      • Government


        • Smart Governance


        • Smart Environmental Solutions


        • Others


      • Residential


        • Smart Homes


        • Smart Building


      • Smart Education


      • Smart Healthcare


      • Others


    • UK Outlook (USD Billion, 2018-2032)


    • UK Smart City by Product Outlook


      • Hardware


      • Software


      • Service


        • Consulting Services


        • Deployment & Integration Services


        • Infrastructure Monitoring and Management Services


    • UK Smart City by Sales Channel Outlook


      • OEM


      • Aftermarket


    • UK Smart City by Application Outlook


      • Utility


        • Smart Meter Management


        • Smart Lighting Management


        • Smart Energy Management


        • Smart Waste Management


        • Others


      • Transport


        • Smart Parking Management


        • Smart Ticketing


        • Intelligent Transportation System


        • Connected Car System


        • Others


      • Government


        • Smart Governance


        • Smart Environmental Solutions


        • Others


      • Residential


        • Smart Homes


        • Smart Building


      • Smart Education


      • Smart Healthcare


      • Others


    • France Outlook (USD Billion, 2018-2032)


    • France Smart City by Product Outlook


      • Hardware


      • Software


      • Service


        • Consulting Services


        • Deployment & Integration Services


        • Infrastructure Monitoring and Management Services


    • France Smart City by Sales Channel Outlook


      • OEM


      • Aftermarket


    • France Smart City by Application Outlook


      • Utility


        • Smart Meter Management


        • Smart Lighting Management


        • Smart Energy Management


        • Smart Waste Management


        • Others


      • Transport


        • Smart Parking Management


        • Smart Ticketing


        • Intelligent Transportation System


        • Connected Car System


        • Others


      • Government


        • Smart Governance


        • Smart Environmental Solutions


        • Others


      • Residential


        • Smart Homes


        • Smart Building


      • Smart Education


      • Smart Healthcare


      • Others


    • Spain Outlook (USD Billion, 2018-2032)


    • Spain Smart City by Product Outlook


      • Hardware


      • Software


      • Service


        • Consulting Services


        • Deployment & Integration Services


        • Infrastructure Monitoring and Management Services


    • Spain Smart City by Sales Channel Outlook


      • OEM


      • Aftermarket


    • Spain Smart City by Application Outlook


      • Utility


        • Smart Meter Management


        • Smart Lighting Management


        • Smart Energy Management


        • Smart Waste Management


        • Others


      • Transport


        • Smart Parking Management


        • Smart Ticketing


        • Intelligent Transportation System


        • Connected Car System


        • Others


      • Government


        • Smart Governance


        • Smart Environmental Solutions


        • Others


      • Residential


        • Smart Homes


        • Smart Building


      • Smart Education


      • Smart Healthcare


      • Others


    • Rest Of Europe Outlook (USD Billion, 2018-2032)


    • Rest of Europe Smart City by Product Outlook


      • Hardware


      • Software


      • Service


        • Consulting Services


        • Deployment & Integration Services


        • Infrastructure Monitoring and Management Services


    • Rest of Europe Smart City by Sales Channel Outlook


      • OEM


      • Aftermarket


    • Rest of Europe Smart City by Application Outlook


      • Utility


        • Smart Meter Management


        • Smart Lighting Management


        • Smart Energy Management


        • Smart Waste Management


        • Others


      • Transport


        • Smart Parking Management


        • Smart Ticketing


        • Intelligent Transportation System


        • Connected Car System


        • Others


      • Government


        • Smart Governance


        • Smart Environmental Solutions


        • Others


      • Residential


        • Smart Homes


        • Smart Building


      • Smart Education


      • Smart Healthcare


      • Others


  • Asia-Pacific Outlook (USD Billion, 2018-2032)


    • Asia Pacific Smart City by Product Outlook


      • Hardware


      • Software


      • Service


        • Consulting Services


        • Deployment & Integration Services


        • Infrastructure Monitoring and Management Services


    • Asia Pacific Smart City by Sales Channel Outlook


      • OEM


      • Aftermarket


    • Asia Pacific Smart City by Application Outlook


      • Utility


        • Smart Meter Management


        • Smart Lighting Management


        • Smart Energy Management


        • Smart Waste Management


        • Others


      • Transport


        • Smart Parking Management


        • Smart Ticketing


        • Intelligent Transportation System


        • Connected Car System


        • Others


      • Government


        • Smart Governance


        • Smart Environmental Solutions


        • Others


      • Residential


        • Smart Homes


        • Smart Building


      • Smart Education


      • Smart Healthcare


      • Others


    • China Outlook (USD Billion, 2018-2032)


    • China Smart City by Product Outlook


      • Hardware


      • Software


      • Service


        • Consulting Services


        • Deployment & Integration Services


        • Infrastructure Monitoring and Management Services


    • China Smart City by Sales Channel Outlook


      • OEM


      • Aftermarket


    • China Smart City by Application Outlook


      • Utility


        • Smart Meter Management


        • Smart Lighting Management


        • Smart Energy Management


        • Smart Waste Management


        • Others


      • Transport


        • Smart Parking Management


        • Smart Ticketing


        • Intelligent Transportation System


        • Connected Car System


        • Others


      • Government


        • Smart Governance


        • Smart Environmental Solutions


        • Others


      • Residential


        • Smart Homes


        • Smart Building


      • Smart Education


      • Smart Healthcare


      • Others


    • Japan Outlook (USD Billion, 2018-2032)


    • Japan Smart City by Product Outlook


      • Hardware


      • Software


      • Service


        • Consulting Services


        • Deployment & Integration Services


        • Infrastructure Monitoring and Management Services


    • Japan Smart City by Sales Channel Outlook


      • OEM


      • Aftermarket


    • Japan Smart City by Application Outlook


      • Utility


        • Smart Meter Management


        • Smart Lighting Management


        • Smart Energy Management


        • Smart Waste Management


        • Others


      • Transport


        • Smart Parking Management


        • Smart Ticketing


        • Intelligent Transportation System


        • Connected Car System


        • Others


      • Government


        • Smart Governance


        • Smart Environmental Solutions


        • Others


      • Residential


        • Smart Homes


        • Smart Building


      • Smart Education


      • Smart Healthcare


      • Others


    • India Outlook (USD Billion, 2018-2032)


    • India Smart City by Product Outlook


      • Hardware


      • Software


      • Service


        • Consulting Services


        • Deployment & Integration Services


        • Infrastructure Monitoring and Management Services


    • India Smart City by Sales Channel Outlook


      • OEM


      • Aftermarket


    • India Smart City by Application Outlook


      • Utility


        • Smart Meter Management


        • Smart Lighting Management


        • Smart Energy Management


        • Smart Waste Management


        • Others


      • Transport


        • Smart Parking Management


        • Smart Ticketing


        • Intelligent Transportation System


        • Connected Car System


        • Others


      • Government


        • Smart Governance


        • Smart Environmental Solutions


        • Others


      • Residential


        • Smart Homes


        • Smart Building


      • Smart Education


      • Smart Healthcare


      • Others


    • South Korea Outlook (USD Billion, 2018-2032)


    • South Korea Smart City by Product Outlook


      • Hardware


      • Software


      • Service


        • Consulting Services


        • Deployment & Integration Services


        • Infrastructure Monitoring and Management Services


    • South Korea Smart City by Sales Channel Outlook


      • OEM


      • Aftermarket


    • South Korea Smart City by Application Outlook


      • Utility


        • Smart Meter Management


        • Smart Lighting Management


        • Smart Energy Management


        • Smart Waste Management


        • Others


      • Transport


        • Smart Parking Management


        • Smart Ticketing


        • Intelligent Transportation System


        • Connected Car System


        • Others


      • Government


        • Smart Governance


        • Smart Environmental Solutions


        • Others


      • Residential


        • Smart Homes


        • Smart Building


      • Smart Education


      • Smart Healthcare


      • Others


    • Rest of Asia-Pacific Outlook (USD Billion, 2018-2032)


    • Rest of Asia Pacific Smart City by Product Outlook


      • Hardware


      • Software


      • Service


        • Consulting Services


        • Deployment & Integration Services


        • Infrastructure Monitoring and Management Services


    • Rest of Asia Pacific Smart City by Sales Channel Outlook


      • OEM


      • Aftermarket


    • Rest of Asia Pacific Smart City by Application Outlook


      • Utility


        • Smart Meter Management


        • Smart Lighting Management


        • Smart Energy Management


        • Smart Waste Management


        • Others


      • Transport


        • Smart Parking Management


        • Smart Ticketing


        • Intelligent Transportation System


        • Connected Car System


        • Others


      • Government


        • Smart Governance


        • Smart Environmental Solutions


        • Others


      • Residential


        • Smart Homes


        • Smart Building


      • Smart Education


      • Smart Healthcare


      • Others


  • Middle East & Africa Outlook (USD Billion, 2018-2032)


    • Middle East & Africa Smart City by Product Outlook


      • Hardware


      • Software


      • Service


        • Consulting Services


        • Deployment & Integration Services


        • Infrastructure Monitoring and Management Services


    • Middle East & Africa Smart City by Sales Channel Outlook


      • OEM


      • Aftermarket


    • Middle East & Africa Smart City by Application Outlook


      • Utility


        • Smart Meter Management


        • Smart Lighting Management


        • Smart Energy Management


        • Smart Waste Management


        • Others


      • Transport


        • Smart Parking Management


        • Smart Ticketing


        • Intelligent Transportation System


        • Connected Car System


        • Others


      • Government


        • Smart Governance


        • Smart Environmental Solutions


        • Others


      • Residential


        • Smart Homes


        • Smart Building


      • Smart Education


      • Smart Healthcare


      • Others


  • South America Outlook (USD Billion, 2018-2032)


    • South America Smart City by Product Outlook


      • Hardware


      • Software


      • Service


        • Consulting Services


        • Deployment & Integration Services


        • Infrastructure Monitoring and Management Services


    • South America Smart City by Sales Channel Outlook


      • OEM


      • Aftermarket


    • South America City by Application Outlook


      • Utility


        • Smart Meter Management


        • Smart Lighting Management


        • Smart Energy Management


        • Smart Waste Management


        • Others


      • Transport


        • Smart Parking Management


        • Smart Ticketing


        • Intelligent Transportation System


        • Connected Car System


        • Others


      • Government


        • Smart Governance


        • Smart Environmental Solutions


        • Others


      • Residential


        • Smart Homes


        • Smart Building


      • Smart Education


      • Smart Healthcare


      • Others


Leading companies partner with us for data-driven Insights
client_1 client_2 client_3 client_4 client_5 client_6 client_7 client_8 client_9 client_10
Please fill in Business Email for Quick Response

TABLE OF CONTENTS

1 Executive Summary 21

1.1 MARKET ATTRACTIVENESS ANALYSIS 22

2 Market Introduction 23

2.1 Definition 23

2.2 Scope of the Study 23

2.3 Research Objective 23

2.4 Market Structure 23

3 Research Methodology 24

4 Market Dynamics 30

4.1 INTRODUCTION 30

4.2 DRIVERS 31

4.2.1 Increasing government initiatives for smart city projects 31

4.2.2 Rapid urbanization around the globe 32

4.2.3 Growing adoption of Artificial Intelligence (AI) in transportation sector 32

4.2.4 DRIVERS IMPACT ANALYSIS 33

4.3 Restraint 33

4.3.1 PRIVACY AND SECURITY CONCERNS OVER IOT APPLICATIONS 33

4.3.2 High implementation & maintenance costs 34

4.3.3 Lack of expertise & proficiencies of users 36

4.3.4 RESTRAINTs IMPACT ANALYSIS 37

4.4 opportunity 37

4.4.1 Increasing demand for AI solutions in transportation 37

4.4.2 Development of IoT technologies & devices to foster growth of smart city concepts 38

4.4.3 Increasing demand for green city initiatives 39

4.5 Impact of COVID-19 on the Market 40

4.5.1 Increasing focus on health, safety, and living standards in cities 40

4.5.2 Impact across industry sectors 41

4.5.3 Impact of COVID-19 on Overall Market Y-O-Y 2020-2022 41

5 Market Factor Analysis 43

5.1 SUPPLY Chain Analysis 43

5.1.1 Material Planning 43

5.1.2 Procurement & Integration 44

5.1.3 Warehouse and Fulfilment 44

5.1.4 Distribution 44

5.1.5 Installation and Service 44

5.2 PORTER'S FIVE FORCE MODEL 45

5.2.1 THREAT OF NEW ENTRANTS 45

5.2.2 BARGAINING POWER OF SUPPLIERS 46

5.2.3 THREAT OF SUBSTITUTES 46

5.2.4 Bargaining Power of Buyers 46

5.2.5 InteNSity of Rivalry 46

6 GLOBAL SMART CITY MARKET, BY Component 47

6.1 OVERVIEW 47

6.1.1 Global Smart City market, BY component, 2024–2032 (USD BILLION) 48

6.2 Hardware 48

6.3 Software 48

6.4 Service 48

6.4.1 Global Smart City market, BY SERVICE, 2024–2032 (USD BILLION) 49

6.4.2 Consulting Services 49

6.4.3 Deployment & Integration Services 49

6.4.4 Infrastructure Monitoring and Management Services 49

7 GLOBAL SMART CITY MARKET, BY APPLICATION 50

7.1 OVERVIEW 50

7.1.1 Global Smart City market, BY application, 2024–2032 (USD BILLION) 51

7.2 Utility 51

7.2.1 Global Smart City market, BY Utility, 2024–2032 (USD BILLION) 51

7.2.2 Smart Meter Management 51

7.2.3 Smart Lighting Management 52

7.2.4 Smart Energy Management 52

7.2.5 Smart Waste Management 52

7.2.6 Others 52

7.3 Transport 52

7.3.1 Global Smart City market, BY Transport, 2024–2032 (USD BILLION) 52

7.3.2 Smart Parking Management 52

7.3.3 Smart Ticketing 53

7.3.4 Intelligent Transportation System 53

7.3.5 Connected Car System 53

7.3.6 Others 53

7.4 Government 53

7.4.1 Global Smart City market, BY Government, 2024–2032 (USD BILLION) 53

7.4.2 Smart Governance 53

7.4.3 Smart Environmental Solutions 54

7.4.4 Others 54

7.5 Residential 54

7.5.1 Global Smart City market, BY Residential, 2024–2032 (USD BILLION) 54

7.5.2 Smart Homes 54

7.5.3 Smart Building 54

7.6 Smart Education 55

7.7 Smart Healthcare 55

7.8 Others 55

8 Global Smart City market, BY Region 56

8.1 OVERVIEW 56

8.1.1 Global Smart City market, by Region, 2022 VS 2032 (USD BILLION) 56

8.1.2 Global Smart City market, BY Region, 2024–2032 (USD BILLION) 57

8.2 North america 58

8.2.1 North america: SMART CITY market, BY Country, 2024–2032 (USD BILLION) 59

8.2.2 North America Smart City market, BY COMPONENT, 2024–2032 (USD BILLION) 60

8.2.2.1 NORTH AMERICA Smart City market, BY SERVICE, 2024–2032 (USD BILLION) 60

8.2.3 North America Smart City market, BY APPLICATION, 2024–2032 (USD BILLION) 61

8.2.3.1 North America Smart City market, BY Utility, 2024–2032 (USD BILLION) 62

8.2.3.2 North America Smart City market, BY Transport, 2024–2032 (USD BILLION) 62

8.2.3.3 North America Smart City market, BY Government, 2024–2032 (USD BILLION) 62

8.2.3.4 North America Smart City market, BY Residential, 2024–2032 (USD BILLION) 63

8.2.4 US 63

8.2.4.1 US Smart City market, BY COMPONENT, 2024–2032 (USD BILLION) 63

8.2.4.1.1 US Smart City market, BY SERVICE, 2024–2032 (USD BILLION) 63

8.2.4.2 US Smart City market, BY APPLICATION, 2024–2032 (USD BILLION) 64

8.2.4.2.1 US Smart City market, BY Utility, 2024–2032 (USD BILLION) 64

8.2.4.2.2 US Smart City market, BY Transport, 2024–2032 (USD BILLION) 64

8.2.4.2.3 US Smart City market, BY Government, 2024–2032 (USD BILLION) 65

8.2.4.2.4 US Smart City market, BY Residential, 2024–2032 (USD BILLION) 65

8.2.5 canada 65

8.2.5.1 CANADA Smart City market, BY COMPONENT, 2024–2032 (USD BILLION) 65

8.2.5.1.1 CANADA Smart City market, BY SERVICE, 2024–2032 (USD BILLION) 66

8.2.5.2 CANADA Smart City market, BY APPLICATION, 2024–2032 (USD BILLION) 66

8.2.5.2.1 CANADA Smart City market, BY Utility, 2024–2032 (USD BILLION) 66

8.2.5.2.2 CANADA Smart City market, BY Transport, 2024–2032 (USD BILLION) 67

8.2.5.2.3 CANADA Smart City market, BY Government, 2024–2032 (USD BILLION) 67

8.2.5.2.4 CANADA Smart City market, BY Residential, 2024–2032 (USD BILLION) 67

8.2.6 mexico 68

8.2.6.1 MEXICO Smart City market, BY COMPONENT, 2024–2032 (USD BILLION) 68

8.2.6.1.1 MEXICO Smart City market, BY SERVICE, 2024–2032 (USD BILLION) 68

8.2.6.2 MEXICO Smart City market, BY APPLICATION, 2024–2032 (USD BILLION) 68

8.2.6.2.1 MEXICO Smart City market, BY Utility, 2024–2032 (USD BILLION) 69

8.2.6.2.2 MEXICO Smart City market, BY Transport, 2024–2032 (USD BILLION) 69

8.2.6.2.3 MEXICO Smart City market, BY Government, 2024–2032 (USD BILLION) 69

8.2.6.2.4 MEXICO Smart City market, BY Residential, 2024–2032 (USD BILLION) 70

8.3 Europe 71

8.3.1 Europe: SMART CITY market, BY Country, 2024–2032 (USD BILLION) 72

8.3.2 EUROPE Smart City market, BY COMPONENT, 2024–2032 (USD BILLION) 73

8.3.2.1 EUROPE Smart City market, BY SERVICE, 2024–2032 (USD BILLION) 73

8.3.3 EUROPE Smart City market, BY APPLICATION, 2024–2032 (USD BILLION) 74

8.3.3.1 EUROPE Smart City market, BY Utility, 2024–2032 (USD BILLION) 75

8.3.3.2 EUROPE Smart City market, BY Transport, 2024–2032 (USD BILLION) 75

8.3.3.3 EUROPE Smart City market, BY Government, 2024–2032 (USD BILLION) 75

8.3.3.4 EUROPE Smart City market, BY Residential, 2024–2032 (USD BILLION) 76

8.3.4 Germany 76

8.3.4.1 GERMANY Smart City market, BY COMPONENT, 2024–2032 (USD BILLION) 76

8.3.4.1.1 GERMANY Smart City market, BY SERVICE, 2024–2032 (USD BILLION) 76

8.3.4.2 GERMANY Smart City market, BY APPLICATION, 2024–2032 (USD BILLION) 77

8.3.4.2.1 GERMANY Smart City market, BY Utility, 2024–2032 (USD BILLION) 77

8.3.4.2.2 GERMANY Smart City market, BY Transport, 2024–2032 (USD BILLION) 77

8.3.4.2.3 GERMANY Smart City market, BY Government, 2024–2032 (USD BILLION) 78

8.3.4.2.4 GERMANY Smart City market, BY Residential, 2024–2032 (USD BILLION) 78

8.3.5 UK 78

8.3.5.1 UK Smart City market, BY COMPONENT, 2024–2032 (USD BILLION) 78

8.3.5.1.1 UK Smart City market, BY SERVICE, 2024–2032 (USD BILLION) 79

8.3.5.2 UK Smart City market, BY APPLICATION, 2024–2032 (USD BILLION) 79

8.3.5.2.1 UK Smart City market, BY Utility, 2024–2032 (USD BILLION) 79

8.3.5.2.2 UK Smart City market, BY Transport, 2024–2032 (USD BILLION) 80

8.3.5.2.3 UK Smart City market, BY Government, 2024–2032 (USD BILLION) 80

8.3.5.2.4 UK Smart City market, BY Residential, 2024–2032 (USD BILLION) 80

8.3.6 FRANCE 81

8.3.6.1 FRANCE Smart City market, BY COMPONENT, 2024–2032 (USD BILLION) 81

8.3.6.1.1 FRANCE Smart City market, BY SERVICE, 2024–2032 (USD BILLION) 81

8.3.6.2 FRANCE Smart City market, BY APPLICATION, 2024–2032 (USD BILLION) 81

8.3.6.2.1 FRANCE Smart City market, BY Utility, 2024–2032 (USD BILLION) 82

8.3.6.2.2 FRANCE Smart City market, BY Transport, 2024–2032 (USD BILLION) 82

8.3.6.2.3 FRANCE Smart City market, BY Government, 2024–2032 (USD BILLION) 82

8.3.6.2.4 FRANCE Smart City market, BY Residential, 2024–2032 (USD BILLION) 83

8.3.7 SPAIN 83

8.3.7.1 SPAIN Smart City market, BY COMPONENT, 2024–2032 (USD BILLION) 83

8.3.7.1.1 SPAIN Smart City market, BY SERVICE, 2024–2032 (USD BILLION) 83

8.3.7.2 SPAIN Smart City market, BY APPLICATION, 2024–2032 (USD BILLION) 84

8.3.7.2.1 SPAIN Smart City market, BY Utility, 2024–2032 (USD BILLION) 84

8.3.7.2.2 SPAIN Smart City market, BY Transport, 2024–2032 (USD BILLION) 84

8.3.7.2.3 SPAIN Smart City market, BY Government, 2024–2032 (USD BILLION) 85

8.3.7.2.4 SPAIN Smart City market, BY Residential, 2024–2032 (USD BILLION) 85

8.3.8 Rest of Europe 85

8.3.8.1 REST OF EUROPE Smart City market, BY COMPONENT, 2024–2032 (USD BILLION) 85

8.3.8.1.1 REST OF EUROPE Smart City market, BY SERVICE, 2024–2032 (USD BILLION) 86

8.3.8.2 REST OF EUROPE Smart City market, BY APPLICATION, 2024–2032 (USD BILLION) 86

8.3.8.2.1 REST OF EUROPE Smart City market, BY Utility, 2024–2032 (USD BILLION) 86

8.3.8.2.2 REST OF EUROPE Smart City market, BY Transport, 2024–2032 (USD BILLION) 87

8.3.8.2.3 REST OF EUROPE Smart City market, BY Government, 2024–2032 (USD BILLION) 87

8.3.8.2.4 REST OF EUROPE Smart City market, BY Residential, 2024–2032 (USD BILLION) 87

8.4 Asia-Pacific 88

8.4.1 Asia-Pacific: SMART CITY market, BY Country, 2024–2032 (USD BILLION) 89

8.4.2 ASIA-PACIFIC Smart City market, BY COMPONENT, 2024–2032 (USD BILLION) 90

8.4.2.1 ASIA-PACIFIC Smart City market, BY SERVICE, 2024–2032 (USD BILLION) 90

8.4.3 ASIA-PACIFIC Smart City market, BY APPLICATION, 2024–2032 (USD BILLION) 91

8.4.3.1 ASIA-PACIFIC Smart City market, BY Utility, 2024–2032 (USD BILLION) 92

8.4.3.2 ASIA-PACIFIC Smart City market, BY Transport, 2024–2032 (USD BILLION) 92

8.4.3.3 ASIA-PACIFIC Smart City market, BY Government, 2024–2032 (USD BILLION) 92

8.4.3.4 ASIA-PACIFIC Smart City market, BY Residential, 2024–2032 (USD BILLION) 93

8.4.4 China 93

8.4.4.1 CHINA Smart City market, BY COMPONENT, 2024–2032 (USD BILLION) 93

8.4.4.1.1 CHINA Smart City market, BY SERVICE, 2024–2032 (USD BILLION) 93

8.4.4.2 CHINA Smart City market, BY APPLICATION, 2024–2032 (USD BILLION) 94

8.4.4.2.1 CHINA Smart City market, BY Utility, 2024–2032 (USD BILLION) 94

8.4.4.2.2 CHINA Smart City market, BY Transport, 2024–2032 (USD BILLION) 94

8.4.4.2.3 CHINA Smart City market, BY Government, 2024–2032 (USD BILLION) 95

8.4.4.2.4 CHINA Smart City market, BY Residential, 2024–2032 (USD BILLION) 95

8.4.5 Japan 95

8.4.5.1 JAPAN Smart City market, BY COMPONENT, 2024–2032 (USD BILLION) 95

8.4.5.1.1 JAPAN Smart City market, BY SERVICE, 2024–2032 (USD BILLION) 96

8.4.5.2 JAPAN Smart City market, BY APPLICATION, 2024–2032 (USD BILLION) 96

8.4.5.2.1 JAPAN Smart City market, BY Utility, 2024–2032 (USD BILLION) 96

8.4.5.2.2 JAPAN Smart City market, BY Transport, 2024–2032 (USD BILLION) 97

8.4.5.2.3 JAPAN Smart City market, BY Government, 2024–2032 (USD BILLION) 97

8.4.5.2.4 JAPAN Smart City market, BY Residential, 2024–2032 (USD BILLION) 97

8.4.6 SOUTH KOREA 98

8.4.6.1 SOUTH KOREA Smart City market, BY COMPONENT, 2024–2032 (USD BILLION) 98

8.4.6.1.1 SOUTH KOREA Smart City market, BY SERVICE, 2024–2032 (USD BILLION) 98

8.4.6.2 SOUTH KOREA Smart City market, BY APPLICATION, 2024–2032 (USD BILLION) 98

8.4.6.2.1 SOUTH KOREA Smart City market, BY Utility, 2024–2032 (USD BILLION) 99

8.4.6.2.2 SOUTH KOREA Smart City market, BY Transport, 2024–2032 (USD BILLION) 99

8.4.6.2.3 SOUTH KOREA Smart City market, BY Government, 2024–2032 (USD BILLION) 99

8.4.6.2.4 SOUTH KOREA Smart City market, BY Residential, 2024–2032 (USD BILLION) 100

8.4.7 INDIA 100

8.4.7.1 INDIA Smart City market, BY COMPONENT, 2024–2032 (USD BILLION) 100

8.4.7.1.1 INDIA Smart City market, BY SERVICE, 2024–2032 (USD BILLION) 100

8.4.7.2 INDIA Smart City market, BY APPLICATION, 2024–2032 (USD BILLION) 101

8.4.7.2.1 INDIA Smart City market, BY Utility, 2024–2032 (USD BILLION) 101

8.4.7.2.2 INDIA Smart City market, BY Transport, 2024–2032 (USD BILLION) 101

8.4.7.2.3 INDIA Smart City market, BY Government, 2024–2032 (USD BILLION) 102

8.4.7.2.4 INDIA Smart City market, BY Residential, 2024–2032 (USD BILLION) 102

8.4.8 Rest of Asia-Pacific 102

8.4.8.1 REST OF ASIA-PACIFIC Smart City market, BY COMPONENT, 2024–2032 (USD BILLION) 102

8.4.8.1.1 REST OF ASIA-PACIFIC Smart City market, BY SERVICE, 2024–2032 (USD BILLION) 103

8.4.8.2 REST OF ASIA-PACIFIC Smart City market, BY APPLICATION, 2024–2032 (USD BILLION) 103

8.4.8.2.1 REST OF ASIA-PACIFIC Smart City market, BY Utility, 2024–2032 (USD BILLION) 104

8.4.8.2.2 REST OF ASIA-PACIFIC Smart City market, BY Transport, 2024–2032 (USD BILLION) 104

8.4.8.2.3 REST OF ASIA-PACIFIC Smart City market, BY Government, 2024–2032 (USD BILLION) 104

8.4.8.2.4 REST OF ASIA-PACIFIC Smart City market, BY Residential, 2024–2032 (USD BILLION) 105

8.5 mIDDLE EAST & AFRICA 106

8.5.1 MIDDLE EAST & AFRICA Smart City market, BY COMPONENT, 2024–2032 (USD BILLION) 106

8.5.1.1 MIDDLE EAST & AFRICA Smart City market, BY SERVICE, 2024–2032 (USD BILLION) 107

8.5.2 MIDDLE EAST & AFRICA Smart City market, BY APPLICATION, 2024–2032 (USD BILLION) 108

8.5.2.1 MIDDLE EAST & AFRICA Smart City market, BY Utility, 2024–2032 (USD BILLION) 108

8.5.2.2 MIDDLE EAST & AFRICA Smart City market, BY Transport, 2024–2032 (USD BILLION) 109

8.5.2.3 MIDDLE EAST & AFRICA Smart City market, BY Government, 2024–2032 (USD BILLION) 109

8.5.2.4 MIDDLE EAST & AFRICA Smart City market, BY Residential, 2024–2032 (USD BILLION) 109

8.6 South America 110

8.6.1 SOUTH AMERICA Smart City market, BY COMPONENT, 2024–2032 (USD BILLION) 110

8.6.1.1 SOUTH AMERICA Smart City market, BY SERVICE, 2024–2032 (USD BILLION) 111

8.6.2 SOUTH AMERICA Smart City market, BY APPLICATION, 2024–2032 (USD BILLION) 112

8.6.2.1 SOUTH AMERICA Smart City market, BY Utility, 2024–2032 (USD BILLION) 112

8.6.2.2 SOUTH AMERICA Smart City market, BY Transport, 2024–2032 (USD BILLION) 113

8.6.2.3 SOUTH AMERICA Smart City market, BY Government, 2024–2032 (USD BILLION) 113

8.6.2.4 SOUTH AMERICA Smart City market, BY Residential, 2024–2032 (USD BILLION) 113

9 COMPETITVE LANDSCAPE 114

9.1 Competitive benchmarking 115

9.2 Vendor share analysis 116

9.3 recent developments 116

9.3.1 Product development 116

9.3.2 Acquisitions/mergers/Expansion 118

10 company profiles 123

10.1 Honeywell International Inc. 123

10.1.1 COMPANY OVERVIEW 123

10.1.2 FINANCIAL OVERVIEW 124

10.1.3 PRODUCTS OFFERed 125

10.1.4 KEY DEVELOPMENTS 126

10.1.5 SWOT ANALYSIS 127

10.1.6 Key Strategies 127

10.2 Huawei Technologies Co. Ltd 128

10.2.1 COMPANY OVERVIEW 128

10.2.2 FINANCIAL OVERVIEW 129

10.2.3 PRODUCTS/SOLUTIONS/SERVICES/SOLUTIONS OFFERED 129

10.2.4 KEY DEVELOPMENTS 130

10.2.5 SWOT ANALYSIS 130

10.2.6 Key Strategies 131

10.3 siemens ag 132

10.3.1 COMPANY OVERVIEW 132

10.3.2 FINANCIAL OVERVIEW 133

10.3.3 Products/Solutions/Services OFFERed 134

10.3.4 KEY DEVELOPMENTS 136

10.3.5 SWOT ANALYSIS 137

10.3.6 KEY STRATEGIES 137

10.4 CISCO SYSTEMS INC. 138

10.4.1 COMPANY OVERVIEW 138

10.4.2 FINANCIAL OVERVIEW 139

10.4.3 PRODUCTS OFFERED 139

10.4.4 KEY DEVELOPMENTS 140

10.4.5 SWOT ANALYSIS 141

10.4.6 KEY STRATEGIES 141

10.5 Schneider electric 142

10.5.1 COMPANY OVERVIEW 142

10.5.2 FINANCIAL OVERVIEW 143

10.5.3 PRODUCTS OFFERed 144

10.5.4 KEY DEVELOPMENTS 145

10.5.5 SWOT ANALYSIS 146

10.5.6 KEY STRATEGIES 146

10.6 IBM corporation 147

10.6.1 COMPANY OVERVIEW 147

10.6.2 FINANCIAL OVERVIEW 148

10.6.3 PRODUCTS/solutions/SERVICES OFFERED 149

10.6.4 KEY DEVELOPMENTS 150

10.6.5 SWOT ANALYSIS 150

10.6.6 KEY STRATEGIES 150

10.7 AT&T Inc. 151

10.7.1 COMPANY OVERVIEW 151

10.7.2 FINANCIAL OVERVIEW 152

10.7.3 PRODUCTS OFFERed 152

10.7.4 KEY DEVELOPMENTS 153

10.7.5 SWOT ANALYSIS 154

10.7.6 Key Strategies 154

10.8 ORACLE 155

10.8.1 Company overview 155

10.8.2 Financial Overview 156

10.8.3 PRODUCTS OFFERED 156

10.8.4 KEY DEVELOPMENTS 157

10.8.5 SWOT Analysis 157

10.8.6 KEY STRATEGIES 158

10.8.7 COMPANY OVERVIEW 159

10.8.8 FINANCIAL OVERVIEW 160

10.8.9 PRODUCTS OFFERED 160

10.8.10 KEY DEVELOPMENTS 161

10.8.11 SWOT Analysis 161

10.8.12 KEY STRATEGIES 162

10.9 ABB 163

10.9.1 COMPANY OVERVIEW 163

10.9.2 Financial Overview 164

10.9.3 PRODUCTS/SOLUTIONS/SERVICES OFFERED 164

10.9.4 KEY DEVELOPMENTS 165

10.9.5 Swot analysis 166

10.9.6 Key Strategies 166

10.10 Sap Se 167

10.10.1 Company overview 167

10.10.2 Financial Overview 168

10.10.3 PRODUCTS OFFERED 168

10.10.4 KEY DEVELOPMENTS 169

10.10.5 SWOT ANALYSIS 169

10.10.6 KEY STRATEGIES 169

10.11 Hitachi Vantara 170

10.11.1 COMPANY OVERVIEW 170

10.11.2 FINANCIAL OVERVIEW 171

10.11.3 Products/Solutions/Services OFFERed 171

10.11.4 KEY DEVELOPMENTS 172

10.11.5 SWOT ANALYSIS 173

10.11.6 KEY STRATEGIES 173

10.12 Telefonaktiebolaget LM Ericsson 174

10.12.1 COMPANY OVERVIEW 174

10.12.2 FINANCIAL OVERVIEW 175

10.12.3 PRODUCTS OFFERed 175

10.12.4 KEY DEVELOPMENTS 176

10.12.5 SWOT ANALYSIS 177

10.12.6 Key Strategies 177

10.13 Itron Inc. 178

10.13.1 COMPANY OVERVIEW 178

10.13.2 FINANCIAL OVERVIEW 179

10.13.3 Products/Solutions/Services OFFERed 179

10.13.4 KEY DEVELOPMENTS 180

10.13.5 SWOT Analysis 181

10.13.6 KEY STRATEGIES 181

10.14 Tietoevry 182

10.14.1 Company overview 182

10.14.2 Financial Overview 182

10.14.3 PRODUCTS OFFERED 182

10.14.4 KEY DEVELOPMENTS 183

LIST OF TABLES

TABLE 1 MARKET SYNOPSIS 22

TABLE 2 GLOBAL SMART CITY MARKET, BY COMPONENT, 2024–2032 (USD BILLION) 48

TABLE 3 GLOBAL SMART CITY MARKET, BY SERVICE, 2024–2032 (USD BILLION) 49

TABLE 4 GLOBAL SMART CITY MARKET, BY APPLICATION, 2024–2032 (USD BILLION) 51

TABLE 5 GLOBAL SMART CITY MARKET, BY UTILITY, 2024–2032 (USD BILLION) 51

TABLE 6 GLOBAL SMART CITY MARKET, BY TRANSPORT, 2024–2032 (USD BILLION) 52

TABLE 7 GLOBAL SMART CITY MARKET, BY GOVERNMENT, 2024–2032 (USD BILLION) 53

TABLE 8 GLOBAL SMART CITY MARKET, BY RESIDENTIAL, 2024–2032 (USD BILLION) 54

TABLE 9 GLOBAL SMART CITY MARKET, BY REGION, 2024–2032 (USD BILLION) 57

TABLE 10 NORTH AMERICA SMART CITY MARKET, BY COUNTRY, 2024–2032 (USD BILLION) 59

TABLE 11 NORTH AMERICA SMART CITY MARKET, BY COMPONENT, 2024–2032 (USD BILLION) 60

TABLE 12 NORTH AMERICA SMART CITY MARKET, BY SERVICE, 2024–2032 (USD BILLION) 60

TABLE 13 NORTH AMERICA SMART CITY MARKET, BY APPLICATION, 2024–2032 (USD BILLION) 61

TABLE 14 NORTH AMERICA SMART CITY MARKET, BY UTILITY, 2024–2032 (USD BILLION) 62

TABLE 15 NORTH AMERICA SMART CITY MARKET, BY TRANSPORT, 2024–2032 (USD BILLION) 62

TABLE 16 NORTH AMERICA SMART CITY MARKET, BY GOVERNMENT, 2024–2032 (USD BILLION) 62

TABLE 17 NORTH AMERICA SMART CITY MARKET, BY RESIDENTIAL, 2024–2032 (USD BILLION) 63

TABLE 18 US SMART CITY MARKET, BY COMPONENT, 2024–2032 (USD BILLION) 63

TABLE 19 US SMART CITY MARKET, BY SERVICE, 2024–2032 (USD BILLION) 63

TABLE 20 US SMART CITY MARKET, BY APPLICATION, 2024–2032 (USD BILLION) 64

TABLE 21 US SMART CITY MARKET, BY UTILITY, 2024–2032 (USD BILLION) 64

TABLE 22 US SMART CITY MARKET, BY TRANSPORT, 2024–2032 (USD BILLION) 64

TABLE 23 US SMART CITY MARKET, BY GOVERNMENT, 2024–2032 (USD BILLION) 65

TABLE 24 US SMART CITY MARKET, BY RESIDENTIAL, 2024–2032 (USD BILLION) 65

TABLE 25 CANADA SMART CITY MARKET, BY COMPONENT, 2024–2032 (USD BILLION) 65

TABLE 26 CANADA SMART CITY MARKET, BY SERVICE, 2024–2032 (USD BILLION) 66

TABLE 27 CANADA SMART CITY MARKET, BY APPLICATION, 2024–2032 (USD BILLION) 66

TABLE 28 CANADA SMART CITY MARKET, BY UTILITY, 2024–2032 (USD BILLION) 66

TABLE 29 CANADA SMART CITY MARKET, BY TRANSPORT, 2024–2032 (USD BILLION) 67

TABLE 30 CANADA SMART CITY MARKET, BY GOVERNMENT, 2024–2032 (USD BILLION) 67

TABLE 31 CANADA SMART CITY MARKET, BY RESIDENTIAL, 2024–2032 (USD BILLION) 67

TABLE 32 MEXICO SMART CITY MARKET, BY COMPONENT, 2024–2032 (USD BILLION) 68

TABLE 33 MEXICO SMART CITY MARKET, BY SERVICE, 2024–2032 (USD BILLION) 68

TABLE 34 MEXICO SMART CITY MARKET, BY APPLICATION, 2024–2032 (USD BILLION) 68

TABLE 35 MEXICO SMART CITY MARKET, BY UTILITY, 2024–2032 (USD BILLION) 69

TABLE 36 MEXICO SMART CITY MARKET, BY TRANSPORT, 2024–2032 (USD BILLION) 69

TABLE 37 MEXICO SMART CITY MARKET, BY GOVERNMENT, 2024–2032 (USD BILLION) 69

TABLE 38 MEXICO SMART CITY MARKET, BY RESIDENTIAL, 2024–2032 (USD BILLION) 70

TABLE 39 EUROPE SMART CITY MARKET, BY COUNTRY, 2024–2032 (USD BILLION) 72

TABLE 40 EUROPE SMART CITY MARKET, BY COMPONENT, 2024–2032 (USD BILLION) 73

TABLE 41 EUROPE SMART CITY MARKET, BY SERVICE, 2024–2032 (USD BILLION) 73

TABLE 42 EUROPE SMART CITY MARKET, BY APPLICATION, 2024–2032 (USD BILLION) 74

TABLE 43 EUROPE SMART CITY MARKET, BY UTILITY, 2024–2032 (USD BILLION) 75

TABLE 44 EUROPE SMART CITY MARKET, BY TRANSPORT, 2024–2032 (USD BILLION) 75

TABLE 45 EUROPE SMART CITY MARKET, BY GOVERNMENT, 2024–2032 (USD BILLION) 75

TABLE 46 EUROPE SMART CITY MARKET, BY RESIDENTIAL, 2024–2032 (USD BILLION) 76

TABLE 47 GERMANY SMART CITY MARKET, BY COMPONENT, 2024–2032 (USD BILLION) 76

TABLE 48 GERMANY SMART CITY MARKET, BY SERVICE, 2024–2032 (USD BILLION) 76

TABLE 49 GERMANY SMART CITY MARKET, BY APPLICATION, 2024–2032 (USD BILLION) 77

TABLE 50 GERMANY SMART CITY MARKET, BY UTILITY, 2024–2032 (USD BILLION) 77

TABLE 51 GERMANY SMART CITY MARKET, BY TRANSPORT, 2024–2032 (USD BILLION) 77

TABLE 52 GERMANY SMART CITY MARKET, BY GOVERNMENT, 2024–2032 (USD BILLION) 78

TABLE 53 GERMANY SMART CITY MARKET, BY RESIDENTIAL, 2024–2032 (USD BILLION) 78

TABLE 54 UK SMART CITY MARKET, BY COMPONENT, 2024–2032 (USD BILLION) 78

TABLE 55 UK SMART CITY MARKET, BY SERVICE, 2024–2032 (USD BILLION) 79

TABLE 56 UK SMART CITY MARKET, BY APPLICATION, 2024–2032 (USD BILLION) 79

TABLE 57 UK SMART CITY MARKET, BY UTILITY, 2024–2032 (USD BILLION) 79

TABLE 58 UK SMART CITY MARKET, BY TRANSPORT, 2024–2032 (USD BILLION) 80

TABLE 59 UK SMART CITY MARKET, BY GOVERNMENT, 2024–2032 (USD BILLION) 80

TABLE 60 UK SMART CITY MARKET, BY RESIDENTIAL, 2024–2032 (USD BILLION) 80

TABLE 61 FRANCE SMART CITY MARKET, BY COMPONENT, 2024–2032 (USD BILLION) 81

TABLE 62 FRANCE SMART CITY MARKET, BY SERVICE, 2024–2032 (USD BILLION) 81

TABLE 63 FRANCE SMART CITY MARKET, BY APPLICATION, 2024–2032 (USD BILLION) 81

TABLE 64 FRANCE SMART CITY MARKET, BY UTILITY, 2024–2032 (USD BILLION) 82

TABLE 65 FRANCE SMART CITY MARKET, BY TRANSPORT, 2024–2032 (USD BILLION) 82

TABLE 66 FRANCE SMART CITY MARKET, BY GOVERNMENT, 2024–2032 (USD BILLION) 82

TABLE 67 FRANCE SMART CITY MARKET, BY RESIDENTIAL, 2024–2032 (USD BILLION) 83

TABLE 68 SPAIN SMART CITY MARKET, BY COMPONENT, 2024–2032 (USD BILLION) 83

TABLE 69 SPAIN SMART CITY MARKET, BY SERVICE, 2024–2032 (USD BILLION) 83

TABLE 70 SPAIN SMART CITY MARKET, BY APPLICATION, 2024–2032 (USD BILLION) 84

TABLE 71 SPAIN SMART CITY MARKET, BY UTILITY, 2024–2032 (USD BILLION) 84

TABLE 72 SPAIN SMART CITY MARKET, BY TRANSPORT, 2024–2032 (USD BILLION) 84

TABLE 73 SPAIN SMART CITY MARKET, BY GOVERNMENT, 2024–2032 (USD BILLION) 85

TABLE 74 SPAIN SMART CITY MARKET, BY RESIDENTIAL, 2024–2032 (USD BILLION) 85

TABLE 75 REST OF EUROPE SMART CITY MARKET, BY COMPONENT, 2024–2032 (USD BILLION) 85

TABLE 76 REST OF EUROPE SMART CITY MARKET, BY SERVICE, 2024–2032 (USD BILLION) 86

TABLE 77 REST OF EUROPE SMART CITY MARKET, BY APPLICATION, 2024–2032 (USD BILLION) 86

TABLE 78 REST OF EUROPE SMART CITY MARKET, BY UTILITY, 2024–2032 (USD BILLION) 86

TABLE 79 REST OF EUROPE SMART CITY MARKET, BY TRANSPORT, 2024–2032 (USD BILLION) 87

TABLE 80 REST OF EUROPE SMART CITY MARKET, BY GOVERNMENT, 2024–2032 (USD BILLION) 87

TABLE 81 REST OF EUROPE SMART CITY MARKET, BY RESIDENTIAL, 2024–2032 (USD BILLION) 87

TABLE 82 ASIA-PACIFIC SMART CITY MARKET, BY COUNTRY, 2024–2032 (USD BILLION) 89

TABLE 83 ASIA-PACIFIC SMART CITY MARKET, BY COMPONENT, 2024–2032 (USD BILLION) 90

TABLE 84 ASIA-PACIFIC SMART CITY MARKET, BY SERVICE, 2024–2032 (USD BILLION) 90

TABLE 85 ASIA-PACIFIC SMART CITY MARKET, BY APPLICATION, 2024–2032 (USD BILLION) 91

TABLE 86 ASIA-PACIFIC SMART CITY MARKET, BY UTILITY, 2024–2032 (USD BILLION) 92

TABLE 87 ASIA-PACIFIC SMART CITY MARKET, BY TRANSPORT, 2024–2032 (USD BILLION) 92

TABLE 88 ASIA-PACIFIC SMART CITY MARKET, BY GOVERNMENT, 2024–2032 (USD BILLION) 92

TABLE 89 ASIA-PACIFIC SMART CITY MARKET, BY RESIDENTIAL, 2024–2032 (USD BILLION) 93

TABLE 90 CHINA SMART CITY MARKET, BY COMPONENT, 2024–2032 (USD BILLION) 93

TABLE 91 CHINA SMART CITY MARKET, BY SERVICE, 2024–2032 (USD BILLION) 93

TABLE 92 CHINA SMART CITY MARKET, BY APPLICATION, 2024–2032 (USD BILLION) 94

TABLE 93 CHINA SMART CITY MARKET, BY UTILITY, 2024–2032 (USD BILLION) 94

TABLE 94 CHINA SMART CITY MARKET, BY TRANSPORT, 2024–2032 (USD BILLION) 94

TABLE 95 CHINA SMART CITY MARKET, BY GOVERNMENT, 2024–2032 (USD BILLION) 95

TABLE 96 CHINA SMART CITY MARKET, BY RESIDENTIAL, 2024–2032 (USD BILLION) 95

TABLE 97 JAPAN SMART CITY MARKET, BY COMPONENT, 2024–2032 (USD BILLION) 95

TABLE 98 JAPAN SMART CITY MARKET, BY SERVICE, 2024–2032 (USD BILLION) 96

TABLE 99 JAPAN SMART CITY MARKET, BY APPLICATION, 2024–2032 (USD BILLION) 96

TABLE 100 JAPAN SMART CITY MARKET, BY UTILITY, 2024–2032 (USD BILLION) 96

TABLE 101 JAPAN SMART CITY MARKET, BY TRANSPORT, 2024–2032 (USD BILLION) 97

TABLE 102 JAPAN SMART CITY MARKET, BY GOVERNMENT, 2024–2032 (USD BILLION) 97

TABLE 103 JAPAN SMART CITY MARKET, BY RESIDENTIAL, 2024–2032 (USD BILLION) 97

TABLE 104 SOUTH KOREA SMART CITY MARKET, BY COMPONENT, 2024–2032 (USD BILLION) 98

TABLE 105 SOUTH KOREA SMART CITY MARKET, BY SERVICE, 2024–2032 (USD BILLION) 98

TABLE 106 SOUTH KOREA SMART CITY MARKET, BY APPLICATION, 2024–2032 (USD BILLION) 98

TABLE 107 SOUTH KOREA SMART CITY MARKET, BY UTILITY, 2024–2032 (USD BILLION) 99

TABLE 108 SOUTH KOREA SMART CITY MARKET, BY TRANSPORT, 2024–2032 (USD BILLION) 99

TABLE 109 SOUTH KOREA SMART CITY MARKET, BY GOVERNMENT, 2024–2032 (USD BILLION) 99

TABLE 110 SOUTH KOREA SMART CITY MARKET, BY RESIDENTIAL, 2024–2032 (USD BILLION) 100

TABLE 111 INDIA SMART CITY MARKET, BY COMPONENT, 2024–2032 (USD BILLION) 100

TABLE 112 INDIA SMART CITY MARKET, BY SERVICE, 2024–2032 (USD BILLION) 100

TABLE 113 INDIA SMART CITY MARKET, BY APPLICATION, 2024–2032 (USD BILLION) 101

TABLE 114 INDIA SMART CITY MARKET, BY UTILITY, 2024–2032 (USD BILLION) 101

TABLE 115 INDIA SMART CITY MARKET, BY TRANSPORT, 2024–2032 (USD BILLION) 101

TABLE 116 INDIA SMART CITY MARKET, BY GOVERNMENT, 2024–2032 (USD BILLION) 102

TABLE 117 INDIA SMART CITY MARKET, BY RESIDENTIAL, 2024–2032 (USD BILLION) 102

TABLE 118 REST OF ASIA-PACIFIC SMART CITY MARKET, BY COMPONENT, 2024–2032 (USD BILLION) 102

TABLE 119 REST OF ASIA-PACIFIC SMART CITY MARKET, BY SERVICE, 2024–2032 (USD BILLION) 103

TABLE 120 REST OF ASIA-PACIFIC SMART CITY MARKET, BY APPLICATION, 2024–2032 (USD BILLION) 103

TABLE 121 REST OF ASIA-PACIFIC SMART CITY MARKET, BY UTILITY, 2024–2032 (USD BILLION) 104

TABLE 122 REST OF ASIA-PACIFIC SMART CITY MARKET, BY TRANSPORT, 2024–2032 (USD BILLION) 104

TABLE 123 REST OF ASIA-PACIFIC SMART CITY MARKET, BY GOVERNMENT, 2024–2032 (USD BILLION) 104

TABLE 124 REST OF ASIA-PACIFIC SMART CITY MARKET, BY RESIDENTIAL, 2024–2032 (USD BILLION) 105

TABLE 125 MIDDLE EAST & AFRICA SMART CITY MARKET, BY COMPONENT, 2024–2032 (USD BILLION) 106

TABLE 126 MIDDLE EAST & AFRICA SMART CITY MARKET, BY SERVICE, 2024–2032 (USD BILLION) 107

TABLE 127 MIDDLE EAST & AFRICA SMART CITY MARKET, BY APPLICATION, 2024–2032 (USD BILLION) 108

TABLE 128 MIDDLE EAST & AFRICA SMART CITY MARKET, BY UTILITY, 2024–2032 (USD BILLION) 108

TABLE 129 MIDDLE EAST & AFRICA SMART CITY MARKET, BY TRANSPORT, 2024–2032 (USD BILLION) 109

TABLE 130 MIDDLE EAST & AFRICA SMART CITY MARKET, BY GOVERNMENT, 2024–2032 (USD BILLION) 109

TABLE 131 MIDDLE EAST & AFRICA SMART CITY MARKET, BY RESIDENTIAL, 2024–2032 (USD BILLION) 109

TABLE 132 SOUTH AMERICA SMART CITY MARKET, BY COMPONENT, 2024–2032 (USD BILLION) 110

TABLE 133 SOUTH AMERICA SMART CITY MARKET, BY SERVICE, 2024–2032 (USD BILLION) 111

TABLE 134 SOUTH AMERICA SMART CITY MARKET, BY APPLICATION, 2024–2032 (USD BILLION) 112

TABLE 135 SOUTH AMERICA SMART CITY MARKET, BY UTILITY, 2024–2032 (USD BILLION) 112

TABLE 136 SOUTH AMERICA SMART CITY MARKET, BY TRANSPORT, 2024–2032 (USD BILLION) 113

TABLE 137 SOUTH AMERICA SMART CITY MARKET, BY GOVERNMENT, 2024–2032 (USD BILLION) 113

TABLE 138 SOUTH AMERICA SMART CITY MARKET, BY RESIDENTIAL, 2024–2032 (USD BILLION) 113

TABLE 139 PRODUCT DEVELOPMENT 116

TABLE 140 ACQUISITIONS/MERGERS/EXPANSION 118

TABLE 141 HONEYWELL INTERNATIONAL INC.: PRODUCT/SERVICES OFFERED 125

TABLE 142 HONEYWELL INTERNATIONAL INC.: KEY DEVELOPMENTS 126

TABLE 143 HUAWEI TECHNOLOGIES CO. LTD : PRODUCT/SERVICES OFFERED 129

TABLE 144 HUAWEI TECHNOLOGIES CO. LTD.: KEY DEVELOPMENTS 130

TABLE 145 SIEMENS AG: PRODUCTS/SERVICES OFFERED 134

TABLE 146 SIEMENS AG: KEY DEVELOPMENTS 136

TABLE 147 CISCO SYSTEMS, INC.: PRODUCT/SERVICES OFFERED 139

TABLE 148 SCHNEIDER ELECTRIC: PRODUCT/SERVICES OFFERED 144

TABLE 149 SCHNEIDER ELECTRIC: KEY DEVELOPMENTS 145

TABLE 150 IBM CORPORATION: PRODUCTS/SERVICES OFFERED 149

TABLE 151 IBM CORPORATION: KEY DEVELOPMENTS 150

TABLE 152 AT&T INC.: PRODUCT/SERVICES OFFERED 152

TABLE 153 AT&T INC.: KEY DEVELOPMENTS 153

TABLE 154 ORACLE: PRODUCTS OFFERED 156

TABLE 155 ORACLE: KEY DEVELOPMENTS 157

TABLE 156 MICROSOFT: PRODUCTS OFFERED 160

TABLE 157 MICROSOFT: KEY DEVELOPMENTS 161

TABLE 158 ABB: PRODUCTS OFFERINGS 164

TABLE 159 ABB: KEY DEVELOPMENTS 165

TABLE 160 SAP SE: PRODUCTS OFFERED 168

TABLE 161 SAP SE: KEY DEVELOPMENTS 169

TABLE 162 HITACHI VANTARA (HITACHI) : PRODUCTS/SOLUTIONS/SERVICES OFFERED 171

TABLE 163 HITACHI VANTARA (HITACHI) : KEY DEVELOPMENTS 172

TABLE 164 TELEFONAKTIEBOLAGET LM ERICSSON: PRODUCTS OFFERED 175

TABLE 165 TELEFONAKTIEBOLAGET LM ERICSSON: KEY DEVELOPMENTS 176

TABLE 166 ITRON INC.: PRODUCTS/SOLUTIONS/SERVICES OFFERED 179

TABLE 167 ITRON INC.: KEY DEVELOPMENTS 180

TABLE 168 TIETOEVRY: PRODUCTS OFFERED 182

TABLE 169 TIETOEVRY: KEY DEVELOPMENTS 183

LIST OF FIGURES

FIGURE 1 MARKET ATTRACTIVENESS ANALYSIS: GLOBAL SMART CITY MARKET 22

FIGURE 2 GLOBAL SMART CITY MARKET: MARKET STRUCTURE 23

FIGURE 3 BOTTOM-UP AND TOP-DOWN APPROACHES 28

FIGURE 4 MARKET DYNAMIC ANALYSIS OF THE GLOBAL SMART CITY MARKET 30

FIGURE 5 DRIVERS IMPACT ANALYSIS: GLOBAL SMART CITY MARKET 33

FIGURE 6 RESTRAINTS IMPACT ANALYSIS: GLOBAL SMART CITY MARKET 37

FIGURE 7 SUPPLY CHAIN: GLOBAL SMART CITY MARKET 43

FIGURE 8 PORTER’S FIVE FORCE ANALYSIS OF THE GLOBAL SMART CITY MARKET 45

FIGURE 9 GLOBAL SMART CITY MARKET, BY COMPONENT, 2022 (% SHARE) 47

FIGURE 10 GLOBAL SMART CITY MARKET, BY COMPONENT, 2022 VS 2032 (USD BILLION) 47

FIGURE 11 GLOBAL SMART CITY MARKET, BY APPLICATION, 2022 (% SHARE) 50

FIGURE 12 GLOBAL SMART CITY MARKET, BY APPLICATION, 2022 VS 2032 (USD BILLION) 50

FIGURE 13 GLOBAL SMART CITY MARKET, BY REGION, 2022 (% SHARE) 56

FIGURE 14 GLOBAL SMART CITY MARKET, BY REGION, 2022 VS 2032 (USD BILLION) 56

FIGURE 15 NORTH AMERICA SMART CITY MARKET, BY COUNTRY, 2022 (% SHARE) 58

FIGURE 16 NORTH AMERICA SMART CITY MARKET, BY COUNTRY, 2022 VS 2032 (USD BILLION) 59

FIGURE 17 NORTH AMERICA SMART CITY MARKET, BY COMPONENT, 2024-2032 (USD BILLION) 60

FIGURE 18 NORTH AMERICA SMART CITY MARKET, BY APPLICATION, 2024-2032 (USD BILLION) 61

FIGURE 19 EUROPE SMART CITY MARKET, BY COUNTRY, 2022 (% SHARE) 71

FIGURE 20 EUROPE SMART CITY MARKET, BY COUNTRY, 2022 VS 2032 (USD BILLION) 72

FIGURE 21 EUROPE SMART CITY MARKET, BY COMPONENT, 2024-2032 (USD BILLION) 73

FIGURE 22 EUROPE SMART CITY MARKET, BY APPLICATION, 2024-2032 (USD BILLION) 74

FIGURE 23 ASIA-PACIFIC SMART CITY MARKET, BY COUNTRY, 2022 (% SHARE) 88

FIGURE 24 ASIA-PACIFIC SMART CITY MARKET, BY COUNTRY, 2022 VS 2032 (USD BILLION) 89

FIGURE 25 ASIA-PACIFIC SMART CITY MARKET, BY COMPONENT, 2024-2032 (USD BILLION) 90

FIGURE 26 ASIA-PACIFIC SMART CITY MARKET, BY APPLICATION, 2024-2032 (USD BILLION) 91

FIGURE 27 MIDDLE EAST & AFRICA SMART CITY MARKET, BY COMPONENT, 2024-2032 (USD BILLION) 106

FIGURE 28 MIDDLE EAST & AFRICA SMART CITY MARKET, BY APPLICATION, 2024-2032 (USD BILLION) 107

FIGURE 29 SOUTH AMERICA SMART CITY MARKET, BY COMPONENT, 2024-2032 (USD BILLION) 110

FIGURE 30 SOUTH AMERICA SMART CITY MARKET, BY APPLICATION, 2024-2032 (USD BILLION) 111

FIGURE 31 GLOBAL SMART CITY MARKET: COMPETITIVE BENCHMARKING 115

FIGURE 32 VENDOR SHARE ANALYSIS (2022, %) 116

FIGURE 33 HONEYWELL INTERNATIONAL INC.: FINANCIAL OVERVIEW SNAPSHOT 124

FIGURE 34 HONEYWELL INTERNATIONAL INC.: SWOT ANALYSIS 127

FIGURE 35 HUAWEI TECHNOLOGIES CO. LTD : FINANCIAL OVERVIEW SNAPSHOT 129

FIGURE 36 HUAWEI TECHNOLOGIES CO. LTD: SWOT ANALYSIS 130

FIGURE 37 SIEMENS AG: FINANCIAL OVERVIEW SNAPSHOT 133

FIGURE 38 SIEMENS AG: SWOT ANALYSIS 137

FIGURE 39 CISCO SYSTEMS, INC.: FINANCIAL OVERVIEW SNAPSHOT 139

FIGURE 40 CISCO SYSTEMS, INC.: SWOT ANALYSIS 141

FIGURE 41 SCHNEIDER ELECTRIC: FINANCIAL OVERVIEW SNAPSHOT 143

FIGURE 42 SCHNEIDER ELECTRIC: SWOT ANALYSIS 146

FIGURE 43 IBM CORPORATION: FINANCIAL OVERVIEW SNAPSHOT 148

FIGURE 44 IBM CORPORATION: SWOT ANALYSIS 150

FIGURE 45 AT&T INC.: FINANCIAL OVERVIEW SNAPSHOT 152

FIGURE 46 AT&T INC.: SWOT ANALYSIS 154

FIGURE 47 ORACLE: FINANCIAL OVERVIEW SNAPSHOT 156

FIGURE 48 ORACLE: SWOT ANALYSIS 157

FIGURE 49 MICROSOFT: FINANCIAL OVERVIEW SNAPSHOT 160

FIGURE 50 MICROSOFT: SWOT ANALYSIS 161

FIGURE 51 ABB: FINANCIAL OVERVIEW SNAPSHOT 164

FIGURE 52 ABB: SWOT ANALYSIS 166

FIGURE 53 SAP SE: FINANCIAL OVERVIEW SNAPSHOT 168

FIGURE 54 SAP SE: SWOT ANALYSIS 169

FIGURE 55 HITACHI VANTARA (HITACHI): FINANCIAL OVERVIEW SNAPSHOT 171

FIGURE 56 HITACHI VANTARA (HITACHI) : SWOT ANALYSIS 173

FIGURE 57 TELEFONAKTIEBOLAGET LM ERICSSON: FINANCIAL OVERVIEW SNAPSHOT 175

FIGURE 58 TELEFONAKTIEBOLAGET LM ERICSSON: SWOT ANALYSIS 177

FIGURE 59 ITRON INC.: FINANCIAL OVERVIEW SNAPSHOT 179

FIGURE 60 ITRON INC.: SWOT ANALYSIS 181

Purchase Option
Single User $ 4,950
Multiuser License $ 5,950
Enterprise User $ 7,250
Compare Licenses
Tailored for You
  • Dedicated Research on any specifics segment or region.
  • Focused Research on specific players in the market.
  • Custom Report based only on your requirements.
  • Flexibility to add or subtract any chapter in the study.
  • Historic data from 2014 and forecasts outlook till 2040.
  • Flexibility of providing data/insights in formats (PDF, PPT, Excel).
  • Provide cross segmentation in applicable scenario/markets.