Request Free Sample ×

Kindly complete the form below to receive a free sample of this Report

* Please use a valid business email

Leading companies partner with us for data-driven Insights

clients tt-cursor
Hero Background

Smart Cards Market

ID: MRFR/SEM/5037-HCR
100 Pages
Nirmit Biswas
Last Updated: April 17, 2026

Smart Cards Market Size, Share and Research Report By Type (Contact, Contactless, Hybrid, Dual-interface), By Component (Hardware, Smart Cards, Readers, Software, Services) and By Application (Government, Healthcare, BFSI, Retail, Transportation, Education, Entertainment, Enterprises) – Forecast to 2035

Share:
Download PDF ×

We do not share your information with anyone. However, we may send you emails based on your report interest from time to time. You may contact us at any time to opt-out.

Smart Cards Market Infographic
Purchase Options
  1. SECTION I: EXECUTIVE SUMMARY AND KEY HIGHLIGHTS
    1. 1.1 EXECUTIVE SUMMARY
      1. 1.1.1 Market Overview
      2. 1.1.2 Key Findings
      3. 1.1.3 Market Segmentation
      4. 1.1.4 Competitive Landscape
      5. 1.1.5 Challenges and Opportunities
      6. 1.1.6 Future Outlook 2
  2. SECTION II: SCOPING, METHODOLOGY AND MARKET STRUCTURE
    1. 2.1 MARKET INTRODUCTION
      1. 2.1.1 Definition
      2. 2.1.2 Scope of the study
        1. 2.1.2.1 Research Objective
        2. 2.1.2.2 Assumption
        3. 2.1.2.3 Limitations
    2. 2.2 RESEARCH METHODOLOGY
      1. 2.2.1 Overview
      2. 2.2.2 Data Mining
      3. 2.2.3 Secondary Research
      4. 2.2.4 Primary Research
        1. 2.2.4.1 Primary Interviews and Information Gathering Process
        2. 2.2.4.2 Breakdown of Primary Respondents
      5. 2.2.5 Forecasting Model
      6. 2.2.6 Market Size Estimation
        1. 2.2.6.1 Bottom-Up Approach
        2. 2.2.6.2 Top-Down Approach
      7. 2.2.7 Data Triangulation
      8. 2.2.8 Validation 3
  3. SECTION III: QUALITATIVE ANALYSIS
    1. 3.1 MARKET DYNAMICS
      1. 3.1.1 Overview
      2. 3.1.2 Drivers
      3. 3.1.3 Restraints
      4. 3.1.4 Opportunities
    2. 3.2 MARKET FACTOR ANALYSIS
      1. 3.2.1 Value chain Analysis
      2. 3.2.2 Porter's Five Forces Analysis
        1. 3.2.2.1 Bargaining Power of Suppliers
        2. 3.2.2.2 Bargaining Power of Buyers
        3. 3.2.2.3 Threat of New Entrants
        4. 3.2.2.4 Threat of Substitutes
        5. 3.2.2.5 Intensity of Rivalry
      3. 3.2.3 COVID-19 Impact Analysis
        1. 3.2.3.1 Market Impact Analysis
        2. 3.2.3.2 Regional Impact
        3. 3.2.3.3 Opportunity and Threat Analysis 4
  4. SECTION IV: QUANTITATIVE ANALYSIS
    1. 4.1 Smart Cards Market, BY Application (USD Billion)
      1. 4.1.1 Payment Cards
      2. 4.1.2 Identification Cards
      3. 4.1.3 Access Control Cards
      4. 4.1.4 SIM Cards
      5. 4.1.5 Transport Cards
    2. 4.2 Smart Cards Market, BY End Use (USD Billion)
      1. 4.2.1 Banking
      2. 4.2.2 Telecommunications
      3. 4.2.3 Government
      4. 4.2.4 Transportation
      5. 4.2.5 Healthcare
    3. 4.3 Smart Cards Market, BY Material Type (USD Billion)
      1. 4.3.1 Polyvinyl Chloride
      2. 4.3.2 Polycarbonate
      3. 4.3.3 PET
      4. 4.3.4 ABS
      5. 4.3.5 Paper
    4. 4.4 Smart Cards Market, BY Technology (USD Billion)
      1. 4.4.1 Contact Smart Cards
      2. 4.4.2 Contactless Smart Cards
      3. 4.4.3 Dual Interface Smart Cards
      4. 4.4.4 Hybrid Smart Cards
    5. 4.5 Smart Cards Market, BY Form Factor (USD Billion)
      1. 4.5.1 Standard Size Cards
      2. 4.5.2 Mini Cards
      3. 4.5.3 Key Fob Cards
      4. 4.5.4 Wearable Cards
    6. 4.6 Smart Cards Market, BY Region (USD Billion)
      1. 4.6.1 North America
        1. 4.6.1.1 US
        2. 4.6.1.2 Canada
      2. 4.6.2 Europe
        1. 4.6.2.1 Germany
        2. 4.6.2.2 UK
        3. 4.6.2.3 France
        4. 4.6.2.4 Russia
        5. 4.6.2.5 Italy
        6. 4.6.2.6 Spain
        7. 4.6.2.7 Rest of Europe
      3. 4.6.3 APAC
        1. 4.6.3.1 China
        2. 4.6.3.2 India
        3. 4.6.3.3 Japan
        4. 4.6.3.4 South Korea
        5. 4.6.3.5 Malaysia
        6. 4.6.3.6 Thailand
        7. 4.6.3.7 Indonesia
        8. 4.6.3.8 Rest of APAC
      4. 4.6.4 South America
        1. 4.6.4.1 Brazil
        2. 4.6.4.2 Mexico
        3. 4.6.4.3 Argentina
        4. 4.6.4.4 Rest of South America
      5. 4.6.5 MEA
        1. 4.6.5.1 GCC Countries
        2. 4.6.5.2 South Africa
        3. 4.6.5.3 Rest of MEA 5
  5. SECTION V: COMPETITIVE ANALYSIS
    1. 5.1 Competitive Landscape
      1. 5.1.1 Overview
      2. 5.1.2 Competitive Analysis
      3. 5.1.3 Market share Analysis
      4. 5.1.4 Major Growth Strategy in the Semiconductor & Electronics
      5. 5.1.5 Competitive Benchmarking
      6. 5.1.6 Leading Players in Terms of Number of Developments in the Semiconductor & Electronics
      7. 5.1.7 Key developments and growth strategies
        1. 5.1.7.1 New Product Launch/Service Deployment
        2. 5.1.7.2 Merger & Acquisitions
        3. 5.1.7.3 Joint Ventures
      8. 5.1.8 Major Players Financial Matrix
        1. 5.1.8.1 Sales and Operating Income
        2. 5.1.8.2 Major Players R&D Expenditure. 2023
    2. 5.2 Company Profiles
      1. 5.2.1 Gemalto (NL)
        1. 5.2.1.1 Financial Overview
        2. 5.2.1.2 Products Offered
        3. 5.2.1.3 Key Developments
        4. 5.2.1.4 SWOT Analysis
        5. 5.2.1.5 Key Strategies
      2. 5.2.2 Giesecke+Devrient (DE)
        1. 5.2.2.1 Financial Overview
        2. 5.2.2.2 Products Offered
        3. 5.2.2.3 Key Developments
        4. 5.2.2.4 SWOT Analysis
        5. 5.2.2.5 Key Strategies
      3. 5.2.3 NXP Semiconductors (NL)
        1. 5.2.3.1 Financial Overview
        2. 5.2.3.2 Products Offered
        3. 5.2.3.3 Key Developments
        4. 5.2.3.4 SWOT Analysis
        5. 5.2.3.5 Key Strategies
      4. 5.2.4 Identiv (US)
        1. 5.2.4.1 Financial Overview
        2. 5.2.4.2 Products Offered
        3. 5.2.4.3 Key Developments
        4. 5.2.4.4 SWOT Analysis
        5. 5.2.4.5 Key Strategies
      5. 5.2.5 CardLogix (US)
        1. 5.2.5.1 Financial Overview
        2. 5.2.5.2 Products Offered
        3. 5.2.5.3 Key Developments
        4. 5.2.5.4 SWOT Analysis
        5. 5.2.5.5 Key Strategies
      6. 5.2.6 Infineon Technologies (DE)
        1. 5.2.6.1 Financial Overview
        2. 5.2.6.2 Products Offered
        3. 5.2.6.3 Key Developments
        4. 5.2.6.4 SWOT Analysis
        5. 5.2.6.5 Key Strategies
      7. 5.2.7 STMicroelectronics (FR)
        1. 5.2.7.1 Financial Overview
        2. 5.2.7.2 Products Offered
        3. 5.2.7.3 Key Developments
        4. 5.2.7.4 SWOT Analysis
        5. 5.2.7.5 Key Strategies
      8. 5.2.8 Mitsubishi Electric (JP)
        1. 5.2.8.1 Financial Overview
        2. 5.2.8.2 Products Offered
        3. 5.2.8.3 Key Developments
        4. 5.2.8.4 SWOT Analysis
        5. 5.2.8.5 Key Strategies
      9. 5.2.9 HID Global (US)
        1. 5.2.9.1 Financial Overview
        2. 5.2.9.2 Products Offered
        3. 5.2.9.3 Key Developments
        4. 5.2.9.4 SWOT Analysis
        5. 5.2.9.5 Key Strategies
    3. 5.3 Appendix
      1. 5.3.1 References
      2. 5.3.2 Related Reports

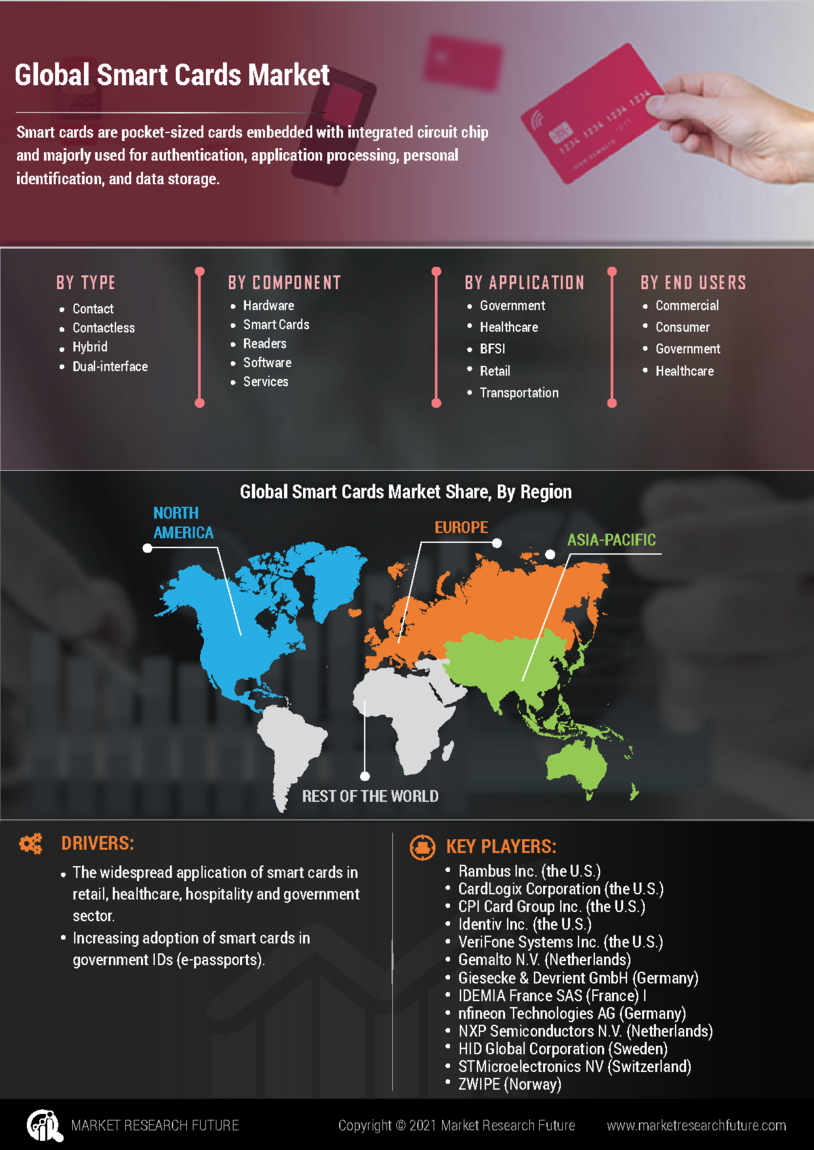
Smart Cards Market Segmentation

Smart Cards Market By Application (USD Billion, 2025-2035)

  • Payment Cards
  • Identification Cards
  • Access Control Cards
  • SIM Cards
  • Transport Cards

Smart Cards Market By End Use (USD Billion, 2025-2035)

  • Banking
  • Telecommunications
  • Government
  • Transportation
  • Healthcare

Smart Cards Market By Material Type (USD Billion, 2025-2035)

  • Polyvinyl Chloride
  • Polycarbonate
  • PET
  • ABS
  • Paper

Smart Cards Market By Technology (USD Billion, 2025-2035)

  • Contact Smart Cards
  • Contactless Smart Cards
  • Dual Interface Smart Cards
  • Hybrid Smart Cards

Smart Cards Market By Form Factor (USD Billion, 2025-2035)

  • Standard Size Cards
  • Mini Cards
  • Key Fob Cards
  • Wearable Cards

Compare Licence

×
Features License Type
Single User Multiuser License Enterprise User
Price $4,950 $5,950 $7,250
Maximum User Access Limit 1 User Upto 10 Users Unrestricted Access Throughout the Organization
Free Customization
Direct Access to Analyst
Deliverable Format
Platform Access
Discount on Next Purchase 10% 15% 15%
Printable Versions