Certified Global Research Member
Isomar fd.webp Wcrc 57.webp
Key Questions Answered
  • Global Market Outlook
  • In-depth analysis of global and regional trends
  • Analyze and identify the major players in the market, their market share, key developments, etc.
  • To understand the capability of the major players based on products offered, financials, and strategies.
  • Identify disrupting products, companies, and trends.
  • To identify opportunities in the market.
  • Analyze the key challenges in the market.
  • Analyze the regional penetration of players, products, and services in the market.
  • Comparison of major playersโ€™ financial performance.
  • Evaluate strategies adopted by major players.
  • Recommendations
Why Choose Market Research Future?
  • Vigorous research methodologies for specific market.
  • Knowledge partners across the globe
  • Large network of partner consultants.
  • Ever-increasing/ Escalating data base with quarterly monitoring of various markets
  • Trusted by fortune 500 companies/startups/ universities/organizations
  • Large database of 5000+ markets reports.
  • Effective and prompt pre- and post-sales support.

Single-Photon Emission Computed Tomography Market Research Report Information By Type (Hybrid SPECT Systems and Standalone SPECT Systems), Application (Oncology, Cardiology, and Neurology), End-User (Hospitals, Diagnostic Imaging Centers), and By Region (North America, Europe, Asia-Pacific, And Rest Of The World) โ€“Market Forecast Till 2032


ID: MRFR/HC/5764-HCR | 90 Pages | Author: Kinjoll Dey| April 2024

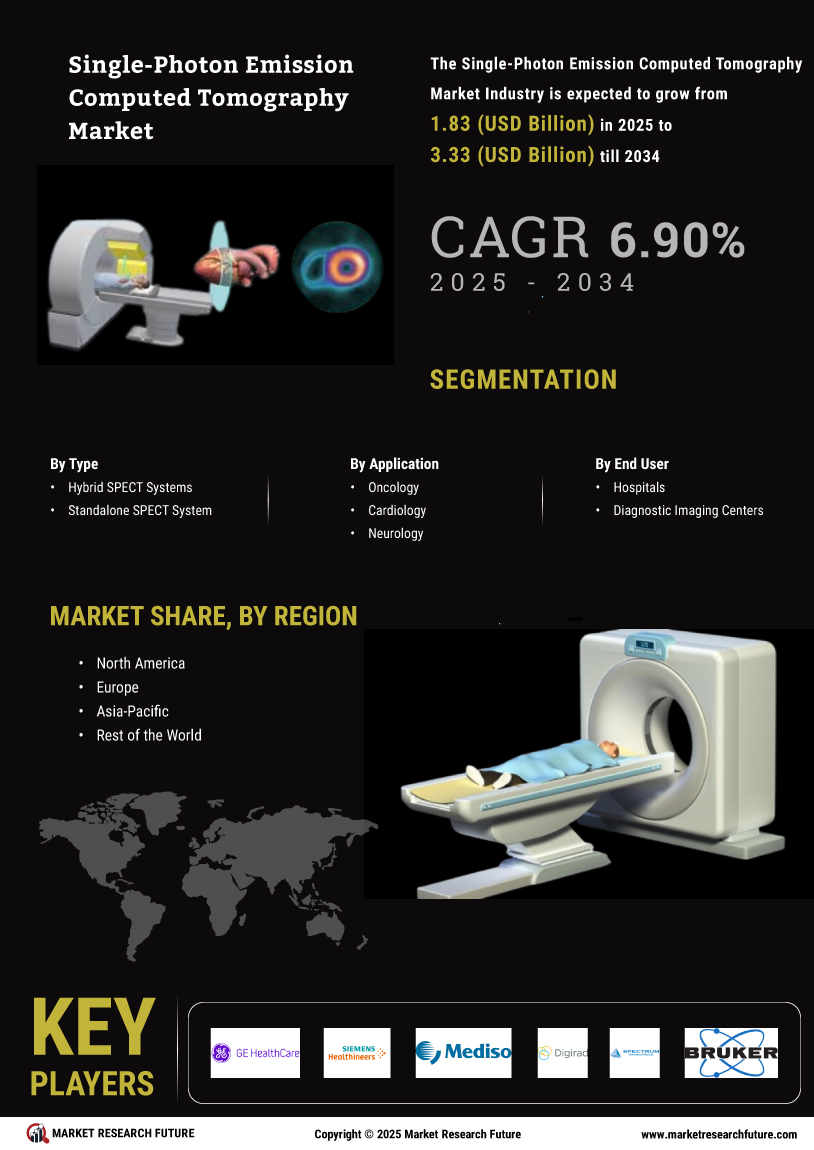
Single-Photon Emission Computed Tomography Market Segmentation


Single-Photon Emission Computed Tomography Type Outlook (USD Billion, 2018-2032)


  • Hybrid SPECT Systems


  • Standalone SPECT System


Single-Photon Emission Computed Tomography Application Outlook (USD Billion, 2018-2032)


  • Oncology


  • Cardiology


  • Neurology


Single-Photon Emission Computed Tomography End-User Outlook (USD Billion, 2018-2032)


  • Hospitals


  • Diagnostic Imaging Centers


Single-Photon Emission Computed Tomography Regional Outlook (USD Billion, 2018-2032)


  • North America Outlook (USD Billion, 2018-2032)


  • North America Single-Photon Emission Computed Tomography by Type


  • Hybrid SPECT Systems


  • Standalone SPECT System


  • North America Single-Photon Emission Computed Tomography by Application


  • Oncology


  • Cardiology


  • Neurology


  • North America Single-Photon Emission Computed Tomography by End-User


  • Hospitals


      • Diagnostic Imaging Centers


    • US Outlook (USD Billion, 2018-2032)


  • US Single-Photon Emission Computed Tomography by Type


  • Hybrid SPECT Systems


  • Standalone SPECT System


  • US Single-Photon Emission Computed Tomography by Application


  • Oncology


  • Cardiology


  • Neurology


  • US Single-Photon Emission Computed Tomography by End-User


  • Hospitals


      • Diagnostic Imaging Centers


    • CANADA Outlook (USD Billion, 2018-2032)


  • CANADA Single-Photon Emission Computed Tomography by Type


  • Hybrid SPECT Systems


  • Standalone SPECT System


  • CANADA Single-Photon Emission Computed Tomography by Application


  • Oncology


  • Cardiology


  • Neurology


  • CANADA Single-Photon Emission Computed Tomography by End-User


  • Hospitals


      • Diagnostic Imaging Centers


  • Europe Outlook (USD Billion, 2018-2032)


  • Europe Single-Photon Emission Computed Tomography by Type


  • Hybrid SPECT Systems


  • Standalone SPECT System


  • Europe Single-Photon Emission Computed Tomography by Application


  • Oncology


  • Cardiology


  • Neurology


  • Europe Single-Photon Emission Computed Tomography by End-User


  • Hospitals


      • Diagnostic Imaging Centers


    • Germany Outlook (USD Billion, 2018-2032)


  • Germany Single-Photon Emission Computed Tomography by Type


  • Hybrid SPECT Systems


  • Standalone SPECT System


  • Germany Single-Photon Emission Computed Tomography by Application


  • Oncology


  • Cardiology


  • Neurology


  • Germany Single-Photon Emission Computed Tomography by End-User


  • Hospitals


      • Diagnostic Imaging Centers


    • France Outlook (USD Billion, 2018-2032)


  • France Single-Photon Emission Computed Tomography by Type


  • Hybrid SPECT Systems


  • Standalone SPECT System


  • France Single-Photon Emission Computed Tomography by Application


  • Oncology


  • Cardiology


  • Neurology


  • France Single-Photon Emission Computed Tomography by End-User


  • Hospitals


      • Diagnostic Imaging Centers


    • UK Outlook (USD Billion, 2018-2032)


  • UK Single-Photon Emission Computed Tomography by Type


  • Hybrid SPECT Systems


  • Standalone SPECT System


  • UK Single-Photon Emission Computed Tomography by Application


  • Oncology


  • Cardiology


  • Neurology


  • UK Single-Photon Emission Computed Tomography by End-User


  • Hospitals


      • Diagnostic Imaging Centers


    • ITALY Outlook (USD Billion, 2018-2032)


  • ITALY Single-Photon Emission Computed Tomography by Type


  • Hybrid SPECT Systems


  • Standalone SPECT System


  • ITALY Single-Photon Emission Computed Tomography by Application


  • Oncology


  • Cardiology


  • Neurology


  • ITALY Single-Photon Emission Computed Tomography by End-User


  • Hospitals


      • Diagnostic Imaging Centers


    • SPAIN Outlook (USD Billion, 2018-2032)


  • SPAIN Single-Photon Emission Computed Tomography by Type


  • Hybrid SPECT Systems


  • Standalone SPECT System


  • SPAIN Single-Photon Emission Computed Tomography by Application


  • Oncology


  • Cardiology


  • Neurology


  • SPAIN Single-Photon Emission Computed Tomography by End-User


  • Hospitals


      • Diagnostic Imaging Centers


    • Rest Of Europe Outlook (USD Billion, 2018-2032)


  • Rest Of Europe Single-Photon Emission Computed Tomography by Type


  • Hybrid SPECT Systems


  • Standalone SPECT System


  • Rest Of Europe Single-Photon Emission Computed Tomography by Application


  • Oncology


  • Cardiology


  • Neurology


  • Rest Of Europe Single-Photon Emission Computed Tomography by End-User


  • Hospitals


      • Diagnostic Imaging Centers


  • Asia-Pacific Outlook (USD Billion, 2018-2032)


  • Asia-Pacific Single-Photon Emission Computed Tomography by Type


  • Hybrid SPECT Systems


  • Standalone SPECT System


  • Asia-Pacific Single-Photon Emission Computed Tomography by Application


  • Oncology


  • Cardiology


  • Neurology


  • Asia-Pacific Single-Photon Emission Computed Tomography by End-User


  • Hospitals


  • Diagnostic Imaging Centers


    • China Outlook (USD Billion, 2018-2032)


  • China Single-Photon Emission Computed Tomography by Type


  • Hybrid SPECT Systems


  • Standalone SPECT System


  • China Single-Photon Emission Computed Tomography by Application


  • Oncology


  • Cardiology


  • Neurology


  • China Single-Photon Emission Computed Tomography by End-User


  • Hospitals


      • Diagnostic Imaging Centers


    • Japan Outlook (USD Billion, 2018-2032)


  • Japan Single-Photon Emission Computed Tomography by Type


  • Hybrid SPECT Systems


  • Standalone SPECT System


  • Japan Single-Photon Emission Computed Tomography by Application


  • Oncology


  • Cardiology


  • Neurology


  • Japan Single-Photon Emission Computed Tomography by End-User


  • Hospitals


      • Diagnostic Imaging Centers


    • India Outlook (USD Billion, 2018-2032)


  • India Single-Photon Emission Computed Tomography by Type


  • Hybrid SPECT Systems


  • Standalone SPECT System


  • India Single-Photon Emission Computed Tomography by Application


  • Oncology


  • Cardiology


  • Neurology


  • India Single-Photon Emission Computed Tomography by End-User


  • Hospitals


      • Diagnostic Imaging Centers


    • Australia Outlook (USD Billion, 2018-2032)


  • Australia Single-Photon Emission Computed Tomography by Type


  • Hybrid SPECT Systems


  • Standalone SPECT System


  • Australia Single-Photon Emission Computed Tomography by Application


  • Oncology


  • Cardiology


  • Neurology


  • Australia Single-Photon Emission Computed Tomography by End-User


  • Hospitals


      • Diagnostic Imaging Centers


    • Rest of Asia-Pacific Outlook (USD Billion, 2018-2032)


  • Rest of Asia-Pacific Single-Photon Emission Computed Tomography by Type


  • Hybrid SPECT Systems


  • Standalone SPECT System


  • Rest of Asia-Pacific Single-Photon Emission Computed Tomography by Application


  • Oncology


  • Cardiology


  • Neurology


  • Rest of Asia-Pacific Single-Photon Emission Computed Tomography by End-User


  • Hospitals


      • Diagnostic Imaging Centers


  • Rest of the World Outlook (USD Billion, 2018-2032)


  • Rest of the World Single-Photon Emission Computed Tomography by Type


  • Hybrid SPECT Systems


  • Standalone SPECT System


  • Rest of the World Single-Photon Emission Computed Tomography by Application


  • Oncology


  • Cardiology


  • Neurology


  • Rest of the World Single-Photon Emission Computed Tomography by End-User


  • Hospitals


      • Diagnostic Imaging Centers


    • Middle East Outlook (USD Billion, 2018-2032)


  • Middle East Single-Photon Emission Computed Tomography by Type


  • Hybrid SPECT Systems


  • Standalone SPECT System


  • Middle East Single-Photon Emission Computed Tomography by Application


  • Oncology


  • Cardiology


  • Neurology


  • Middle East Single-Photon Emission Computed Tomography by End-User


  • Hospitals


      • Diagnostic Imaging Centers


    • Africa Outlook (USD Billion, 2018-2032)


  • Africa Single-Photon Emission Computed Tomography by Type


  • Hybrid SPECT Systems


  • Standalone SPECT System


  • Africa Single-Photon Emission Computed Tomography by Application


  • Oncology


  • Cardiology


  • Neurology


  • Africa Single-Photon Emission Computed Tomography by End-User


  • Hospitals


      • Diagnostic Imaging Centers


    • Latin America Outlook (USD Billion, 2018-2032)


  • Latin America Single-Photon Emission Computed Tomography by Type


  • Hybrid SPECT Systems


  • Standalone SPECT System


  • Latin America Single-Photon Emission Computed Tomography by Application


  • Oncology


  • Cardiology


  • Neurology


  • Latin America Single-Photon Emission Computed Tomography by End-User


  • Hospitals


      • Diagnostic Imaging Centers


Leading companies partner with us for data-driven Insights
client_1 client_2 client_3 client_4 client_5 client_6 client_7 client_8 client_9 client_10
Please fill in Business Email for Quick Response

TABLE OF CONTENT

Chapter 1. Report Prologue

Chapter 2. Market Introduction

2.1 Definition

2.2 Scope of the Study

2.2.1 Research Objective

2.2.2 Assumptions

2.2.3 Limitations

Chapter 3. Research Methodology

3.1 Introduction

3.2 Primary Research

3.3 Secondary Research

3.4 Market Size Estimation

Chapter 4. Market Dynamics

4.1 Drivers

4.2 Restraints

4.3 Opportunities

Chapter 5. Market Factor Analysis

5.1 Porterโ€™s Five Forces Analysis

5.1.1 Bargaining Power of Suppliers

5.1.2 Bargaining Power of Buyers

5.1.3 Threat of New Entrants

5.1.4 Threat of Substitutes

5.1.5 Intensity of Rivalry

5.2 Value Chain Analysis

Chapter 6. Global Single-Photon Emission Computed Tomography (SPECT) Market, by Type

6.1 Introduction

6.2 Hybrid SPECT Systems

6.3 Standalone SPECT Systems

Chapter 7. Global Single-Photon Emission Computed Tomography (SPECT) Market, by Application

7.1 Introduction

7.2 Oncology

7.3 Cardiology

7.4 Neurology

7.5 Others

Chapter 8. Global Single-Photon Emission Computed Tomography (SPECT) Market, by End User

8.1 Introduction

8.2 Hospitals

8.3 Diagnostic Imaging Centers

8.4 Academic & Research Centers

8.5 Others

Chapter 9. Global Single-Photon Emission Computed Tomography (SPECT) Market, by Region

9.1 Introduction

9.2 America

9.2.1 North America

9.2.1.1 US

9.2.1.2 Canada

9.2.2 South America

9.3 Europe

9.3.1 Western Europe

9.3.1.1 Germany

9.3.1.2 UK

9.3.1.3 Italy

9.3.1.4 France

9.3.1.5 Spain

9.3.1.6 Rest of Western Europe

9.3.2 Eastern Europe

9.4 Asia-Pacific

9.4.1 Japan

9.4.2 China

9.4.3 India

9.4.4 Australia

9.4.5 Republic of Korea

9.4.6 Rest of Asia-Pacific

9.5 Middle East & Africa

9.5.1 The Middle East

9.5.2 Africa

Chapter 10. Company Landscape

10.1 Introduction

10.2 Market Share Analysis

10.3 Key Development & Strategies

Chapter 11 Company Profiles

11.1 Koninklijke Philips N.V (The Netherlands)

11.1.1 Company Overview

11.1.2 Type Overview

11.1.3 Financials

11.2.4 Key Developments

11.1.5 SWOT Analysis

11.2 Siemens (Germany)

11.2.1 Company Overview

11.2.2 Type Overview

11.2.3 Financial Overview

11.2.4 Key Developments

11.2.5 SWOT Analysis

11.3 Positron Corporation (U.S)

11.3.1 Company Overview

11.3.2 Type Overview

11.3.3 Financial Overview

11.3.4 Key Development

11.3.5 SWOT Analysis

11.4 Neusoft Medical Systems

11.4.1 Company Overview

11.4.2 Type/Business Segment Overview

11.4.3 Financial Overview

11.4.4 Key Development

11.4.5 SWOT Analysis

11.5 Digirad Corporation

11.5.1 Company Overview

11.5.2 Type Overview

11.5.3 Financial overview

11.5.4 Key Developments

11.5.5 SWOT Analysis

11.6 Gamma Medica Inc.

11.6.1 Company Overview

11.6.2 Type Overview

11.6.3 Financial Overview

11.6.4 Key Developments

11.6.5 SWOT Analysis

11.7 GE Healthcare

11.7.1 Overview

11.7.2 Type Overview

11.7.3 Financials

11.7.4 Key Developments

11.7.5 SWOT Analysis

11.8 Oncovision

11.8.1 Overview

11.8.2 Type Overview

11.8.3 Financials

11.8.4 Key Developments

11.8.5 SWOT Analysis

11.9 Bruker Corporation

11.9.1 Overview

11.9.2 Type Overview

11.9.3 Financials

11.9.4 Key Developments

11.9.5 SWOT Analysis

11.10 Mediso Ltd.

11.10.1 Overview

11.10.2 Type Overview

11.10.3 Financials

11.10.4 Key Developments

11.10.5 SWOT Analysis

11.11 Others.

Chapter 12 Appendix

LIST OF TABLES

TABLE 1 GLOBAL SINGLE-PHOTON EMISSION COMPUTED TOMOGRAPHY (SPECT) MARKET INDUSTRY SYNOPSIS, 2023-2032

TABLE 2 GLOBAL SINGLE-PHOTON EMISSION COMPUTED TOMOGRAPHY (SPECT) MARKET ESTIMATES & FORECAST, 2023-2032, (USD MILLION)

TABLE 3 GLOBAL SINGLE-PHOTON EMISSION COMPUTED TOMOGRAPHY (SPECT) MARKET, BY REGION, 2023-2032, (USD MILLION)

TABLE 4 GLOBAL SINGLE-PHOTON EMISSION COMPUTED TOMOGRAPHY (SPECT) MARKET, BY TYPE, 2023-2032, (USD MILLION)

TABLE 5 GLOBAL SINGLE-PHOTON EMISSION COMPUTED TOMOGRAPHY (SPECT) MARKET, BY APPLICATION, 2023-2032, (USD MILLION)

TABLE 6 GLOBAL SINGLE-PHOTON EMISSION COMPUTED TOMOGRAPHY (SPECT) MARKET, BY END USER, 2023-2032, (USD MILLION)

TABLE 7 NORTH AMERICA: SINGLE-PHOTON EMISSION COMPUTED TOMOGRAPHY (SPECT) MARKET, BY TYPE, 2023-2032, (USD MILLION)

TABLE 8 NORTH AMERICA: SINGLE-PHOTON EMISSION COMPUTED TOMOGRAPHY (SPECT) MARKET, BY APPLICATION, 2023-2032, (USD MILLION)

TABLE 9 NORTH AMERICA: SINGLE-PHOTON EMISSION COMPUTED TOMOGRAPHY (SPECT) MARKET, BY END USER, 2023-2032, (USD MILLION)

TABLE 10 US: SINGLE-PHOTON EMISSION COMPUTED TOMOGRAPHY (SPECT) MARKET, BY TYPE, 2023-2032, (USD MILLION)

TABLE 11 US: SINGLE-PHOTON EMISSION COMPUTED TOMOGRAPHY (SPECT) MARKET, BY APPLICATION, 2023-2032, (USD MILLION)

TABLE 12 US: SINGLE-PHOTON EMISSION COMPUTED TOMOGRAPHY (SPECT) MARKET, BY END USER, 2023-2032, (USD MILLION)

TABLE 13 CANADA: SINGLE-PHOTON EMISSION COMPUTED TOMOGRAPHY (SPECT) MARKET, BY TYPE, 2023-2032, (USD MILLION)

TABLE 14 CANADA: SINGLE-PHOTON EMISSION COMPUTED TOMOGRAPHY (SPECT) MARKET, BY APPLICATION, 2023-2032, (USD MILLION)

TABLE 15 CANADA: SINGLE-PHOTON EMISSION COMPUTED TOMOGRAPHY (SPECT) MARKET, BY END USER, 2023-2032, (USD MILLION)

TABLE 16 SOUTH AMERICA: SINGLE-PHOTON EMISSION COMPUTED TOMOGRAPHY (SPECT) MARKET, BY TYPE, 2023-2032, (USD MILLION)

TABLE 17 SOUTH AMERICA: SINGLE-PHOTON EMISSION COMPUTED TOMOGRAPHY (SPECT) MARKET, BY APPLICATION, 2023-2032, (USD MILLION)

TABLE 18 SOUTH AMERICA: SINGLE-PHOTON EMISSION COMPUTED TOMOGRAPHY (SPECT) MARKET, BY END USER, 2023-2032, (USD MILLION)

TABLE 19 EUROPE: SINGLE-PHOTON EMISSION COMPUTED TOMOGRAPHY (SPECT) MARKET, TYPE, 2023-2032, (USD MILLION)

TABLE 20 EUROPE: SINGLE-PHOTON EMISSION COMPUTED TOMOGRAPHY (SPECT) MARKET, APPLICATION, 2023-2032, (USD MILLION)

TABLE 21 EUROPE: SINGLE-PHOTON EMISSION COMPUTED TOMOGRAPHY (SPECT) MARKET, BY END USER, 2023-2032, (USD MILLION)

TABLE 22 WESTERN EUROPE: SINGLE-PHOTON EMISSION COMPUTED TOMOGRAPHY (SPECT) MARKET, BY TYPE, 2023-2032, (USD MILLION)

TABLE 23 WESTERN EUROPE: SINGLE-PHOTON EMISSION COMPUTED TOMOGRAPHY (SPECT) MARKET, BY APPLICATION, 2023-2032, (USD MILLION)

TABLE 24 WESTERN EUROPE: SINGLE-PHOTON EMISSION COMPUTED TOMOGRAPHY (SPECT) MARKET, BY END USER, 2023-2032, (USD MILLION)

TABLE 25 EASTERN EUROPE: SINGLE-PHOTON EMISSION COMPUTED TOMOGRAPHY (SPECT) MARKET, BY TYPE, 2023-2032, (USD MILLION)

TABLE 26 EASTERN EUROPE: SINGLE-PHOTON EMISSION COMPUTED TOMOGRAPHY (SPECT) MARKET, BY APPLICATION, 2023-2032, (USD MILLION)

TABLE 27 EASTERN EUROPE: SINGLE-PHOTON EMISSION COMPUTED TOMOGRAPHY (SPECT) MARKET, BY END USER, 2023-2032, (USD MILLION)

TABLE 28 ASIA-PACIFIC: SINGLE-PHOTON EMISSION COMPUTED TOMOGRAPHY (SPECT) MARKET, BY TYPE, 2023-2032, (USD MILLION)

TABLE 29 ASIA-PACIFIC: SINGLE-PHOTON EMISSION COMPUTED TOMOGRAPHY (SPECT) MARKET, BY APPLICATION, 2023-2032, (USD MILLION)

TABLE 30 ASIA-PACIFIC: SINGLE-PHOTON EMISSION COMPUTED TOMOGRAPHY (SPECT) MARKET, BY END USER, 2023-2032, (USD MILLION)

TABLE 31 MIDDLE EAST & AFRICA: SINGLE-PHOTON EMISSION COMPUTED TOMOGRAPHY (SPECT) MARKET, BY TYPE, 2023-2032, (USD MILLION)

TABLE 32 MIDDLE EAST & AFRICA: SINGLE-PHOTON EMISSION COMPUTED TOMOGRAPHY (SPECT) MARKET, BY APPLICATION, 2023-2032, (USD MILLION)

TABLE 33 MIDDLE EAST & AFRICA: SINGLE-PHOTON EMISSION COMPUTED TOMOGRAPHY (SPECT) MARKET, BY END USER, 2023-2032, (USD MILLION)

LIST OF FIGURES

FIGURE 1 RESEARCH PROCESS

FIGURE 2 SEGMENTATION FOR THE GLOBAL SINGLE-PHOTON EMISSION COMPUTED TOMOGRAPHY (SPECT) MARKET

FIGURE 3 MARKET DYNAMICS FOR THE GLOBAL SINGLE-PHOTON EMISSION COMPUTED TOMOGRAPHY (SPECT) MARKET

FIGURE 4 GLOBAL SINGLE-PHOTON EMISSION COMPUTED TOMOGRAPHY (SPECT) MARKET SHARE, BY TYPE 2020

FIGURE 5 GLOBAL SINGLE-PHOTON EMISSION COMPUTED TOMOGRAPHY (SPECT) MARKET SHARE, BY APPLICATION 2020

FIGURE 6 GLOBAL SINGLE-PHOTON EMISSION COMPUTED TOMOGRAPHY (SPECT) MARKET SHARE, BY END USER, 2020

FIGURE 7 GLOBAL SINGLE-PHOTON EMISSION COMPUTED TOMOGRAPHY (SPECT) MARKET SHARE, BY REGION, 2020

FIGURE 8 NORTH AMERICA SINGLE-PHOTON EMISSION COMPUTED TOMOGRAPHY (SPECT) MARKET SHARE, BY COUNTRY, 2020

FIGURE 9 EUROPE PRESCRIBED HEALTH APPS SHARE, BY COUNTRY, 2020

FIGURE 10 ASIA-PACIFIC SINGLE-PHOTON EMISSION COMPUTED TOMOGRAPHY (SPECT) MARKET SHARE, BY COUNTRY, 2020

FIGURE 11 MIDDLE EAST & AFRICA SINGLE-PHOTON EMISSION COMPUTED TOMOGRAPHY (SPECT) MARKET SHARE, BY COUNTRY, 2020

FIGURE 12 GLOBAL SINGLE-PHOTON EMISSION COMPUTED TOMOGRAPHY (SPECT) MARKET: COMPANY SHARE ANALYSIS, 2020 (%)

FIGURE 13 KONINKLIJKE PHILIPS N.V.: KEY FINANCIALS

FIGURE 14 KONINKLIJKE PHILIPS N.V.: SEGMENTAL REVENUE

FIGURE 15 KONINKLIJKE PHILIPS N.V: GEOGRAPHICAL REVENUE

FIGURE 16 SIEMENS.: KEY FINANCIALS

FIGURE 17 SIEMENS.: SEGMENTAL REVENUE

FIGURE 18 SIEMENS.: GEOGRAPHICAL REVENUE

FIGURE 19 POSITRON CORPORATION.: KEY FINANCIALS

FIGURE 20 POSITRON CORPORATION.: SEGMENTAL REVENUE

FIGURE 21 POSITRON CORPORATION.: GEOGRAPHICAL REVENUE

FIGURE 22 NEUSOFT MEDICAL SYSTEMS: KEY FINANCIALS

FIGURE 23 NEUSOFT MEDICAL SYSTEMS: SEGMENTAL REVENUE

FIGURE 24 NEUSOFT MEDICAL SYSTEMS: GEOGRAPHICAL REVENUE

FIGURE 25 DIGIRAD CORPORATION.: KEY FINANCIALS

FIGURE 26 DIGIRAD CORPORATION.: SEGMENTAL REVENUE

FIGURE 27 DIGIRAD CORPORATION.: GEOGRAPHICAL REVENUE

FIGURE 28 GAMMA MEDICA INC.: KEY FINANCIALS

FIGURE 29 GAMMA MEDICA INC.: SEGMENTAL REVENUE

FIGURE 30 GAMMA MEDICA INC.: GEOGRAPHICAL REVENUE

FIGURE 31 MEDTRONIC PLC : KEY FINANCIALS

FIGURE 32 MEDTRONIC PLC: SEGMENTAL REVENUE

FIGURE 33 MEDTRONIC PLC : GEOGRAPHICAL REVENUE

Purchase Option
Single User $ 4,950
Multiuser License $ 5,950
Enterprise User $ 7,250
Compare Licenses
Tailored for You
  • Dedicated Research on any specifics segment or region.
  • Focused Research on specific players in the market.
  • Custom Report based only on your requirements.
  • Flexibility to add or subtract any chapter in the study.
  • Historic data from 2014 and forecasts outlook till 2040.
  • Flexibility of providing data/insights in formats (PDF, PPT, Excel).
  • Provide cross segmentation in applicable scenario/markets.