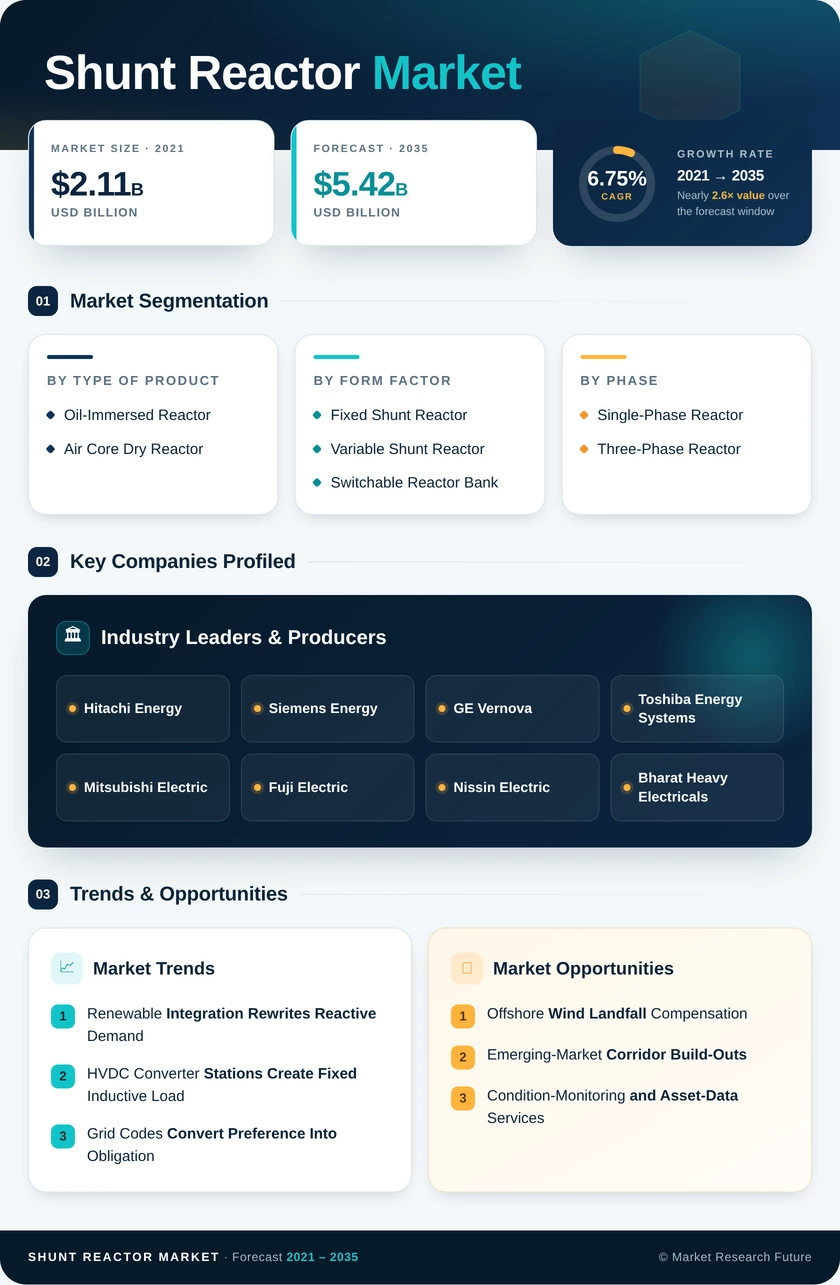
Shunt Reactor Market (2026 - 2035)

ID: MRFR/EnP/0643-CR 111 Pages Anshula Mandaokar Last Updated: October 16, 2026
Shunt Reactor Market Research Report By Type of Product (Oil-Immersed Reactor, Air Core Dry Reactor), By Form Factor (Fixed Shunt Reactor, Variable Shunt Reactor, Switchable Reactor Bank), By Phase (Single-Phase Reactor, Three-Phase Reactor), By Rated Voltage (Less Than 200 kV, 200–400 kV, Above 400 kV), By End-User (Transmission Utilities, Renewable Developers, Industrial and Others) - Forecast to 2035
Shunt Reactor Market
Market Size
Forecast Period2026-2035
CAGR (2026-2035)6.75%
2025 Market SizeUSD 2.83 Billion
2035 Market SizeUSD 5.42 Billion
Key Players
Hitachi Energy
Siemens Energy
GE Vernova
Toshiba Energy Systems
Mitsubishi Electric
Fuji Electric
Opportunities
  • Offshore Wind Landfall Compensation
  • Emerging-Market Corridor Build-Outs
  • Condition-Monitoring and Asset-Data Services
  1. 1 Market Summary | |
    1. 1.1 Study Assumptions & Market Definition | |
    2. 1.2 Scope of the Study | |
    3. 1.3 Research Methodology | |
  2. 2 Key Report Takeaways | |
    1. 2.1 By Product Type | |
    2. 2.2 By Form Factor | |
    3. 2.3 By End User | |
    4. 2.4 By Region | |
  3. 3 Market Size & Forecast (2021–2035) | |
    1. 3.1 Historical Market Size (2021–2025) | |
    2. 3.2 Current & Forecast Market Size (2026–2035) | |
    3. 3.3 Year-over-Year Growth Analysis | |
  4. 4 Driver Impact Analysis | |
    1. 4.1 Renewable Integration Rewrites Reactive Demand | |
    2. 4.2 HVDC Converter Stations Create Fixed Inductive Load | |
    3. 4.3 Grid Codes Convert Preference Into Obligation | |
    4. 4.4 Replacement Economics Favour New Purchases Over Refurbishment | |
  5. 5 Restraints Impact Analysis | |
    1. 5.1 Core Steel Supply Sets the Production Ceiling | |
    2. 5.2 Lead Times Push Projects Out of the Forecast Window | |
    3. 5.3 Power-Electronic Alternatives Compete at the Margin | |
  6. 6 Opportunities | |
    1. 6.1 Offshore Wind Landfall Compensation | |
    2. 6.2 Emerging-Market Corridor Build-Outs | |
    3. 6.3 Condition-Monitoring and Asset-Data Services | |
    4. 6.4 Dry-Type Substitution in Urban and Indoor Substations | |
    5. 6.5 Retrofit Packages for Ageing Fleets | |
  7. 7 Regional Market Share & Country-Level Analysis | |
    1. 7.1 North America | | |
      1. 7.1.1 US | | |
      2. 7.1.2 Canada | | |
      3. 7.1.3 Mexico | |
    2. 7.2 Europe | | |
      1. 7.2.1 Germany | | |
      2. 7.2.2 UK | | |
      3. 7.2.3 France | | |
      4. 7.2.4 Italy | | |
      5. 7.2.5 Spain | | |
      6. 7.2.6 Nordic Countries | | |
      7. 7.2.7 Russia | | |
      8. 7.2.8 Rest of Europe | |
    3. 7.3 Asia-Pacific | | |
      1. 7.3.1 China | | |
      2. 7.3.2 India | | |
      3. 7.3.3 Japan | | |
      4. 7.3.4 South Korea | | |
      5. 7.3.5 ASEAN | | |
      6. 7.3.6 Rest of Asia-Pacific | |
    4. 7.4 South America | | |
      1. 7.4.1 Brazil | | |
      2. 7.4.2 Argentina | | |
      3. 7.4.3 Rest of South America | |
    5. 7.5 Middle East & Africa | | |
      1. 7.5.1 Saudi Arabia | | |
      2. 7.5.2 UAE | | |
      3. 7.5.3 South Africa | | |
      4. 7.5.4 Egypt | | |
      5. 7.5.5 Rest of Middle East & Africa | |
  8. 8 Future Outlook (2026–2035) | |
    1. 8.1 Digital Substations and Autonomous Voltage Control | |
    2. 8.2 The Electrification Supercycle | |
    3. 8.3 Sustainability Reporting Reshapes Specifications | |
    4. 8.4 Supply-Chain Regionalisation | |
  9. 9 Segmentation Analysis | |
    1. 9.1 By Type of Product | | |
      1. 9.1.1 Oil-Immersed Reactor | | |
      2. 9.1.2 Air Core Dry Reactor | |
    2. 9.2 By Form Factor | | |
      1. 9.2.1 Fixed Shunt Reactor | | |
      2. 9.2.2 Variable Shunt Reactor | | |
      3. 9.2.3 Switchable Reactor Bank | |
    3. 9.3 By Phase | | |
      1. 9.3.1 Single-Phase Reactor | | |
      2. 9.3.2 Three-Phase Reactor | |
    4. 9.4 By Rated Voltage | | |
      1. 9.4.1 Less Than 200 kV | | |
      2. 9.4.2 200–400 kV | | |
      3. 9.4.3 Above 400 kV | |
    5. 9.5 By End-User | | |
      1. 9.5.1 Transmission Utilities | | |
      2. 9.5.2 Renewable Developers | | |
      3. 9.5.3 Industrial and Others | |
  10. 10 Competitive Landscape | |
    1. 10.1 Market Share Analysis (2026) | |
    2. 10.2 Competitive Benchmarking Matrix | |
    3. 10.3 Company Profiles | |
  11. 11 Recent News & Developments | |
  12. 12 Report Scope & Methodology | |
  13. 13 Detailed Sources & Citations | |
  14. 14 Frequently Asked Questions | | LIST OF TABLES | |
  15. TABLE 1 Global Shunt Reactor Market Size & Forecast, by Revenue (USD Billion), 2021–2035 | |
  16. TABLE 2 Global Shunt Reactor Market – Year-over-Year Growth Analysis, 2021–2035 | |
  17. TABLE 3 Driver Impact Analysis Matrix, 2026–2035 | |
  18. TABLE 4 Restraint Impact Analysis Matrix, 2026–2035 | |
  19. TABLE 5 Global Shunt Reactor Market Size, by Region, 2021–2035 (USD Billion) | |
  20. TABLE 6 North America Shunt Reactor Market Size, by Country, 2021–2035 (USD Billion) | |
  21. TABLE 7 Europe Shunt Reactor Market Size, by Country, 2021–2035 (USD Billion) | |
  22. TABLE 8 Asia-Pacific Shunt Reactor Market Size, by Country, 2021–2035 (USD Billion) | |
  23. TABLE 9 South America Shunt Reactor Market Size, by Country, 2021–2035 (USD Billion) | |
  24. TABLE 10 Middle East & Africa Shunt Reactor Market Size, by Country, 2021–2035 (USD Billion) | |
  25. TABLE 11 Global Shunt Reactor Market Size, by Type of Product, 2021–2035 (USD Billion) | |
  26. TABLE 12 Global Shunt Reactor Market Size, by Form Factor, 2021–2035 (USD Billion) | |
  27. TABLE 13 Global Shunt Reactor Market Size, by Phase, 2021–2035 (USD Billion) | |
  28. TABLE 14 Global Shunt Reactor Market Size, by Rated Voltage, 2021–2035 (USD Billion) | |
  29. TABLE 15 Global Shunt Reactor Market Size, by End-User, 2021–2035 (USD Billion) | |
  30. TABLE 16 Competitive Benchmarking Matrix – Global Shunt Reactor Market, 2026 | |
  31. TABLE 17 Company Profiles – Key Players, Global Shunt Reactor Market | |
  32. TABLE 18 Recent Developments & Strategic Announcements, 2023–2025 | |
  33. TABLE 19 Report Scope & Methodology Summary | |
  34. TABLE 20 Detailed Sources & Citations Index | |
  35. TABLE 21 North America Shunt Reactor Market Size, by Type of Product, 2021–2035 (USD Billion) | |
  36. TABLE 22 North America Shunt Reactor Market Size, by End-User, 2021–2035 (USD Billion) | |
  37. TABLE 23 Europe Shunt Reactor Market Size, by Type of Product, 2021–2035 (USD Billion) | |
  38. TABLE 24 Europe Shunt Reactor Market Size, by Rated Voltage, 2021–2035 (USD Billion) | |
  39. TABLE 25 Asia-Pacific Shunt Reactor Market Size, by Form Factor, 2021–2035 (USD Billion) | |
  40. TABLE 26 Asia-Pacific Shunt Reactor Market Size, by End-User, 2021–2035 (USD Billion) | |
  41. TABLE 27 South America Shunt Reactor Market Size, by Type of Product, 2021–2035 (USD Billion) | |
  42. TABLE 28 Middle East & Africa Shunt Reactor Market Size, by Rated Voltage, 2021–2035 (USD Billion) | | LIST OF FIGURES | |
  43. FIGURE 1 Market Dynamics – Drivers, Restraints and Opportunities Overview | |
  44. FIGURE 2 Industry Value Chain Analysis – Shunt Reactor Market | |
  45. FIGURE 3 Porter's Five Forces Analysis – Shunt Reactor Market | |
  46. FIGURE 4 Global Market Size Trend and Forecast, 2021–2035 (USD Billion) | |
  47. FIGURE 5 Year-over-Year Growth Trajectory, 2022–2035 (%) | |
  48. FIGURE 6 Market Share by Type of Product, 2025 vs 2035 (%) | |
  49. FIGURE 7 Market Share by Form Factor, 2025 vs 2035 (%) | |
  50. FIGURE 8 Market Share by Phase, 2025 (%) | |
  51. FIGURE 9 Market Share by Rated Voltage, 2025 vs 2035 (%) | |
  52. FIGURE 10 Market Share by End-User, 2025 (%) | |
  53. FIGURE 11 Regional Revenue Share Distribution, 2025 (%) | |
  54. FIGURE 12 Regional CAGR Comparison, 2026–2035 (%) | |
  55. FIGURE 13 Country-Level Revenue Contribution – Top Ten Markets, 2025 | |
  56. FIGURE 14 Competitive Landscape – Estimated Revenue Share Bands, 2026 | |
  57. FIGURE 15 Strategic Positioning Matrix – Key Players | |
  58. FIGURE 16 Technology Adoption Curve – Oil-Immersed vs Air Core Dry | |
  59. FIGURE 17 Future Outlook Scenarios, 2026–2035

Segmentation Quick Reference

DimensionSub-SegmentsDominant SegmentFastest Growing Segment
Type of ProductOil-Immersed Reactor; Air Core Dry ReactorOil-Immersed ReactorAir Core Dry Reactor
Form FactorFixed Shunt Reactor; Variable Shunt Reactor; Switchable Reactor BankFixed Shunt ReactorVariable Shunt Reactor
PhaseSingle-Phase Reactor; Three-Phase ReactorThree-Phase ReactorSingle-Phase Reactor
Rated VoltageLess Than 200 kV; 200–400 kV; Above 400 kV200–400 kVAbove 400 kV
End-UserTransmission Utilities; Renewable Developers; Industrial and OthersTransmission UtilitiesRenewable Developers
GeographyNorth America; Europe; Asia-Pacific; South America; Middle East & AfricaAsia-PacificAsia-Pacific


Market Segmentation Overview

By Type of Product

Sub-SegmentKey Trend
Oil-Immersed ReactorEster-fluid substitution for mineral oil at fire-sensitive sites
Air Core Dry ReactorVoltage ceilings rising as insulation systems improve


Insulation medium is becoming a site-driven decision rather than a purely electrical one. Buyers increasingly evaluate spill containment cost, fire code exposure, and disposal liability alongside loss and impedance parameters.

By Form Factor

Sub-SegmentKey Trend
Fixed Shunt ReactorStandardised designs shortening delivery on repeat corridor orders
Variable Shunt ReactorTap-changer reliability improvements widening addressable duty
Switchable Reactor BankCircuit-breaker duty ratings rising with automated switching


Flexibility commands a premium. As generation profiles swing harder across the day, equipment that adjusts its own reactance avoids both overvoltage at light load and the mechanical wear of frequent switching.

By Phase

Sub-SegmentKey Trend
Single-Phase ReactorPreferred where transport weight limits constrain shipping
Three-Phase ReactorFavoured for compact substation footprints and lower total cost


Phase configuration is largely a logistics and sparing decision. Utilities operating remote corridors increasingly accept the higher footprint of single-phase banks in exchange for practical spare-unit strategies.

By Rated Voltage

Sub-SegmentKey Trend
Less Than 200 kVIndustrial and sub-transmission retrofit demand
200–400 kVBackbone replacement cycle sustaining volume
Above 400 kVUHV and HVDC terminal build-out driving fastest growth


Voltage class maps directly to project type. The highest tiers grow fastest because that is where new intercontinental and inter-provincial corridors are being built.

By End-User

Sub-SegmentKey Trend
Transmission UtilitiesRegulated capital plans providing predictable order flow
Renewable DevelopersInterconnection obligations shifting equipment cost to generators
Industrial and OthersLarge captive loads and data centres adding voltage-regulation needs


Buyer composition is diversifying. What was once a utility-only procurement category now includes independent power producers and, increasingly, hyperscale data-centre operators managing their own grid interfaces.




Download PDF ×

We do not share your information with anyone. However, we may send you emails based on your report interest from time to time. You may contact us at any time to opt-out.