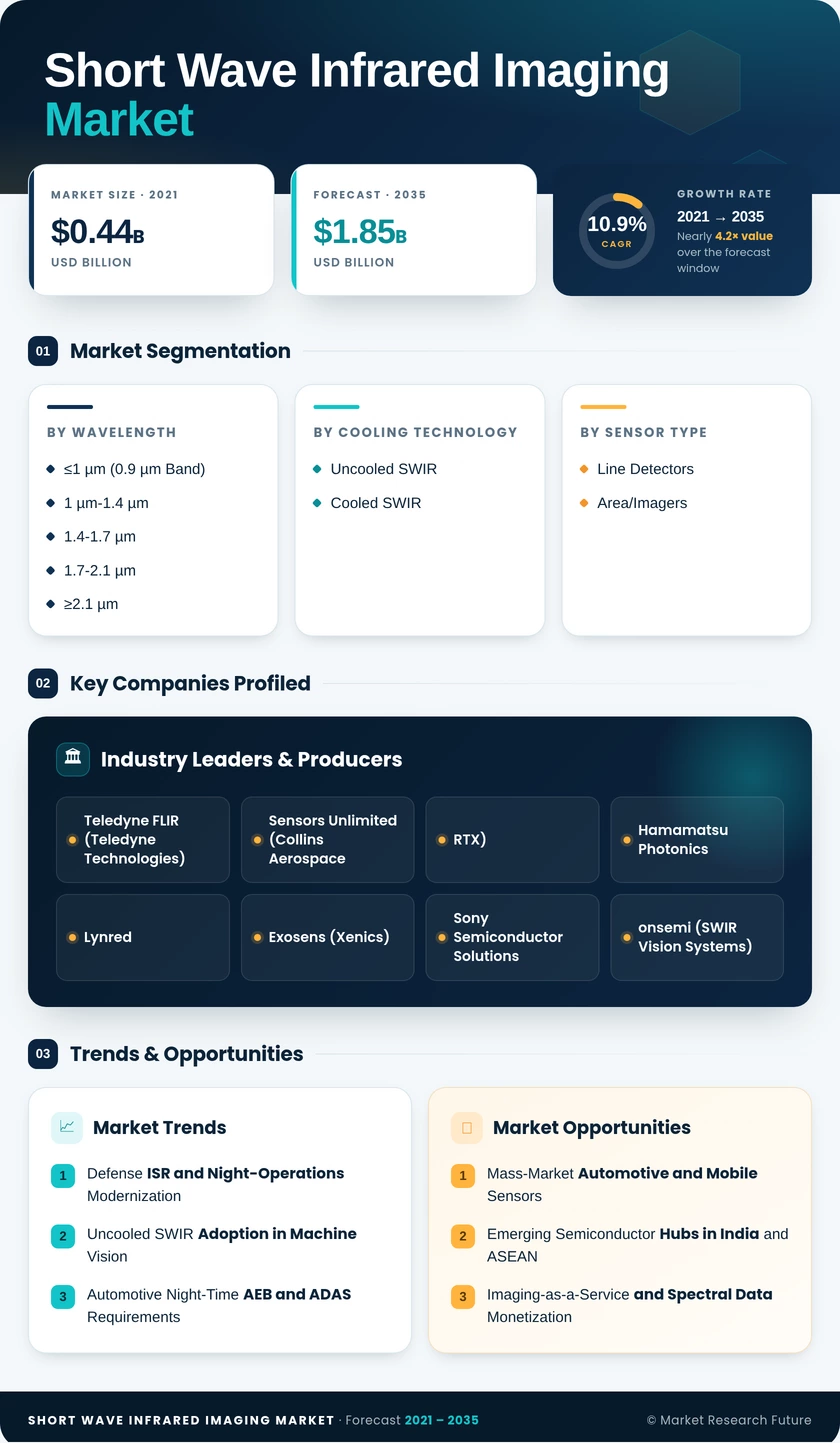
Short Wave Infrared Imaging Market (2026 - 2035)

ID: MRFR/ICT/35670-HCR 128 Pages Aarti Dhapte Last Updated: October 15, 2026
Short Wave Infrared Imaging Market Size, Share and Research Report By Wavelength (≤1 µm (0.9 µm Band), 1 µm–1.4 µm, 1.4–1.7 µm, 1.7–2.1 µm, ≥2.1 µm), By Cooling Technology (Uncooled SWIR, Cooled SWIR), By Sensor Type (Line Detectors, Area/Imagers), By Level of Integration (Sensor-Only Modules, Camera Cores, Complete Cameras/Systems), By End-User Industry (Military and Defense, Industrial Manufacturing, Automotive and Transportation, Healthcare and Life Sciences, Scientific Research, Others), By Application (Security and Surveillance, Monitoring and Inspection, Detection, ADAS/Autonomous Driving, Spectroscopy and Hyperspectral Imaging, Others) and By Region (North America, Europe, South America, Asia Pacific, Middle East and Africa) - Industry Forecast to 2035.
Short Wave Infrared Imaging Market
Market Size
Forecast Period2026-2035
CAGR (2026-2035)10.9%
2025 Market SizeUSD 0.66 Billion
2035 Market SizeUSD 1.85 Billion
Key Players
Teledyne FLIR
Sensors Unlimited (Collins Aerospace
RTX)
Hamamatsu Photonics
Lynred
Exosens
Opportunities
  • Mass-Market Automotive and Mobile Sensors
  • Emerging Semiconductor Hubs in India and ASEAN
  • Imaging-as-a-Service and Spectral Data Monetization
  1. 1 Market Summary | |
  2. 2 Key Report Takeaways | |
    1. 2.1 By Wavelength | |
    2. 2.2 By Cooling Technology | |
    3. 2.3 By Sensor Type | |
    4. 2.4 By Level of Integration | |
    5. 2.5 By End-User Industry | |
    6. 2.6 By Application | |
    7. 2.7 By Region | |
  3. 3 Market Size and Forecast (2021–2035) | |
    1. 3.1 Historical Market Size (2021–2024) | |
    2. 3.2 Base Year Market Size (2025) | |
    3. 3.3 Forecast Market Size (2026–2035) | |
    4. 3.4 Year-over-Year Growth Analysis | |
  4. 4 Driver Impact Analysis | |
    1. 4.1 Defense ISR and Night-Operations Modernization | |
    2. 4.2 Uncooled SWIR Adoption in Machine Vision | |
    3. 4.3 Automotive Night-Time AEB and ADAS Requirements | |
    4. 4.4 Falling Sensor Cost via CMOS-Compatible and Quantum-Dot Detectors | |
    5. 4.5 Semiconductor and Battery Inspection Capacity | |
    6. 4.6 Hyperspectral Sorting in Food and Recycling | |
  5. 5 Restraints Impact Analysis | |
    1. 5.1 High InGaAs Detector and Optics Cost | |
    2. 5.2 ITAR and EAR Export Controls | |
    3. 5.3 Critical Mineral Supply Risk | |
    4. 5.4 Resolution and Pixel-Pitch Limits Versus Visible CMOS | |
    5. 5.5 Integration Complexity and Optics Expertise | |
  6. 6 Opportunities | |
    1. 6.1 Mass-Market Automotive and Mobile Sensors | |
    2. 6.2 Emerging Semiconductor Hubs in India and ASEAN | |
    3. 6.3 Imaging-as-a-Service and Spectral Data Monetization | |
    4. 6.4 Recycling and Circular Economy Sorting | |
    5. 6.5 Space-Based and Small-Satellite Earth Observation | |
  7. 7 Regional Market Share and Country-Level Analysis | |
    1. 7.1 North America | | |
      1. 7.1.1 United States | | |
      2. 7.1.2 Canada | | |
      3. 7.1.3 Mexico | |
    2. 7.2 Europe | | |
      1. 7.2.1 Germany | | |
      2. 7.2.2 United Kingdom | | |
      3. 7.2.3 France | | |
      4. 7.2.4 Italy | | |
      5. 7.2.5 Spain | | |
      6. 7.2.6 Nordic Countries | | |
      7. 7.2.7 Russia | | |
      8. 7.2.8 Rest of Europe | |
    3. 7.3 Asia-Pacific | | |
      1. 7.3.1 China | | |
      2. 7.3.2 India | | |
      3. 7.3.3 Japan | | |
      4. 7.3.4 South Korea | | |
      5. 7.3.5 ASEAN | | |
      6. 7.3.6 Rest of Asia-Pacific | |
    4. 7.4 South America | | |
      1. 7.4.1 Brazil | | |
      2. 7.4.2 Argentina | | |
      3. 7.4.3 Rest of South America | |
    5. 7.5 Middle East & Africa | | |
      1. 7.5.1 Saudi Arabia | | |
      2. 7.5.2 United Arab Emirates | | |
      3. 7.5.3 South Africa | | |
      4. 7.5.4 Egypt | | |
      5. 7.5.5 Rest of Middle East & Africa | |
  8. 8 Future Outlook (2026–2035) | |
    1. 8.1 AI-Driven Spectral Analytics at the Edge | |
    2. 8.2 Automotive Sensor Fusion Matures | |
    3. 8.3 Commoditization of the Detector Layer | |
    4. 8.4 Supply-Chain Sovereignty and Sustainability | |
  9. 9 Segmentation Analysis | |
    1. 9.1 By Wavelength | | |
      1. 9.1.1 ≤1 µm (0.9 µm Band) | | |
      2. 9.1.2 1 µm-1.4 µm | | |
      3. 9.1.5 ≥2.1 µm | |
    2. 1.4-1.7 µm | | |
    3. 1.7-2.1 µm | | |
    4. 9.2 By Cooling Technology | | |
      1. 9.2.1 Uncooled SWIR | | |
      2. 9.2.2 Cooled SWIR | |
    5. 9.3 By Sensor Type | | |
      1. 9.3.1 Line Detectors | | |
      2. 9.3.2 Area/Imagers | |
    6. 9.4 By Level of Integration | | |
      1. 9.4.1 Sensor-Only Modules | | |
      2. 9.4.2 Camera Cores | | |
      3. 9.4.3 Complete Cameras/Systems | |
    7. 9.5 By End-User Industry | | |
      1. 9.5.1 Military and Defense | | |
      2. 9.5.2 Industrial Manufacturing | | |
      3. 9.5.3 Automotive and Transportation | | |
      4. 9.5.4 Healthcare and Life Sciences | | |
      5. 9.5.5 Scientific Research | | |
      6. 9.5.6 Others | |
    8. 9.6 By Application | | |
      1. 9.6.1 Security and Surveillance | | |
      2. 9.6.2 Monitoring and Inspection | | |
      3. 9.6.3 Detection | | |
      4. 9.6.4 ADAS/Autonomous Driving | | |
      5. 9.6.5 Spectroscopy and Hyperspectral Imaging | | |
      6. 9.6.6 Others | |
  10. 10 Competitive Landscape | |
    1. 10.1 Market Concentration Analysis | |
    2. 10.2 Competitive Benchmarking Matrix | |
    3. 10.3 Company Profiles | | |
      1. 10.3.1 Teledyne FLIR (Teledyne Technologies) | | |
      2. 10.3.2 Sensors Unlimited (Collins Aerospace, RTX) | | |
      3. 10.3.3 Hamamatsu Photonics | | |
      4. 10.3.4 Lynred | | |
      5. 10.3.5 Exosens (Xenics) | | |
      6. 10.3.6 Sony Semiconductor Solutions | | |
      7. 10.3.7 onsemi (SWIR Vision Systems) | | |
      8. 10.3.8 Excelitas Technologies (Raptor Photonics) | | |
      9. 10.3.9 Allied Vision Technologies | | |
      10. 10.3.10 New Imaging Technologies (NIT) | | |
      11. 10.3.11 Princeton Infrared Technologies | |
  11. 11 Recent News & Developments | |
  12. 12 Report Scope and Methodology | |
  13. 13 Detailed Sources and Citations | |
  14. 14 Frequently Asked Questions (FAQs) | | LIST OF TABLES | |
  15. TABLE 1 Global SWIR Imaging Market Summary, 2025–2035 | |
  16. TABLE 2 Global SWIR Imaging Market Size & Forecast, by Revenue (USD Billion), 2021–2035 | |
  17. TABLE 3 Driver Impact Analysis, 2026–2035 | |
  18. TABLE 4 Restraints Impact Analysis, 2026–2035 | |
  19. TABLE 5 Global SWIR Imaging Market, by Region, 2025 | |
  20. TABLE 6 North America SWIR Imaging Market, by Country, 2025 | |
  21. TABLE 7 Europe SWIR Imaging Market, by Country, 2025 | |
  22. TABLE 8 Asia-Pacific SWIR Imaging Market, by Country, 2025 | |
  23. TABLE 9 South America SWIR Imaging Market, by Country, 2025 | |
  24. TABLE 10 Middle East & Africa SWIR Imaging Market, by Country, 2025 | |
  25. TABLE 11 Global SWIR Imaging Market, by Wavelength, 2025 | |
  26. TABLE 12 Global SWIR Imaging Market, by Cooling Technology, 2025 | |
  27. TABLE 13 Global SWIR Imaging Market, by Sensor Type, 2025 | |
  28. TABLE 14 Global SWIR Imaging Market, by Level of Integration, 2025 | |
  29. TABLE 15 Global SWIR Imaging Market, by End-User Industry, 2025 | |
  30. TABLE 16 Global SWIR Imaging Market, by Application, 2025 | |
  31. TABLE 17 Competitive Benchmarking Matrix – Key Players, 2025 | |
  32. TABLE 18 Report Scope and Methodology | |
  33. TABLE 19 Detailed Sources and Citations | |
  34. TABLE 20 Segmentation Quick Reference | | LIST OF FIGURES | |
  35. FIGURE 1 Market Dynamics Overview – Drivers, Restraints and Opportunities | |
  36. FIGURE 2 SWIR Imaging Value Chain Analysis | |
  37. FIGURE 3 Porter's Five Forces Analysis | |
  38. FIGURE 4 Global Market Size Trend (USD Billion), 2021–2035 | |
  39. FIGURE 5 Year-over-Year Growth Rate, 2022–2035 | |
  40. FIGURE 6 Market Share by Wavelength, 2025 | |
  41. FIGURE 7 Market Share by Cooling Technology, 2025 | |
  42. FIGURE 8 Market Share by Sensor Type, 2025 | |
  43. FIGURE 9 Market Share by Level of Integration, 2025 | |
  44. FIGURE 10 Market Share by End-User Industry, 2025 | |
  45. FIGURE 11 Market Share by Application, 2025 | |
  46. FIGURE 12 Regional Market Share, 2025 | |
  47. FIGURE 13 Regional CAGR Comparison, 2026–2035 | |
  48. FIGURE 14 Competitive Landscape – Estimated Revenue Share Ranges, 2025 | |
  49. FIGURE 15 Recent Strategic Developments Timeline, 2023–2025

Segmentation Quick Reference

DimensionSub-SegmentsDominant SegmentFastest Growing Segment
By Wavelength≤1 µm (0.9 µm Band); 1 µm-1.4 µm; 1.4-1.7 µm; 1.7-2.1 µm; ≥2.1 µm1.4-1.7 µm (48.5% share)≥2.1 µm (12.8% CAGR)
By Cooling TechnologyUncooled SWIR; Cooled SWIRUncooled SWIR (66.6% share)Uncooled SWIR (66.6% share)
By Sensor TypeLine Detectors; Area/ImagersArea/Imagers (71.9% share)Line Detectors (11.6% CAGR)
By Level of IntegrationSensor-Only Modules; Camera Cores; Complete Cameras/SystemsComplete Cameras/Systems (56.9% share)Sensor-Only Modules (11.0% CAGR)
By End-User IndustryMilitary and Defense; Industrial Manufacturing; Automotive and Transportation; Healthcare and Life Sciences; Scientific Research; OthersMilitary and Defense (64.5% share)Automotive and Transportation (15.0% CAGR)
By ApplicationSecurity and Surveillance; Monitoring and Inspection; Detection; ADAS/Autonomous Driving; Spectroscopy and Hyperspectral Imaging; OthersSecurity and Surveillance (58.9% share)ADAS/Autonomous Driving (16.2% CAGR)
By RegionNorth America; Europe; Asia-Pacific; South America; Middle East & AfricaNorth America (40.2% share)Asia-Pacific (12.2% CAGR)

Market Segmentation Overview

By Wavelength

Sub-SegmentKey Trend
≤1 µm (0.9 µm Band)Silicon-extended sensors offer low-cost entry into near-SWIR
1 µm-1.4 µmLaser-spot tracking at 1.06 µm and machine vision
1.4-1.7 µmStandard InGaAs workhorse band for surveillance and inspection
1.7-2.1 µmExtended InGaAs for moisture and polymer analysis
≥2.1 µmQuantum-dot and extended InGaAs reach 2.5 µm for gas sensing

The 1.4-1.7 µm band leads because standard InGaAs detectors deliver their best noise performance there and atmospheric transmission suits long-range surveillance. The ≥2.1 µm band grows fastest as gas-leak detection and spectroscopy need deeper absorption lines that extended detectors now reach at lower cost. Broadband sensors spanning several bands may gradually reduce the importance of discrete band selection.

By Cooling Technology

Sub-SegmentKey Trend
Uncooled SWIRRoom-temperature quantum-dot and InGaAs arrays narrow the performance gap
Cooled SWIRRetained for kilometer-range and low-light airborne missions

Uncooled SWIR leads and continues gaining share because industrial and automotive buyers prioritize power, size and cost over peak sensitivity. Cooled SWIR keeps its role in long-range defense and airborne ISR, where sensitivity below the noise floor is mission-critical. Mixed defense fleets that accept uncooled soldier-borne optics further shift volume toward uncooled units.

By Sensor Type

Sub-SegmentKey Trend
Line DetectorsBattery foil, web and push-broom hyperspectral inspection
Area/ImagersHigh-speed variants for missile tracking and wafer inspection

Area/Imagers dominate because security cameras, scientific instruments and ADAS prototypes all need full-frame capture. Line Detectors grow fastest as continuous-process lines and hyperspectral sorters adopt linear architectures that match conveyor motion. Hybrid sensors that switch modes could narrow the gap between the two over the forecast period.

By Level of Integration

Sub-SegmentKey Trend
Sensor-Only ModulesEmbedded in gimbals, lidar stacks and multi-sensor pods
Camera CoresOEMs integrate cores into custom housings and optics
Complete Cameras/SystemsGigE Vision and USB3 Vision speed factory deployment

Complete Cameras/Systems lead because most integrators lack optical expertise and prefer plug-and-play units with standard interfaces. Sensor-Only Modules grow fastest as defense primes and automotive Tier 1 suppliers design detectors directly into their own assemblies. Camera Cores sit between the two, serving OEMs that want control over housings and optics without designing readout electronics.

By End-User Industry

Sub-SegmentKey Trend
Military and DefenseMulti-year ISR and targeting programs
Industrial ManufacturingInline moisture, contaminant and through-silicon inspection
Automotive and TransportationNight-time pedestrian AEB validation ahead of 2029
Healthcare and Life SciencesVascular imaging and tissue analysis research
Scientific ResearchAstronomy, spectroscopy and materials science
OthersAgriculture, recycling and energy monitoring

Military and Defense leads on the back of stable procurement budgets and programs of record that fund targeting and surveillance optronics. Automotive and Transportation grows fastest as OEMs prepare for night-time AEB requirements and test SWIR for fog and glare. Industrial Manufacturing remains the largest commercial end user, while Healthcare and Life Sciences and Scientific Research stay smaller, specialized niches.

By Application

Sub-SegmentKey Trend
Security and SurveillanceHaze-penetrating border and maritime monitoring
Monitoring and InspectionSemiconductor, battery and food quality control
DetectionGas leak, counterfeit and contaminant detection
ADAS/Autonomous DrivingAdverse-weather perception in sensor fusion stacks
Spectroscopy and Hyperspectral ImagingPolymer sorting driven by recycled-content targets
OthersMedical imaging, astronomy and art conservation

Security and Surveillance leads because SWIR sees through haze and smoke and detects covert laser illumination, capabilities defense and border agencies value highly. ADAS/Autonomous Driving grows fastest as perception stacks add SWIR to handle darkness and bad weather. Monitoring and Inspection and Spectroscopy and Hyperspectral Imaging expand with semiconductor capacity and EU recycling mandates.


Download PDF ×

We do not share your information with anyone. However, we may send you emails based on your report interest from time to time. You may contact us at any time to opt-out.