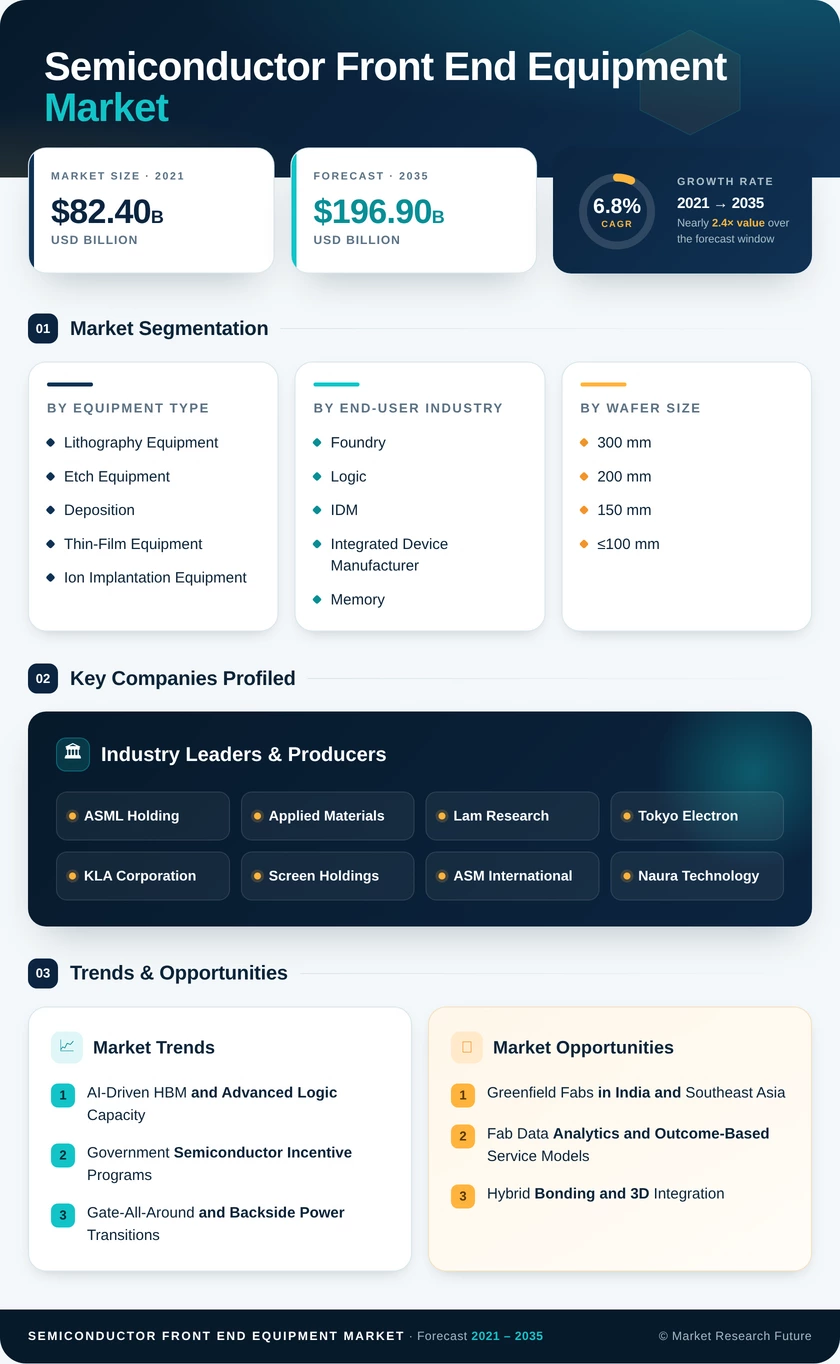
Semiconductor Front End Equipment Market (2026 - 2035)

ID: MRFR/SEM/41168-HCR 200 Pages Aarti Dhapte Last Updated: October 13, 2026
Semiconductor Front End Equipment Market Size, Share and Research Report By Equipment Type (Lithography Equipment, Etch Equipment, Deposition and Thin-Film Equipment, Ion Implantation Equipment, CMP Equipment, Cleaning Equipment, Inspection and Metrology, Track, Coater and Developer, and Thermal Processing), By End-User Industry (Foundry and Logic, IDM (Integrated Device Manufacturer), Memory (DRAM and NAND), and Specialty Analog and Power), By Wafer Size (300 mm, 200 mm, and 150 mm and ≤100 mm), And By Process Node Technology (≤5 nm, 6–16 nm, 28–65 nm, and >65 nm (Mature)) – Industry Forecast Till 2035
Semiconductor Front End Equipment Market
Market Size
Forecast Period2026-2035
CAGR (2026-2035)6.8%
2025 Market SizeUSD 101.6 Billion
2035 Market SizeUSD 196.9 Billion
Key Players
ASML Holding
Applied Materials
Lam Research
Tokyo Electron
KLA Corporation
Screen Holdings
Opportunities
  • Greenfield Fabs in India and Southeast Asia
  • Fab Data Analytics and Outcome-Based Service Models
  • Hybrid Bonding and 3D Integration
  1. 1 Market Summary | |
  2. 2 Key Report Takeaways | |
    1. 2.1 By Equipment Type | |
    2. 2.2 By End-User Industry | |
    3. 2.3 By Wafer Size | |
    4. 2.4 By Process Node Technology | |
    5. 2.5 By Region | |
  3. 3 Market Size and Forecast (2021–2035) | |
    1. 3.1 Historical Market Size (2021–2025) | |
    2. 3.2 Forecast Market Size (2026–2035) | |
    3. 3.3 Year-over-Year Growth Analysis | |
  4. 4 Driver Impact Analysis | |
    1. 4.1 AI-Driven HBM and Advanced Logic Capacity | |
    2. 4.2 Government Semiconductor Incentive Programs | |
    3. 4.3 Gate-All-Around and Backside Power Transitions | |
    4. 4.4 China Mature-Node Localization | |
    5. 4.5 High-NA EUV Adoption | |
    6. 4.6 Automotive and Power Device Fab Expansion | |
  5. 5 Restraints Impact Analysis | |
    1. 5.1 Export Controls on Advanced Tools | |
    2. 5.2 Escalating Tool and Fab Costs | |
    3. 5.3 Memory and Capex Cyclicality | |
    4. 5.4 Skilled Workforce Shortages | |
    5. 5.5 Price Pressure from Domestic Chinese Suppliers | |
  6. 6 Opportunities | |
    1. 6.1 Greenfield Fabs in India and Southeast Asia | |
    2. 6.2 Fab Data Analytics and Outcome-Based Service Models | |
    3. 6.3 Hybrid Bonding and 3D Integration | |
    4. 6.4 Silicon Carbide and Wide-Bandgap Transition to 200 mm | |
    5. 6.5 Refurbishment and Lifecycle Extension Programs | |
  7. 7 Regional Market Share and Country-Level Analysis | |
    1. 7.1 North America | | |
      1. 7.1.1 United States | | |
      2. 7.1.2 Canada | | |
      3. 7.1.3 Mexico | |
    2. 7.2 Europe | | |
      1. 7.2.1 Germany | | |
      2. 7.2.2 United Kingdom | | |
      3. 7.2.3 France | | |
      4. 7.2.4 Italy | | |
      5. 7.2.5 Spain | | |
      6. 7.2.6 Rest of Europe | |
    3. 7.3 Asia Pacific | | |
      1. 7.3.1 China | | |
      2. 7.3.2 Japan | | |
      3. 7.3.3 South Korea | | |
      4. 7.3.4 India | | |
      5. 7.3.5 Australia | | |
      6. 7.3.6 New Zealand | | |
      7. 7.3.7 Rest of Asia-Pacific | |
    4. 7.4 South America | | |
      1. 7.4.1 Brazil | | |
      2. 7.4.2 Argentina | | |
      3. 7.4.3 Rest of South America | |
    5. 7.5 Middle East and Africa | | |
      1. 7.5.1 Middle East | | |
      2. 7.5.2 United Arab Emirates | | |
      3. 7.5.3 Saudi Arabia | | |
      4. 7.5.4 Turkey | | |
      5. 7.5.5 Rest of Middle East | | |
      6. 7.5.6 Africa | | |
      7. 7.5.7 South Africa | | |
      8. 7.5.8 Nigeria | | |
      9. 7.5.9 Kenya | | |
      10. 7.5.10 Rest of Africa | |
  8. 8 Future Outlook (2026–2035) | |
    1. 8.1 AI Infrastructure as a Sustained Demand Engine | |
    2. 8.2 The Angstrom-Era Process Roadmap | |
    3. 8.3 Regionalization and Supply-Chain Resilience | |
    4. 8.4 Sustainability and Resource Efficiency | |
  9. 9 Segmentation Analysis | |
    1. 9.1 By Equipment Type | | |
      1. 9.1.1 Lithography Equipment | | |
      2. 9.1.2 Etch Equipment | | |
      3. 9.1.3 Deposition and Thin-Film Equipment | | |
      4. 9.1.4 Ion Implantation Equipment | | |
      5. 9.1.5 CMP Equipment | | |
      6. 9.1.6 Cleaning Equipment | | |
      7. 9.1.7 Inspection and Metrology | | |
      8. 9.1.8 Track, Coater and Developer | | |
      9. 9.1.9 Thermal Processing | |
    2. 9.2 By End-User Industry | | |
      1. 9.2.1 Foundry and Logic | | |
      2. 9.2.2 IDM, Integrated Device Manufacturer | | |
      3. 9.2.3 Memory, DRAM and NAND | | |
      4. 9.2.4 Specialty Analog and Power | |
    3. 9.3 By Wafer Size | | |
      1. 9.3.1 300 mm | | |
      2. 9.3.2 200 mm | | |
      3. 9.3.3 150 mm and ≤100 mm | |
    4. 9.4 By Process Node Technology | | |
      1. 9.4.1 ≤5 nm | | |
      2. 9.4.2 6-16 nm | | |
      3. 9.4.3 28-65 nm | | |
      4. 9.4.4 > 65 nm (Mature) | |
  10. 10 Competitive Landscape | |
    1. 10.1 Market Concentration Analysis | |
    2. 10.2 Competitive Benchmarking Matrix | |
    3. 10.3 Company Profiles | | |
      1. 10.3.1 ASML Holding | | |
      2. 10.3.2 Applied Materials | | |
      3. 10.3.3 Lam Research | | |
      4. 10.3.4 Tokyo Electron | | |
      5. 10.3.5 KLA Corporation | | |
      6. 10.3.6 Screen Holdings | | |
      7. 10.3.7 ASM International | | |
      8. 10.3.8 Naura Technology | | |
      9. 10.3.9 Kokusai Electric | | |
      10. 10.3.10 Advanced Micro-Fabrication Equipment (AMEC) | | |
      11. 10.3.11 Hitachi High-Tech | | |
      12. 10.3.12 Canon | |
  11. 11 Recent News and Developments | |
  12. 12 Report Scope and Methodology | |
  13. 13 Detailed Sources and Citations | |
  14. 14 Frequently Asked Questions (FAQs) | | LIST OF TABLES | |
  15. TABLE 1 Global Market Snapshot, 2025–2035 | |
  16. TABLE 2 Global Market Size and Forecast, by Revenue (USD Billion), 2021–2035 | |
  17. TABLE 3 Driver Impact Analysis, 2026–2035 | |
  18. TABLE 4 Restraints Impact Analysis, 2026–2035 | |
  19. TABLE 5 Regional Market Share Summary, 2025 | |
  20. TABLE 6 North America Market, by Country, 2025 | |
  21. TABLE 7 Europe Market, by Country, 2025 | |
  22. TABLE 8 Asia Pacific Market, by Country, 2025 | |
  23. TABLE 9 South America Market, by Country, 2025 | |
  24. TABLE 10 Middle East and Africa Market, by Country, 2025 (USD Billion) | |
  25. TABLE 11 Global Market, by Equipment Type, 2025 | |
  26. TABLE 12 Global Market, by End-User Industry, 2025 | |
  27. TABLE 13 Global Market, by Wafer Size, 2025 | |
  28. TABLE 14 Global Market, by Process Node Technology, 2025 | |
  29. TABLE 15 Competitive Benchmarking Matrix, 2025 | |
  30. TABLE 16 Report Scope and Methodology | |
  31. TABLE 17 Detailed Sources and Citations | |
  32. TABLE 18 Segmentation Quick Reference | | LIST OF FIGURES | |
  33. FIGURE 1 Market Dynamics Overview (Drivers, Restraints, Opportunities) | |
  34. FIGURE 2 Industry Value Chain Analysis | |
  35. FIGURE 3 Porter's Five Forces Analysis | |
  36. FIGURE 4 Global Market Size Trend, 2021–2035 (USD Billion) | |
  37. FIGURE 5 Year-over-Year Growth Rate, 2022–2035 | |
  38. FIGURE 6 Market Share, by Equipment Type, 2025 | |
  39. FIGURE 7 Market Share, by End-User Industry, 2025 | |
  40. FIGURE 8 Market Share, by Wafer Size, 2025 | |
  41. FIGURE 9 Market Share, by Process Node Technology, 2025 | |
  42. FIGURE 10 Regional Market Share, 2025 | |
  43. FIGURE 11 Asia Pacific Country Share, 2025 | |
  44. FIGURE 12 Competitive Landscape Positioning Map, 2025 | |
  45. FIGURE 13 Estimated Vendor Revenue Share Ranges, 2025

Segmentation Quick Reference

DimensionSub-SegmentsDominant SegmentFastest Growing Segment
By Equipment TypeLithography Equipment; Etch Equipment; Deposition and Thin-Film Equipment; Ion Implantation Equipment; CMP Equipment; Cleaning Equipment; Inspection and Metrology; Track, Coater and Developer; Thermal ProcessingLithography Equipment (27.0% share)Inspection and Metrology (8.4% CAGR)
By End-User IndustryFoundry and Logic; IDM, Integrated Device Manufacturer; Memory, DRAM and NAND; Specialty Analog and PowerFoundry and Logic (43.2% share)Memory, DRAM and NAND (9.7% CAGR)
By Wafer Size300 mm; 200 mm; 150 mm and ≤100 mm300 mm (8.4% CAGR)300 mm (8.4% CAGR)
By Process Node Technology≤5 nm; 6-16 nm; 28-65 nm; > 65 nm (Mature)28-65 nm (31.4% share)≤5 nm (10.6% CAGR)
By RegionNorth America; Europe; Asia Pacific; South America; Middle East and AfricaAsia Pacific (72.4% share)Asia Pacific (72.4% share)

Market Segmentation Overview

By Equipment Type

Sub-SegmentKey Trend
Lithography EquipmentHigh-NA EUV moves from pilot to volume insertion
Etch EquipmentSelective lateral etch for nanosheet release
Deposition and Thin-Film EquipmentALD step counts rise with gate-all-around
Ion Implantation EquipmentHigh-temperature implant for silicon carbide
CMP EquipmentSurface preparation for hybrid bonding
Cleaning EquipmentSingle-wafer cleaning for sub-5 nm defect control
Inspection and MetrologyE-beam and X-ray methods for buried structures
Track, Coater and DeveloperMetal-oxide resist processing for EUV
Thermal ProcessingMillisecond anneal for new channel materials

Lithography Equipment leads because a single EUV scanner costs more than an entire mature-node toolset, and High-NA systems lift that figure further. Inspection and Metrology grows fastest since stacked nanosheet channels conceal defects that optical tools cannot see, forcing fabs to add e-beam and X-ray steps. Etch Equipment remains the second-largest category as 3D NAND layer counts climb.

By End-User Industry

Sub-SegmentKey Trend
Foundry and Logic2 nm and 14A-class capacity for AI processors
IDM, Integrated Device ManufacturerAutomotive analog and microcontroller expansions
Memory, DRAM and NANDHBM stacking and TSV processing
Specialty Analog and PowerSilicon carbide and power silicon for EVs

Foundry and Logic holds the largest share, driven by TSMC, Samsung Foundry, and Intel funding leading-edge capacity for AI accelerators. Memory, DRAM and NAND grows fastest because each HBM stack requires TSV etch, copper fill, and bonding steps absent from standard DRAM. Specialty Analog and Power gains steadily from electric vehicle inverter demand.

By Wafer Size

Sub-SegmentKey Trend
300 mmNew fabs in the U.S., Japan, and India standardize on this diameter
200 mmHigh utilization and retrofit kit adoption
150 mm and ≤100 mmSilicon carbide and compound semiconductor lines

300 mm is both the largest and fastest-growing diameter, since cost-per-die economics favour it at leading and mature nodes alike. 200 mm sustains a sizeable share because analog and RF products lack a practical migration path, while 150 mm and ≤100 mm tools serve silicon carbide producers now planning moves to 200 mm.

By Process Node Technology

Sub-SegmentKey Trend
≤5 nmEUV-intensive gate-all-around ramps
6-16 nmAutomotive compute and networking chips
28-65 nmChinese mature-node capacity buildout
> 65 nm (Mature)Refurbished tool reliance for power and discretes

28-65 nm leads on spending as Chinese foundries add capacity for microcontrollers, display drivers, and IoT devices under localization policies. ≤5 nm grows fastest because each node shrink adds EUV layers, selective etch, and advanced metrology. > 65 nm (Mature) relies heavily on refurbished tools, keeping its value share modest despite large wafer volumes.


Download PDF ×

We do not share your information with anyone. However, we may send you emails based on your report interest from time to time. You may contact us at any time to opt-out.