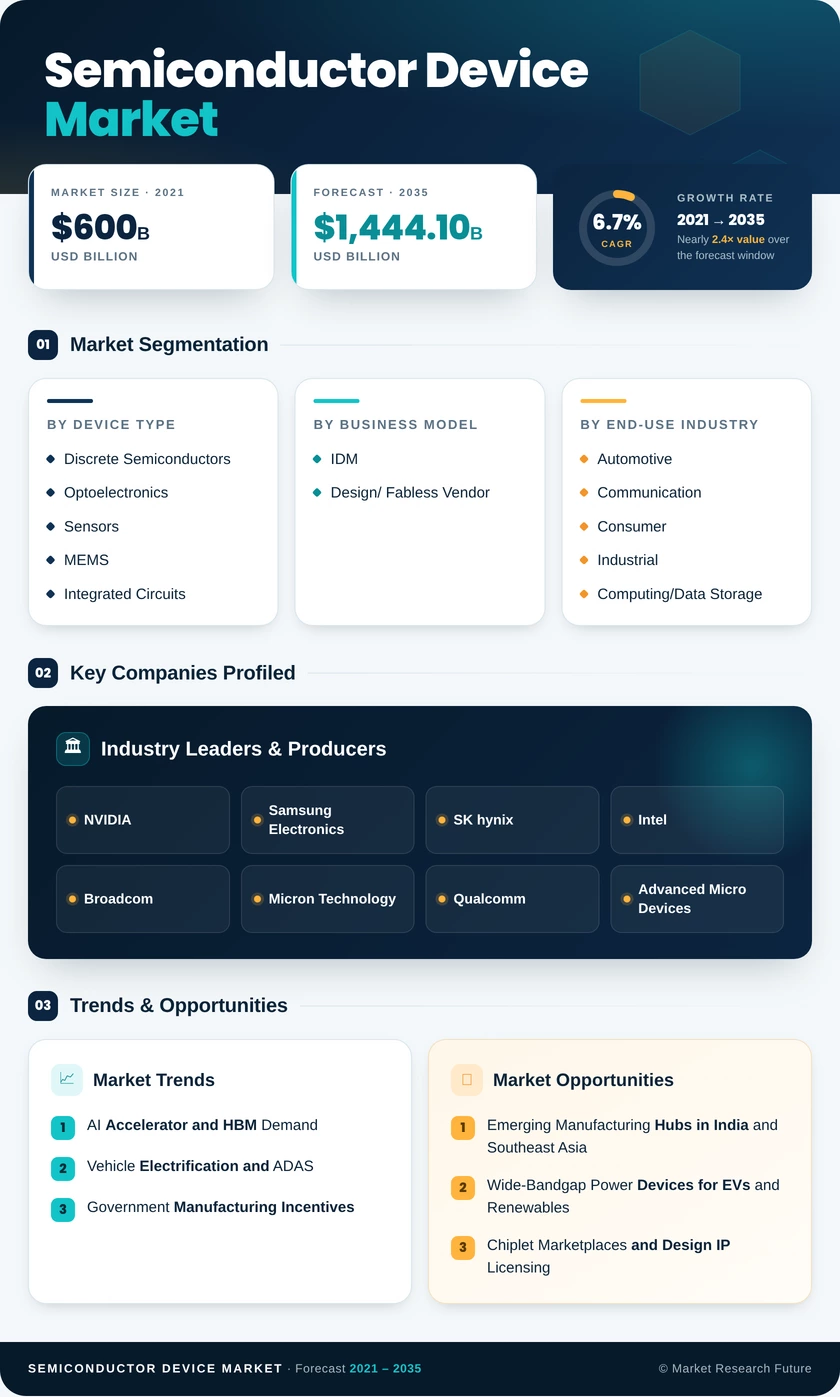
Semiconductor Device Market (2026 - 2035)

ID: MRFR/SEM/65993-HCR 200 Pages Nirmit Biswas Last Updated: October 13, 2026
Semiconductor Device Market Size, Share and Research Report By Device Type (Discrete Semiconductors, Optoelectronics, Sensors and MEMS, and Integrated Circuits), By Business Model (IDM and Design/Fabless Vendor), And By End-Use Industry (Automotive, Communication, Consumer, Industrial, Computing/Data Storage, Data Center, AI, and Government) – Industry Forecast Till 2035
Semiconductor Device Market
Market Size
Forecast Period2026-2035
CAGR (2026-2035)6.7%
2025 Market SizeUSD 755.0 Billion
2035 Market SizeUSD 1,444.1 Billion
Key Players
NVIDIA
Samsung Electronics
SK hynix
Intel
Broadcom
Micron Technology
Opportunities
  • Emerging Manufacturing Hubs in India and Southeast Asia
  • Wide-Bandgap Power Devices for EVs and Renewables
  • Chiplet Marketplaces and Design IP Licensing
  1. 1 Market Summary | |
  2. 2 Key Report Takeaways | |
    1. 2.1 By Device Type | |
    2. 2.2 By Business Model | |
    3. 2.3 By End-Use Industry | |
    4. 2.4 By Region | |
  3. 3 Market Size and Forecast (2021–2035) | |
  4. 4 Driver Impact Analysis | |
    1. 4.1 AI Accelerator and HBM Demand | |
    2. 4.2 Vehicle Electrification and ADAS | |
    3. 4.3 Government Manufacturing Incentives | |
    4. 4.4 5G and Next-Generation Communication | |
    5. 4.5 Industrial Automation and Robotics | |
    6. 4.6 Advanced Packaging and Chiplets | |
  5. 5 Restraints Impact Analysis | |
    1. 5.1 Escalating Fab Capital Intensity | |
    2. 5.2 Export Controls and Geopolitical Tension | |
    3. 5.3 Skilled Workforce Shortages | |
    4. 5.4 Cyclical Inventory Corrections | |
    5. 5.5 Critical Material and Resource Constraints | |
  6. 6 Opportunities | |
    1. 6.1 Emerging Manufacturing Hubs in India and Southeast Asia | |
    2. 6.2 Wide-Bandgap Power Devices for EVs and Renewables | |
    3. 6.3 Chiplet Marketplaces and Design IP Licensing | |
    4. 6.4 Silicon Lifecycle Data Monetization | |
    5. 6.5 Edge AI in Consumer and Industrial Devices | |
  7. 7 Regional Market Share and Country-Level Analysis | |
    1. 7.1 North America | | |
      1. 7.1.1 US | | |
      2. 7.1.2 Canada | | |
      3. 7.1.3 Mexico | |
    2. 7.2 Europe | | |
      1. 7.2.1 Germany | | |
      2. 7.2.2 UK | | |
      3. 7.2.3 France | | |
      4. 7.2.4 Italy | | |
      5. 7.2.5 Spain | | |
      6. 7.2.6 Nordic Countries | | |
      7. 7.2.7 Russia | | |
      8. 7.2.8 Rest of Europe | |
    3. 7.3 Asia-Pacific | | |
      1. 7.3.1 China | | |
      2. 7.3.2 India | | |
      3. 7.3.3 Japan | | |
      4. 7.3.4 South Korea | | |
      5. 7.3.5 ASEAN | | |
      6. 7.3.6 Rest of Asia-Pacific | |
    4. 7.4 South America | | |
      1. 7.4.1 Brazil | | |
      2. 7.4.2 Argentina | | |
      3. 7.4.3 Rest of South America | |
    5. 7.5 Middle East and Africa | | |
      1. 7.5.1 Saudi Arabia | | |
      2. 7.5.2 UAE | | |
      3. 7.5.3 South Africa | | |
      4. 7.5.4 Egypt | | |
      5. 7.5.5 Rest of MEA | |
  8. 8 Future Outlook (2026–2035) | |
    1. 8.1 AI Compute Becomes the Core Demand Engine | |
    2. 8.2 Platform Economics and Modular Silicon | |
    3. 8.3 The Electrification Supercycle | |
    4. 8.4 Sustainability Becomes a Procurement Criterion | |
  9. 9 Segmentation Analysis | |
    1. 9.1 By Device Type | | |
      1. 9.1.1 Discrete Semiconductors | | |
      2. 9.1.2 Optoelectronics | | |
      3. 9.1.3 Sensors and MEMS | | |
      4. 9.1.4 Integrated Circuits | |
    2. 9.2 By Business Model | | |
      1. 9.2.1 IDM | | |
      2. 9.2.2 Design/ Fabless Vendor | |
    3. 9.3 By End-Use Industry | | |
      1. 9.3.1 Automotive | | |
      2. 9.3.2 Communication | | |
      3. 9.3.3 Consumer | | |
      4. 9.3.4 Industrial | | |
      5. 9.3.5 Computing/Data Storage | | |
      6. 9.3.6 Data Center | | |
      7. 9.3.7 AI | | |
      8. 9.3.8 Government | |
  10. 10 Competitive Landscape | |
  11. 11 Recent News & Developments | |
  12. 12 Report Scope and Methodology | |
  13. 13 Detailed Sources and Citations | |
  14. 14 Frequently Asked Questions (FAQs) | | LIST OF TABLES | |
  15. TABLE 1 Global Semiconductor Device Market Snapshot, 2025–2035 | |
  16. TABLE 2 Global Semiconductor Device Market Size & Forecast, by Revenue (USD Billion), 2021–2035 | |
  17. TABLE 3 Driver Impact Analysis – Global Semiconductor Device Market | |
  18. TABLE 4 Restraints Impact Analysis – Global Semiconductor Device Market | |
  19. TABLE 5 Global Semiconductor Device Market, by Region, 2025 | |
  20. TABLE 6 North America Semiconductor Device Market, by Country, 2025 | |
  21. TABLE 7 Europe Semiconductor Device Market, by Country, 2025 | |
  22. TABLE 8 Asia-Pacific Semiconductor Device Market, by Country, 2025 | |
  23. TABLE 9 South America Semiconductor Device Market, by Country, 2025 | |
  24. TABLE 10 Middle East and Africa Semiconductor Device Market, by Country, 2025 | |
  25. TABLE 11 Global Semiconductor Device Market, by Device Type, 2025 | |
  26. TABLE 12 Global Semiconductor Device Market, by Business Model, 2025 | |
  27. TABLE 13 Global Semiconductor Device Market, by End-Use Industry, 2025 | |
  28. TABLE 14 Competitive Benchmarking Matrix – Global Semiconductor Device Market | |
  29. TABLE 15 Report Scope and Methodology | |
  30. TABLE 16 Detailed Sources and Citations | | LIST OF FIGURES | |
  31. FIGURE 1 Global Semiconductor Device Market Dynamics – Drivers, Restraints, Opportunities | |
  32. FIGURE 2 Semiconductor Device Value Chain Analysis | |
  33. FIGURE 3 Porter's Five Forces Analysis – Semiconductor Device Market | |
  34. FIGURE 4 Global Semiconductor Device Market Size Trend, 2021–2035 (USD Billion) | |
  35. FIGURE 5 Market Share by Device Type, 2025 | |
  36. FIGURE 6 Market Share by Business Model, 2025 | |
  37. FIGURE 7 Market Share by End-Use Industry, 2025 | |
  38. FIGURE 8 Regional Market Share, 2025 | |
  39. FIGURE 9 Asia-Pacific Country Share, 2025 | |
  40. FIGURE 10 Competitive Landscape – Estimated Revenue Share of Key Players

Segmentation Quick Reference

DimensionSub-SegmentsDominant SegmentFastest Growing Segment
By Device TypeDiscrete Semiconductors, Optoelectronics, Sensors and MEMS, Integrated CircuitsIntegrated Circuits (80.1% share)Sensors and MEMS (7.8% CAGR)
By Business ModelIDM, Design/ Fabless VendorDesign/ Fabless Vendor (7.7% CAGR)Design/ Fabless Vendor (7.7% CAGR)
By End-Use IndustryAutomotive, Communication, Consumer, Industrial, Computing/Data Storage, Data Center, AI, GovernmentCommunication (27.7% share)AI (8.9% CAGR)
By RegionNorth America, Europe, Asia-Pacific, South America, Middle East and AfricaAsia-Pacific (55.6% share)Asia-Pacific (55.6% share)

Market Segmentation Overview

By Device Type

Sub-SegmentKey Trend
Discrete SemiconductorsSiC MOSFETs and GaN HEMTs replace silicon in high-voltage power stages
Optoelectronics800G and 1.6T optical transceivers for AI clusters
Sensors and MEMSInertial and environmental sensors scale in Industry 4.0 and ADAS
Integrated CircuitsHBM, advanced logic, and analog content rise per system

Integrated Circuits lead this dimension because AI accelerators, HBM stacks, and analog control chips concentrate most device value in a single package. Sensors and MEMS grow fastest as factories and vehicles add sensing nodes for automation and driver assistance. Discrete Semiconductors gain from wide-bandgap power adoption, while Optoelectronics ride data center optical upgrades.

By Business Model

Sub-SegmentKey Trend
IDMCapacity investment concentrated in analog, power, and memory
Design/ Fabless VendorAnnual architecture refresh enabled by foundry partnerships

Design/ Fabless Vendor leads and grows fastest because decoupling design from fabrication lets firms refresh AI and mobile architectures on annual cycles. IDM companies retain advantages where process control drives performance, such as power and analog devices, but carry node-level capital burdens. Foundry–fabless collaboration on advanced packaging is reshaping where margin is captured.

By End-Use Industry

Sub-SegmentKey Trend
AutomotiveBattery-electric drivetrains and Level 2+ ADAS
Communication5G densification and fiber backbone upgrades
ConsumerAI co-processors in premium smartphones and PCs
IndustrialMachine vision and real-time control
Computing/Data StoragePC refresh cycles and enterprise SSD adoption
Data CenterCloud networking and storage expansion
AIAccelerator-class silicon with premium pricing
GovernmentRadiation-hardened and defense-grade devices

Communication holds the largest share as operators densify 5G networks and upgrade fiber backbones. AI is the fastest-growing end use because accelerator chips carry far higher selling prices than conventional processors. Automotive and Data Center follow closely, while Government remains a small, high-margin niche for radiation-hardened parts.


Download PDF ×

We do not share your information with anyone. However, we may send you emails based on your report interest from time to time. You may contact us at any time to opt-out.