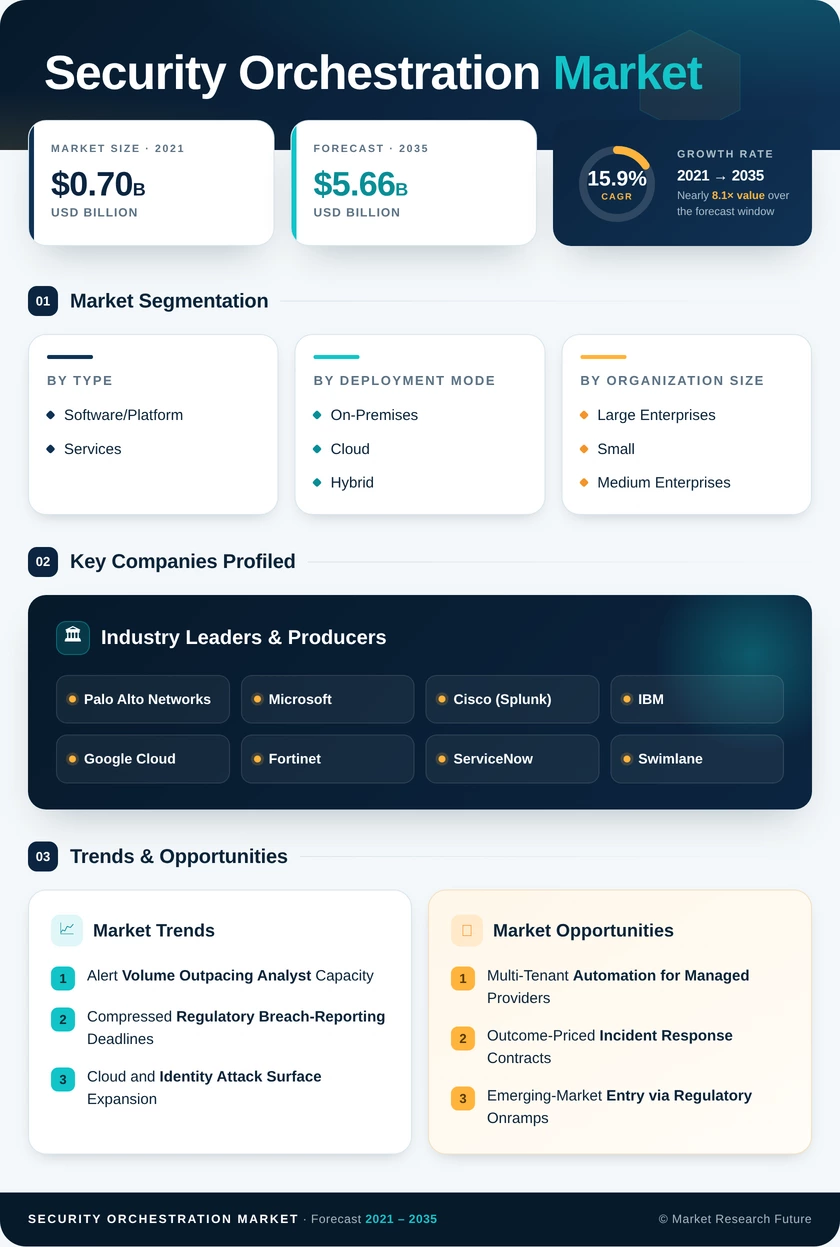
Market Segmentation Analysis
By Type
9.1.1 Software/Platform
9.1.2 Services
By Deployment Mode
9.2.1 On-Premises
9.2.2 Cloud
9.2.3 Hybrid
By Organization Size
9.3.1 Large Enterprises
9.3.2 Small and Medium Enterprises
By End-User Industry
9.4.1 Banking, Financial Services and Insurance
9.4.2 Information Technology and Telecommunications
9.4.3 Government and Defense
9.4.4 Healthcare
9.4.5 Retail and E-commerce
9.4.6 Other End-User Industries
| Dimension | Sub-Segments | Dominant Segment | Fastest Growing Segment |
| By Type | Software/Platform; Services | Software/Platform (57.8% share, 2025) | Services (16.8% CAGR, 2026–2035) |
| By Deployment Mode | On-Premises; Cloud; Hybrid | On-Premises (51.2% share, 2025) | Cloud (17.5% CAGR, 2026–2035) |
| By Organization Size | Large Enterprises; Small and Medium Enterprises | Large Enterprises (63.3% share, 2025) | Small and Medium Enterprises (17.0% CAGR, 2026–2035) |
| By End-User Industry | Banking, Financial Services and Insurance; Information Technology and Telecommunication; Government and Defense; Healthcare; Retail and E-commerce; Other End-User Industries | Banking, Financial Services and Insurance (31.2% share, 2025) | Healthcare (17.2% CAGR, 2026–2035) |
Market Segmentation Overview
By Type
| Sub-Segment | Key Trend |
| Software/Platform | Consumption-based licensing replaces enterprise commitments as buyers pay per playbook execution. |
| Services | Quarterly logic reviews and connector refresh cycles create recurring integrator revenue. |
Software/Platform holds the larger revenue base because buyers want a maintained execution engine rather than internally written scripts that fail silently when interfaces change. Services grow faster, at 16.8% annually, because the binding constraint is integration work — custom bridges to specialty tools and continuous tuning as vendor APIs evolve. Managed delivery specifically appeals to teams that cannot add headcount but still owe regulators near-immediate containment evidence.
By Deployment Mode
| Sub-Segment | Key Trend |
| On-Premises | Sovereign hosting requirements in defence and public health sustain local builds. |
| Cloud | Elastic compute absorbs alert spikes and integrates natively with SaaS administration APIs |
| Hybrid | Case evidence is retained locally while analysis workloads run in vendor environments. |
On-Premises still leads at 51.2% because attestation frameworks such as Germany's C5 restrict where case evidence may be processed, and defence buyers rarely receive exemptions. Cloud is the fastest-growing mode at 17.5% annually, driven by teams that need capacity during volume surges and by DevSecOps groups expecting security tooling to run in the same clusters as application workloads. Hybrid sits between them as the pragmatic compliance answer, letting regulated buyers migrate in stages without rewriting automation logic.
By Organization Size
| Sub-Segment | Key Trend |
| Large Enterprises | Multi-vendor tool estates make cross-platform coordination unavoidable |
| Small and Medium Enterprises | Starter editions with packaged phishing and credential playbooks shorten time to value |
Large Enterprises account for 63.3% of spending because organizations running a dozen or more detection tools cannot coordinate containment manually across them. Small and Medium Enterprises grow fastest at 17.0% as vendors modularise, shipping low-code builders and two-week channel deployments priced by execution volume rather than seats. Supply-chain scrutiny accelerates this: larger partners and insurers increasingly require smaller suppliers to evidence automated containment before contracts renew.
By End-User Industry
| Sub-Segment | Key Trend |
| Banking, Financial Services and Insurance | Operational resilience testing duties under DORA extend to critical ICT providers. |
| Information Technology and Telecommunication | Large internal tool estates and customer-trust exposure drive early adoption |
| Government and Defense | Directive-linked procurement cycles favour sovereign-hosted deployments. |
| Healthcare | Automated segment isolation treated as a clinical continuity control |
| Retail and E-commerce | Seasonal traffic surges require automation that scales without permanent headcount. |
| Other End-User Industries | Manufacturing and utility operators pulled in by critical infrastructure mandates |
Banking, financial services and insurance leads with 31.2% of 2025 demand, reflecting penalty exposure and supervisory testing obligations that make documented automation an audit artefact rather than an efficiency project. Healthcare expands fastest at 17.2% because hospital downtime carries patient-safety consequences, which reframes automated isolation and credential reset as clinical controls funded outside constrained IT budgets. Government and defence spending, by contrast, moves in directive-linked waves and skews to on-premises builds, while retail buyers prioritise elastic automation ahead of peak trading seasons.

 Noah Malgeri
Co-Founder
Noah Malgeri
Co-Founder

 Peter Groot koerkamp
Account and Business Manager
Peter Groot koerkamp
Account and Business Manager

 Younghwan Choi
Senior Retail Manager
Younghwan Choi
Senior Retail Manager

 Mark Irwin
Management Consultant
Mark Irwin
Management Consultant

 Akif Moroglu
Strategy & Business Development Director
Akif Moroglu
Strategy & Business Development Director

 Guilherme Gomes Martins
Product Management Director
Guilherme Gomes Martins
Product Management Director

 Joseph Aguayo
Sales Operations & Pricing Manager
Joseph Aguayo
Sales Operations & Pricing Manager

 La Terria Dodd
Program Support Specialist
La Terria Dodd
Program Support Specialist

 Rob Kooiker
Group Product Manager HVAC & Fire Protection GMA
Rob Kooiker
Group Product Manager HVAC & Fire Protection GMA