Seaweed Market Segmentation
Seaweed Market By Type (USD Billion, 2025-2035)
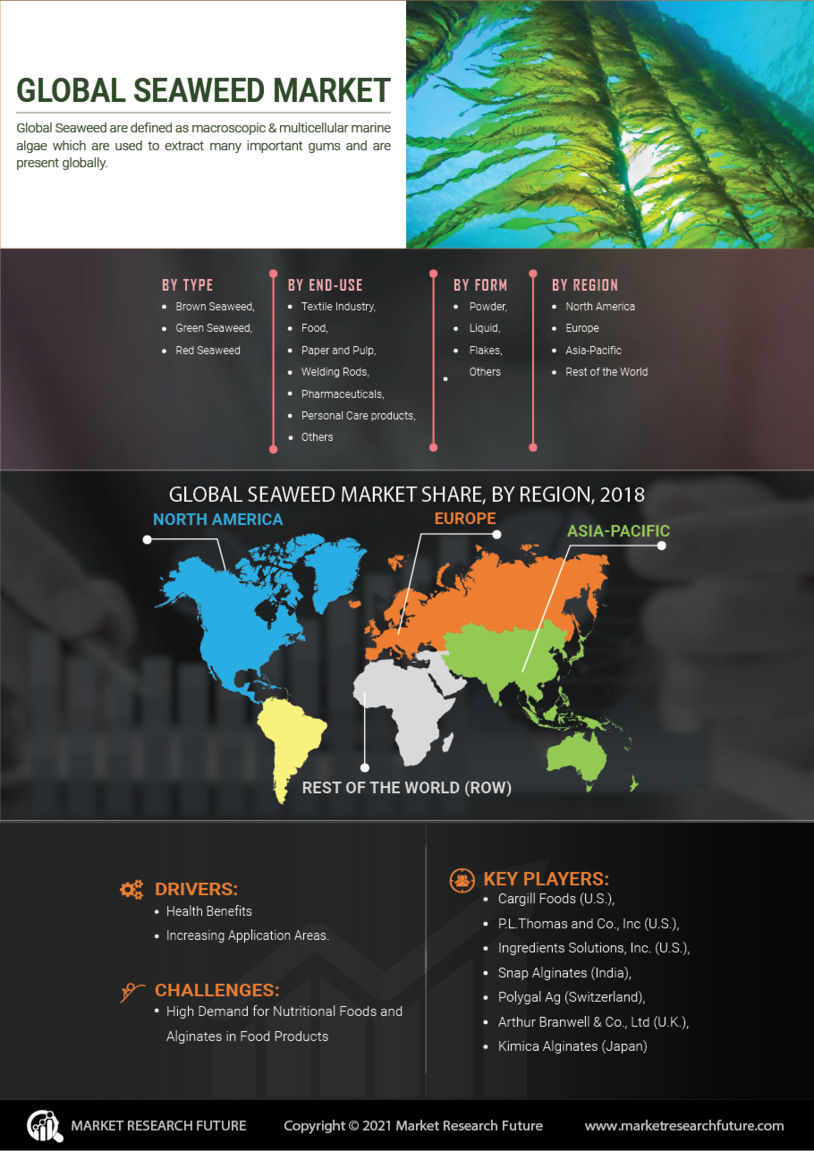
- Red Seaweed
- Brown Seaweed
- Green Seaweed
- Blue Seaweed
Seaweed Market By Application (USD Billion, 2025-2035)
- Food and Beverages
- Pharmaceuticals
- Agriculture
- Cosmetics
- Biofuels
Seaweed Market By Form (USD Billion, 2025-2035)
- Dried
- Powdered
- Liquid
Seaweed Market By End Use (USD Billion, 2025-2035)
- Human Consumption
- Animal Feed
- Industrial Use