Request Free Sample ×

Kindly complete the form below to receive a free sample of this Report

* Please use a valid business email

Leading companies partner with us for data-driven Insights

clients tt-cursor
Hero Background

Russia V2X Market

ID: MRFR/AT/52482-HCR
200 Pages
Triveni Bhoyar
Last Updated: February 09, 2026

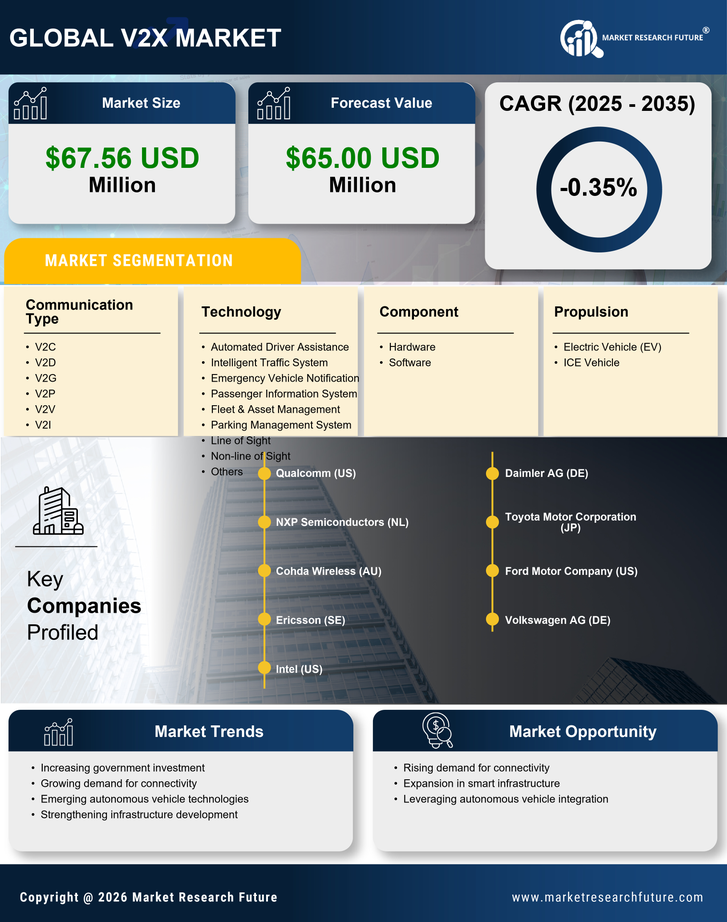
Russia V2X Market Research Report By Technology (Automated Driver Assistance, Intelligent Traffic System, Emergency Vehicle Notification, Passenger Information System, Fleet & Asset Management, Parking Management System, Line of Sight, Non-line of Sight, Others), By Component (Hardware, Software), By Communication Type (V2C, V2D, V2G, V2P, V2V, V2I), By Propulsion (Electric Vehicle (EV), ICE Vehicle), By Connectivity (DSRC, Cellular), By Unit Type (Onboard Unit, Roadside Unit) and By Vehicle Type (Passenger Car, Commercial Vehicle) - Growth & Industry Forecast 2025 To 2035

Share:
Download PDF ×

We do not share your information with anyone. However, we may send you emails based on your report interest from time to time. You may contact us at any time to opt-out.

Russia V2X Market Infographic
Purchase Options
  1. 1 SECTION I: EXECUTIVE SUMMARY AND KEY HIGHLIGHTS
  2.   1.1 EXECUTIVE SUMMARY
  3.     1.1.1 Market Overview
  4.     1.1.2 Key Findings
  5.     1.1.3 Market Segmentation
  6.     1.1.4 Competitive Landscape
  7.     1.1.5 Challenges and Opportunities
  8.     1.1.6 Future Outlook
  9. 2 SECTION II: SCOPING, METHODOLOGY AND MARKET STRUCTURE
  10.   2.1 MARKET INTRODUCTION
  11.     2.1.1 Definition
  12.     2.1.2 Scope of the study
  13.       2.1.2.1 Research Objective
  14.       2.1.2.2 Assumption
  15.       2.1.2.3 Limitations
  16.   2.2 RESEARCH METHODOLOGY
  17.     2.2.1 Overview
  18.     2.2.2 Data Mining
  19.     2.2.3 Secondary Research
  20.     2.2.4 Primary Research
  21.       2.2.4.1 Primary Interviews and Information Gathering Process
  22.       2.2.4.2 Breakdown of Primary Respondents
  23.     2.2.5 Forecasting Model
  24.     2.2.6 Market Size Estimation
  25.       2.2.6.1 Bottom-Up Approach
  26.       2.2.6.2 Top-Down Approach
  27.     2.2.7 Data Triangulation
  28.     2.2.8 Validation
  29. 3 SECTION III: QUALITATIVE ANALYSIS
  30.   3.1 MARKET DYNAMICS
  31.     3.1.1 Overview
  32.     3.1.2 Drivers
  33.     3.1.3 Restraints
  34.     3.1.4 Opportunities
  35.   3.2 MARKET FACTOR ANALYSIS
  36.     3.2.1 Value chain Analysis
  37.     3.2.2 Porter's Five Forces Analysis
  38.       3.2.2.1 Bargaining Power of Suppliers
  39.       3.2.2.2 Bargaining Power of Buyers
  40.       3.2.2.3 Threat of New Entrants
  41.       3.2.2.4 Threat of Substitutes
  42.       3.2.2.5 Intensity of Rivalry
  43.     3.2.3 COVID-19 Impact Analysis
  44.       3.2.3.1 Market Impact Analysis
  45.       3.2.3.2 Regional Impact
  46.       3.2.3.3 Opportunity and Threat Analysis
  47. 4 SECTION IV: QUANTITATIVE ANALYSIS
  48.   4.1 Automobile, BY Technology (USD Million)
  49.     4.1.1 Automated Driver Assistance
  50.     4.1.2 Intelligent Traffic System
  51.     4.1.3 Emergency Vehicle Notification
  52.     4.1.4 Passenger Information System
  53.     4.1.5 Fleet & Asset Management
  54.     4.1.6 Parking Management System
  55.     4.1.7 Line of Sight
  56.     4.1.8 Non-line of Sight
  57.     4.1.9 Others
  58.   4.2 Automobile, BY Component (USD Million)
  59.     4.2.1 Hardware
  60.     4.2.2 Software
  61.   4.3 Automobile, BY Communication Type (USD Million)
  62.     4.3.1 V2C
  63.     4.3.2 V2D
  64.     4.3.3 V2G
  65.     4.3.4 V2P
  66.     4.3.5 V2V
  67.     4.3.6 V2I
  68.   4.4 Automobile, BY Propulsion (USD Million)
  69.     4.4.1 Electric Vehicle (EV)
  70.     4.4.2 ICE Vehicle
  71.   4.5 Automobile, BY Connectivity (USD Million)
  72.     4.5.1 DSRC
  73.     4.5.2 Cellular
  74.   4.6 Automobile, BY Unit Type (USD Million)
  75.     4.6.1 Onboard Unit
  76.     4.6.2 Roadside Unit
  77.   4.7 Automobile, BY Vehicle Type (USD Million)
  78.     4.7.1 Passenger Car
  79.     4.7.2 Commercial Vehicle
  80. 5 SECTION V: COMPETITIVE ANALYSIS
  81.   5.1 Competitive Landscape
  82.     5.1.1 Overview
  83.     5.1.2 Competitive Analysis
  84.     5.1.3 Market share Analysis
  85.     5.1.4 Major Growth Strategy in the Automobile
  86.     5.1.5 Competitive Benchmarking
  87.     5.1.6 Leading Players in Terms of Number of Developments in the Automobile
  88.     5.1.7 Key developments and growth strategies
  89.       5.1.7.1 New Product Launch/Service Deployment
  90.       5.1.7.2 Merger & Acquisitions
  91.       5.1.7.3 Joint Ventures
  92.     5.1.8 Major Players Financial Matrix
  93.       5.1.8.1 Sales and Operating Income
  94.       5.1.8.2 Major Players R&D Expenditure. 2023
  95.   5.2 Company Profiles
  96.     5.2.1 Qualcomm (US)
  97.       5.2.1.1 Financial Overview
  98.       5.2.1.2 Products Offered
  99.       5.2.1.3 Key Developments
  100.       5.2.1.4 SWOT Analysis
  101.       5.2.1.5 Key Strategies
  102.     5.2.2 NXP Semiconductors (NL)
  103.       5.2.2.1 Financial Overview
  104.       5.2.2.2 Products Offered
  105.       5.2.2.3 Key Developments
  106.       5.2.2.4 SWOT Analysis
  107.       5.2.2.5 Key Strategies
  108.     5.2.3 Cohda Wireless (AU)
  109.       5.2.3.1 Financial Overview
  110.       5.2.3.2 Products Offered
  111.       5.2.3.3 Key Developments
  112.       5.2.3.4 SWOT Analysis
  113.       5.2.3.5 Key Strategies
  114.     5.2.4 Ericsson (SE)
  115.       5.2.4.1 Financial Overview
  116.       5.2.4.2 Products Offered
  117.       5.2.4.3 Key Developments
  118.       5.2.4.4 SWOT Analysis
  119.       5.2.4.5 Key Strategies
  120.     5.2.5 Intel (US)
  121.       5.2.5.1 Financial Overview
  122.       5.2.5.2 Products Offered
  123.       5.2.5.3 Key Developments
  124.       5.2.5.4 SWOT Analysis
  125.       5.2.5.5 Key Strategies
  126.     5.2.6 Daimler AG (DE)
  127.       5.2.6.1 Financial Overview
  128.       5.2.6.2 Products Offered
  129.       5.2.6.3 Key Developments
  130.       5.2.6.4 SWOT Analysis
  131.       5.2.6.5 Key Strategies
  132.     5.2.7 Toyota Motor Corporation (JP)
  133.       5.2.7.1 Financial Overview
  134.       5.2.7.2 Products Offered
  135.       5.2.7.3 Key Developments
  136.       5.2.7.4 SWOT Analysis
  137.       5.2.7.5 Key Strategies
  138.     5.2.8 Ford Motor Company (US)
  139.       5.2.8.1 Financial Overview
  140.       5.2.8.2 Products Offered
  141.       5.2.8.3 Key Developments
  142.       5.2.8.4 SWOT Analysis
  143.       5.2.8.5 Key Strategies
  144.     5.2.9 Volkswagen AG (DE)
  145.       5.2.9.1 Financial Overview
  146.       5.2.9.2 Products Offered
  147.       5.2.9.3 Key Developments
  148.       5.2.9.4 SWOT Analysis
  149.       5.2.9.5 Key Strategies
  150.   5.3 Appendix
  151.     5.3.1 References
  152.     5.3.2 Related Reports
  153. 6 LIST OF FIGURES
  154.   6.1 MARKET SYNOPSIS
  155.   6.2 RUSSIA MARKET ANALYSIS BY TECHNOLOGY
  156.   6.3 RUSSIA MARKET ANALYSIS BY COMPONENT
  157.   6.4 RUSSIA MARKET ANALYSIS BY COMMUNICATION TYPE
  158.   6.5 RUSSIA MARKET ANALYSIS BY PROPULSION
  159.   6.6 RUSSIA MARKET ANALYSIS BY CONNECTIVITY
  160.   6.7 RUSSIA MARKET ANALYSIS BY UNIT TYPE
  161.   6.8 RUSSIA MARKET ANALYSIS BY VEHICLE TYPE
  162.   6.9 KEY BUYING CRITERIA OF AUTOMOBILE
  163.   6.10 RESEARCH PROCESS OF MRFR
  164.   6.11 DRO ANALYSIS OF AUTOMOBILE
  165.   6.12 DRIVERS IMPACT ANALYSIS: AUTOMOBILE
  166.   6.13 RESTRAINTS IMPACT ANALYSIS: AUTOMOBILE
  167.   6.14 SUPPLY / VALUE CHAIN: AUTOMOBILE
  168.   6.15 AUTOMOBILE, BY TECHNOLOGY, 2024 (% SHARE)
  169.   6.16 AUTOMOBILE, BY TECHNOLOGY, 2024 TO 2035 (USD Million)
  170.   6.17 AUTOMOBILE, BY COMPONENT, 2024 (% SHARE)
  171.   6.18 AUTOMOBILE, BY COMPONENT, 2024 TO 2035 (USD Million)
  172.   6.19 AUTOMOBILE, BY COMMUNICATION TYPE, 2024 (% SHARE)
  173.   6.20 AUTOMOBILE, BY COMMUNICATION TYPE, 2024 TO 2035 (USD Million)
  174.   6.21 AUTOMOBILE, BY PROPULSION, 2024 (% SHARE)
  175.   6.22 AUTOMOBILE, BY PROPULSION, 2024 TO 2035 (USD Million)
  176.   6.23 AUTOMOBILE, BY CONNECTIVITY, 2024 (% SHARE)
  177.   6.24 AUTOMOBILE, BY CONNECTIVITY, 2024 TO 2035 (USD Million)
  178.   6.25 AUTOMOBILE, BY UNIT TYPE, 2024 (% SHARE)
  179.   6.26 AUTOMOBILE, BY UNIT TYPE, 2024 TO 2035 (USD Million)
  180.   6.27 AUTOMOBILE, BY VEHICLE TYPE, 2024 (% SHARE)
  181.   6.28 AUTOMOBILE, BY VEHICLE TYPE, 2024 TO 2035 (USD Million)
  182.   6.29 BENCHMARKING OF MAJOR COMPETITORS
  183. 7 LIST OF TABLES
  184.   7.1 LIST OF ASSUMPTIONS
  185.     7.1.1
  186.   7.2 Russia MARKET SIZE ESTIMATES; FORECAST
  187.     7.2.1 BY TECHNOLOGY, 2025-2035 (USD Million)
  188.     7.2.2 BY COMPONENT, 2025-2035 (USD Million)
  189.     7.2.3 BY COMMUNICATION TYPE, 2025-2035 (USD Million)
  190.     7.2.4 BY PROPULSION, 2025-2035 (USD Million)
  191.     7.2.5 BY CONNECTIVITY, 2025-2035 (USD Million)
  192.     7.2.6 BY UNIT TYPE, 2025-2035 (USD Million)
  193.     7.2.7 BY VEHICLE TYPE, 2025-2035 (USD Million)
  194.   7.3 PRODUCT LAUNCH/PRODUCT DEVELOPMENT/APPROVAL
  195.     7.3.1
  196.   7.4 ACQUISITION/PARTNERSHIP
  197.     7.4.1

Russia Automobile Market Segmentation

Automobile By Technology (USD Million, 2025-2035)

  • Automated Driver Assistance
  • Intelligent Traffic System
  • Emergency Vehicle Notification
  • Passenger Information System
  • Fleet & Asset Management
  • Parking Management System
  • Line of Sight
  • Non-line of Sight
  • Others

Automobile By Component (USD Million, 2025-2035)

  • Hardware
  • Software

Automobile By Communication Type (USD Million, 2025-2035)

  • V2C
  • V2D
  • V2G
  • V2P
  • V2V
  • V2I

Automobile By Propulsion (USD Million, 2025-2035)

  • Electric Vehicle (EV)
  • ICE Vehicle

Automobile By Connectivity (USD Million, 2025-2035)

  • DSRC
  • Cellular

Automobile By Unit Type (USD Million, 2025-2035)

  • Onboard Unit
  • Roadside Unit

Automobile By Vehicle Type (USD Million, 2025-2035)

  • Passenger Car
  • Commercial Vehicle

Compare Licence

×
Features License Type
Single User Multiuser License Enterprise User
Price $4,950 $5,950 $7,250
Maximum User Access Limit 1 User Upto 10 Users Unrestricted Access Throughout the Organization
Free Customization
Direct Access to Analyst
Deliverable Format
Platform Access
Discount on Next Purchase 10% 15% 15%
Printable Versions