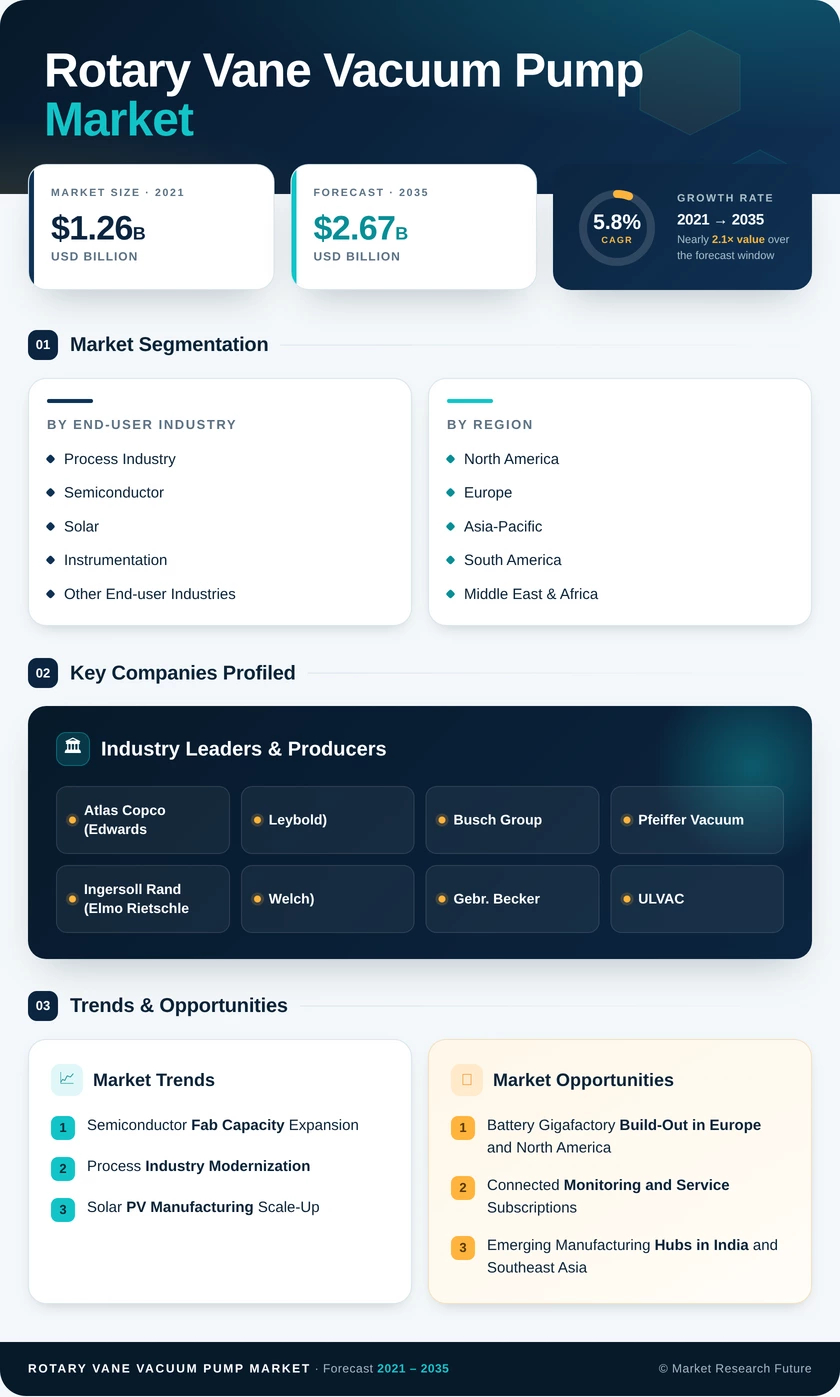
Rotary Vane Vacuum Pump Market (2026 - 2035)

ID: MRFR/Equip/41196-HCR 200 Pages Snehal Singh Last Updated: October 22, 2026
Rotary Vane Vacuum Pump Market Research Report By End-user Industry (Process Industry, Semiconductor, Solar, Instrumentation, Other End-user Industries) and By Regional (North America, Europe, South America, Asia-Pacific, Middle East and Africa) - Growth & Industry Forecast to 2035
Rotary Vane Vacuum Pump Market
Market Size
Forecast Period2026-2035
CAGR (2026-2035)5.8%
2025 Market SizeUSD 1.52 Billion
2035 Market SizeUSD 2.67 Billion
Key Players
Atlas Copco (Edwards
Leybold)
Busch Group
Pfeiffer Vacuum
Ingersoll Rand (Elmo Rietschle
Welch)
Opportunities
  • Battery Gigafactory Build-Out in Europe and North America
  • Connected Monitoring and Service Subscriptions
  • Emerging Manufacturing Hubs in India and Southeast Asia
  1. 1 Market Summary | |
  2. 2 Key Report Takeaways | |
    1. 2.1 By End-user Industry | |
    2. 2.2 By Region | |
  3. 3 Market Size and Forecast (2021–2035) | |
  4. 4 Driver Impact Analysis | |
    1. 4.1 Semiconductor Fab Capacity Expansion | |
    2. 4.2 Process Industry Modernization | |
    3. 4.3 Solar PV Manufacturing Scale-Up | |
    4. 4.4 Lithium-Ion Battery Production | |
    5. 4.5 Analytical and Laboratory Instrumentation Demand | |
    6. 4.6 Energy-Efficiency Regulation and Replacement Cycles | |
  5. 5 Restraints Impact Analysis | |
    1. 5.1 Substitution by Dry Pump Technologies | |
    2. 5.2 Oil Handling and Disposal Compliance | |
    3. 5.3 Semiconductor Demand Cyclicality | |
    4. 5.4 Maintenance and Total Cost of Ownership | |
    5. 5.5 Price Competition from Low-Cost Producers | |
  6. 6 Opportunities | |
    1. 6.1 Battery Gigafactory Build-Out in Europe and North America | |
    2. 6.2 Connected Monitoring and Service Subscriptions | |
    3. 6.3 Emerging Manufacturing Hubs in India and Southeast Asia | |
    4. 6.4 Remanufacturing and Oil Regeneration Services | |
  7. 7 Regional Market Share and Country-Level Analysis | |
    1. 7.1 North America | | |
      1. 7.1.1 United States | | |
      2. 7.1.2 Canada | | |
      3. 7.1.3 Mexico | |
    2. 7.2 Europe | | |
      1. 7.2.1 Germany | | |
      2. 7.2.2 UK | | |
      3. 7.2.3 France | | |
      4. 7.2.4 Italy | | |
      5. 7.2.5 Spain | | |
      6. 7.2.6 Nordic Countries | | |
      7. 7.2.7 Russia | | |
      8. 7.2.8 Rest of Europe | |
    3. 7.3 Asia-Pacific | | |
      1. 7.3.1 China | | |
      2. 7.3.2 Japan | | |
      3. 7.3.3 South Korea | | |
      4. 7.3.4 Rest of Asia-Pacific | |
    4. 7.4 South America | | |
      1. 7.4.1 Brazil | | |
      2. 7.4.2 Argentina | | |
      3. 7.4.3 Rest of South America | |
    5. 7.5 Middle East & Africa | | |
      1. 7.5.1 Saudi Arabia | | |
      2. 7.5.2 UAE | | |
      3. 7.5.3 South Africa | | |
      4. 7.5.4 Egypt | | |
      5. 7.5.5 Rest of Middle East & Africa | |
  8. 8 Future Outlook (2026–2035) | |
    1. 8.1 Predictive Maintenance and Connected Pumps | |
    2. 8.2 Energy Efficiency as a Purchasing Criterion | |
    3. 8.3 Semiconductor and Battery Capacity Cycles | |
    4. 8.4 Sustainability, Oil Stewardship and ESG Reporting | |
  9. 9 Segmentation Analysis | |
    1. 9.1 By End-user Industry | | |
      1. 9.1.1 Process Industry | | |
      2. 9.1.2 Semiconductor | | |
      3. 9.1.3 Solar | | |
      4. 9.1.4 Instrumentation | | |
      5. 9.1.5 Other End-user Industries | |
  10. 10 Competitive Landscape | |
  11. 11 Recent News & Developments | |
  12. 12 Report Scope and Methodology | |
  13. 13 Detailed Sources and Citations | |
  14. 14 Frequently Asked Questions (FAQs) | | LIST OF TABLES | |
  15. TABLE 1 Market Snapshot, 2025–2035 | |
  16. TABLE 2 Global Market Size & Forecast, by Revenue (USD Billion), 2021–2035 | |
  17. TABLE 3 Driver Impact Analysis, 2026–2035 | |
  18. TABLE 4 Restraints Impact Analysis, 2026–2035 | |
  19. TABLE 5 Regional Summary, 2025 | |
  20. TABLE 6 North America Market, by Country, 2025 | |
  21. TABLE 7 Europe Market, by Country, 2025 | |
  22. TABLE 8 Asia-Pacific Market, by Country, 2025 | |
  23. TABLE 9 South America Market, by Country, 2025 | |
  24. TABLE 10 Middle East & Africa Market, by Country, 2025 | |
  25. TABLE 11 Global Market, by End-user Industry, 2025 | |
  26. TABLE 12 North America Market, by End-user Industry, 2021–2035 (USD Billion) | |
  27. TABLE 13 Europe Market, by End-user Industry, 2021–2035 (USD Billion) | |
  28. TABLE 14 Asia-Pacific Market, by End-user Industry, 2021–2035 (USD Billion) | |
  29. TABLE 15 South America Market, by End-user Industry, 2021–2035 (USD Billion) | |
  30. TABLE 16 Middle East & Africa Market, by End-user Industry, 2021–2035 (USD Billion) | |
  31. TABLE 17 Competitive Benchmarking Matrix, 2025 | |
  32. TABLE 18 Report Scope and Methodology | |
  33. TABLE 19 Detailed Sources and Citations | | LIST OF FIGURES | |
  34. FIGURE 1 Market Dynamics Overview (Drivers, Restraints, Opportunities) | |
  35. FIGURE 2 Industry Value Chain Analysis | |
  36. FIGURE 3 Porter's Five Forces Analysis | |
  37. FIGURE 4 Global Market Size Trend, 2021–2035 (USD Billion) | |
  38. FIGURE 5 Market Share by End-user Industry, 2025 | |
  39. FIGURE 6 Market Growth by End-user Industry, 2026–2035 | |
  40. FIGURE 7 Regional Market Share, 2025 | |
  41. FIGURE 8 Regional Growth Comparison, 2026–2035 | |
  42. FIGURE 9 Asia-Pacific Country Share, 2025 | |
  43. FIGURE 10 Competitive Positioning Matrix, 2025 | |
  44. FIGURE 11 Estimated Revenue Share Ranges of Key Players, 2025

Segmentation Quick Reference

DimensionSub-SegmentsDominant SegmentFastest Growing Segment
By End-user IndustryProcess Industry; Semiconductor; Solar; Instrumentation; Other End-user IndustriesProcess Industry (37.0% share)Semiconductor (7.4% CAGR)
By RegionNorth America; Europe; Asia-Pacific; South America; Middle East & AfricaNorth America (34.0% share)Asia-Pacific (7.1% CAGR)

Market Segmentation Overview

By End-user Industry

Sub-SegmentKey Trend
Process IndustryTwo-stage, inverter-driven pumps replacing fixed-speed units in chemical and pharmaceutical plants
SemiconductorLoad lock, metrology, and back-end packaging demand tied to CHIPS and EU Chips Act fabs
SolarLaminator and crystal growth backing duties scaling with PV module capacity
InstrumentationCompact, low-noise backing pumps for mass spectrometers and electron microscopes
Other End-user IndustriesBattery electrolyte filling, HVAC service, and research laboratory use

Process Industry leads this dimension with a 37.0% share because chemical distillation, pharmaceutical drying, and food packaging tolerate oil-lubricated designs and reward their low cost per unit of pumping speed. Semiconductor grows fastest at a 7.4% CAGR, as subsidized fab and packaging capacity creates large, concentrated orders for load lock and backing pumps. Solar and Instrumentation sit between the two, with Solar tracking PV lamination capacity and Instrumentation following laboratory refresh cycles.


Download PDF ×

We do not share your information with anyone. However, we may send you emails based on your report interest from time to time. You may contact us at any time to opt-out.