ID: MRFR/CR/5776-HCR | February 2021 | Region: Global | 90 pages
Market Scenario
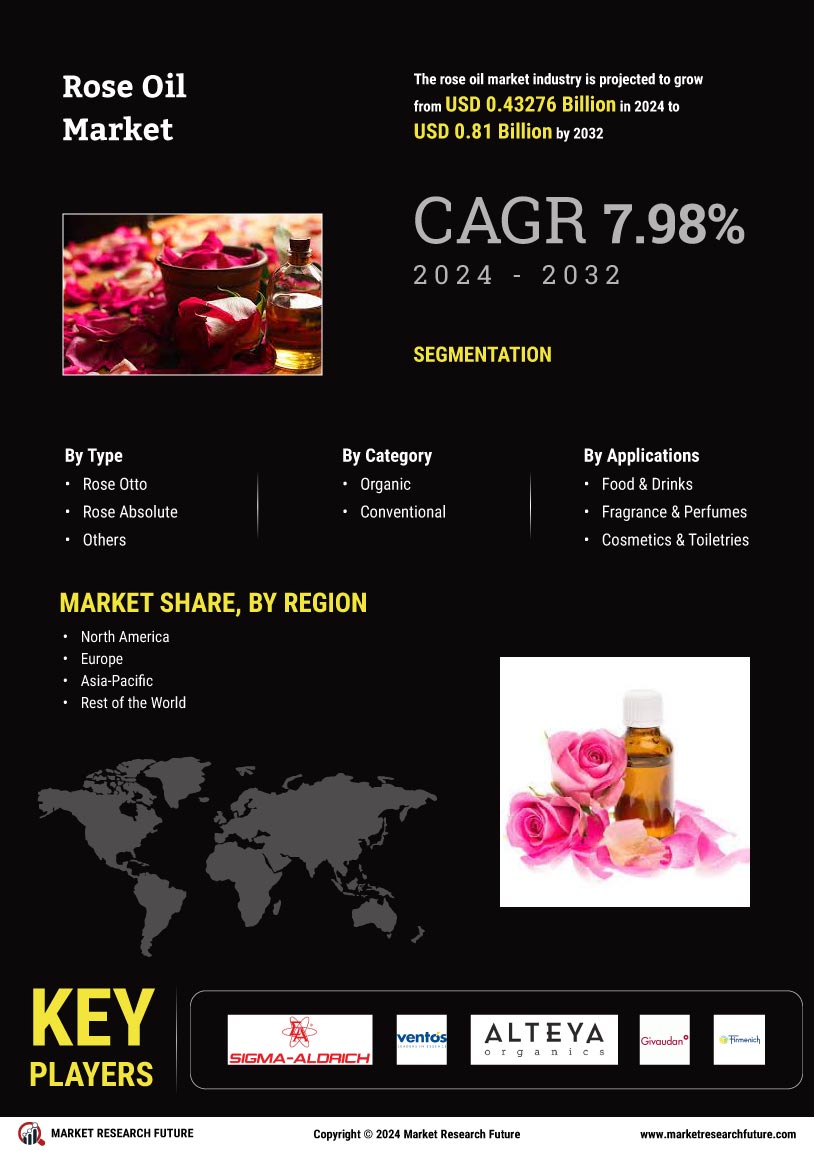
Rose Oil Market is witnessing a high growth in the cosmetics & toiletries and food & beverage industry due its fragrance and therapeutic effect. Rose oil has gained popularity and is used in various applications, due to its high beneficial properties. The market is experiencing a rise in its growth owing to the increasing usage of rose oil in different creams and massage oils, as it is helps in calming and rejuvenating the skin. Rose oil helps maintain the digestive system and improve the function of the liver. It also prevents viral and bacterial infections that occur internally as well as externally.
The market players are focusing on their R&D activities to launch new and innovative products using rose oil, as there is an increasing demand for the rose oil due to its enchanting and appealing smell. In addition, the players are also focusing on making such products accessible and visible to the customers across the globe, owing to its astringent and soothing effects. Moreover, rose oil works as an emmenagogue, and it helps to stimulate menstrual cycle and helps reducing issues of premenstrual syndrome, such as nausea, vomiting, abdominal cramps and weakness.
Segmentation
The global rose oil market has been segmented based on type, category, application, and region.
By type, the global market has been classified into rose otto, rose absolute and others.
Based on category, the market is segregated as organic and conventional.
By application, the market is categorized into food & beverages, fragrances & perfumes, cosmetics & toiletries, and others.
The global rose oil market has been studied with regard to four key regions—North America, Europe, Asia-Pacific, and the rest of the world.
The North American rose oil market has further been segmented into the US, Canada, and Mexico. The European rose oil industry has been classified as the UK, Germany, France, Italy, Spain, and the rest of Europe. Asia-Pacific has been divided into China, India, Japan, Australia and New Zealand, and the rest of Asia-Pacific. The rose oil market in the rest of the world has been segmented into South America, the Middle East, and Africa.
Regional Market Summary
Global Rose Oil Market Share (%), by Region, 2017
Source: Secondary Sources and MRFR Analysis
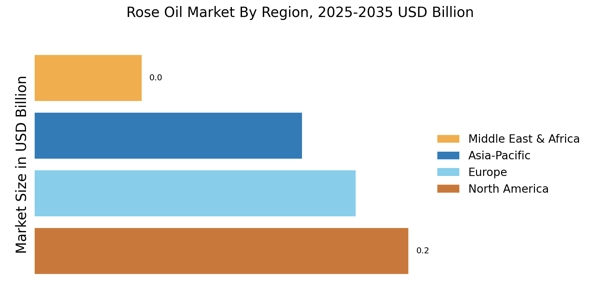
Europe is expected to dominate the rose oil market during the forecast period. The region’s dominance can be attributed to various factors such as the presence of several rose oil manufacturers and increasing awareness regarding health benefits of rose oil among consumers. Rose oil provides several health benefits, which leads to its usage in treating inflammation and infections, improving digestion and stimulating the blood circulation. Increasing usage of rose oil in cosmetics, fragrances and food & beverage in Asia-Pacific is expected to render a significant share of the market to Asia-Pacific during the upcoming years. However, North America is anticipated to register the highest CAGR due higher inclination of consumers towards trying new products, as the awareness about health benefits of rose oil is increasing.
Global Rose Oil Market, by Type
Global Rose Oil Market, by Category
Global Rose Oil Market, by Mode of Application
Global Rose Oil Market, by Region
Key Players in the Rose Oil Market
Intended Audience
TABLE OF CONTENTS
1 Executive Summary
2 Scope of the Report
2.1 Market Definition
2.2 Scope of the Study
2.2.1 Research Objectives
2.2.2 Assumptions & Limitations
2.3 Markets Structure
3 Market Research Methodology
3.1 Research Function
3.2 Secondary Research
3.3 Primary Research
3.4 Forecast Model
4 Market Landscape
4.1 Supply Chain Analysis
4.1.1 Raw Material Suppliers
4.1.2 Manufacturers/Producers
4.1.3 Distributors/Retailers/Wholesalers/E-Commerce
4.1.4 End Users
4.2 Porter’s Five Forces Analysis
4.2.1 Threat of New Entrants
4.2.2 Bargaining Power of Buyers
4.2.3 Bargaining Power of Suppliers
4.2.4 Threat of Substitutes
4.2.5 Internal Rivalry
5 Market Dynamics of Global Rose Oil Market
5.1 Introduction
5.2 Drivers
5.3 Restraints
5.4 Opportunities
5.5 Challenges
6. Global Rose Oil Market, by Type
6.1 Introduction
6.2 Rose Otto
6.2.1 Market Estimates & Forecast, 2018–2023
6.2.2 Market Estimates & Forecast, by Region, 2018–2023
6.3 Rose Absolute
6.3.1 Market Estimates & Forecast, 2018–2023
6.3.2 Market Estimates & Forecast, by Region, 2018–2023
6.4 Others
6.4.1 Market Estimates & Forecast, 2018–2023
6.4.2 Market Estimates & Forecast, by Region, 2018–2023
7. Global Rose Oil Market, by Category
7.1 Introduction
7.2 Conventional
7.2.1 Market Estimates & Forecast, 2018–2023
7.2.2 Market Estimates & Forecast, by Region, 2018–2023
7.3 Organic
7.3.1 Market Estimates & Forecast, 2018–2023
7.3.2 Market Estimates & Forecast, by Region, 2018–2023
8. Global Rose Oil Market, by Application
8.1 Introduction
8.2 Food & Beverage
8.2.1 Market Estimates & Forecast, 2018–2023
8.2.2 Market Estimates & Forecast, by Region, 2018–2023
8.3 Fragrances & Perfumes
8.3.1 Market Estimates & Forecast, 2018–2023
8.3.2 Market Estimates & Forecast, by Region, 2018–2023
8.4 Cosmetics & Toiletries
8.4.1 Market Estimates & Forecast, 2018–2023
8.4.2 Market Estimates & Forecast, by Region, 2018–2023
8.5 Others
8.5.1 Market Estimates & Forecast, 2018–2023
8.5.2 Market Estimates & Forecast, by Region, 2018–2023
9. Global Rose Oil Market, by Region
9.1 Introduction
9.2 North America
9.2.1 Market Estimates & Forecast, 2018–2023
9.2.2 Market Estimates & Forecast, by Type, 2018–2023
9.2.3 Market Estimates & Forecast, by Category, 2018–2023
9.2.4 Market Estimates & Forecast, by Application, 2018–2023
9.2.5 US
9.2.5.1 Market Estimates & Forecast, 2018–2023
9.2.5.2 Market Estimates & Forecast, by Type, 2018–2023
9.2.5.3 Market Estimates & Forecast, by Category, 2018–2023
9.2.5.4 Market Estimates & Forecast, by Application, 2018–2023
9.2.6 Canada
9.2.6.1 Market Estimates & Forecast, 2018–2023
9.2.6.2 Market Estimates & Forecast, by Type, 2018–2023
9.2.6.3 Market Estimates & Forecast, by Category, 2018–2023
9.2.6.4 Market Estimates & Forecast, by Application, 2018–2023
9.2.7 Mexico
9.2.7.1 Market Estimates & Forecast, 2018–2023
9.2.7.2 Market Estimates & Forecast, by Type, 2018–2023
9.2.7.3 Market Estimates & Forecast, by Category, 2018–2023
9.2.7.4 Market Estimates & Forecast, by Application, 2018–2023
9.3 Europe
9.3.1 Market Estimates & Forecast, 2018–2023
9.3.2 Market Estimates & Forecast, by Type, 2018–2023
9.2.3 Market Estimates & Forecast, by Category, 2018–2023
9.3.4 Market Estimates & Forecast, by Application, 2018–2023
9.3.5 Germany
9.3.5.1 Market Estimates & Forecast, 2018–2023
9.3.5.2 Market Estimates & Forecast, by Type, 2018–2023
9.2.5.3 Market Estimates & Forecast, by Category, 2018–2023
9.3.5.4 Market Estimates & Forecast, by Application, 2018–2023
9.3.6. France
9.3.6.1 Market Estimates & Forecast, 2018–2023
9.3.6.2 Market Estimates & Forecast, by Type, 2018–2023
9.3.6.3 Market Estimates & Forecast, by Category, 2018–2023
9.3.6.4 Market Estimates & Forecast, by Application, 2018–2023
9.3.7 Italy
9.3.7.1 Market Estimates & Forecast, 2018–2023
9.3.7.2 Market Estimates & Forecast, by Type, 2018–2023
9.3.7.3 Market Estimates & Forecast, by Category, 2018–2023
9.3.7.4 Market Estimates & Forecast, by Application, 2018–2023
9.3.8 Spain
9.3.8.1 Market Estimates & Forecast, 2018–2023
9.3.8.2 Market Estimates & Forecast, by Type, 2018–2023
9.3.8.3 Market Estimates & Forecast, by Category, 2018–2023
9.3.8.4 Market Estimates & Forecast, by Application, 2018–2023 9.3.9 UK
9.3.9.1 Market Estimates & Forecast, 2018–2023
9.3.9.2 Market Estimates & Forecast, by Type, 2018–2023
9.3.9.3 Market Estimates & Forecast, by Category, 2018–2023
9.3.9.4 Market Estimates & Forecast, by Application, 2018–2023
9.3.10 Rest of Europe
9.3.10.1 Market Estimates & Forecast, 2018–2023
9.3.10.2 Market Estimates & Forecast, by Type, 2018–2023
9.3.10.3 Market Estimates & Forecast, by Category, 2018–2023
9.3.10.4 Market Estimates & Forecast, by Application, 2018–2023
9.4 Asia-Pacific
9.4.1 Market Estimates & Forecast, 2018–2023
9.4.2 Market Estimates & Forecast, by Type, 2018–2023
9.4.3 Market Estimates & Forecast, by Category, 2018–2023
9.4.4 Market Estimates & Forecast, by Application, 2018–2023
9.4.5 China
9.4.5.1 Market Estimates & Forecast, 2018–2023
9.4.5.2 Market Estimates & Forecast, by Type, 2018–2023
9.4.5.3 Market Estimates & Forecast, by Category, 2018–2023
9.4.5.4 Market Estimates & Forecast, by Application, 2018–2023
9.4.6 India
9.4.6.1 Market Estimates & Forecast, 2018–2023
9.4.6.2 Market Estimates & Forecast, by Type, 2018–2023
9.4.6.3 Market Estimates & Forecast, by Category, 2018–2023
9.4.6.4 Market Estimates & Forecast, by Application, 2018–2023
9.4.7 Japan
9.4.7.1 Market Estimates & Forecast, 2018–2023
9.4.7.2 Market Estimates & Forecast, by Type, 2018–2023
9.4.7.3 Market Estimates & Forecast, by Category, 2018–2023
9.4.7.3 Market Estimates & Forecast, by Application, 2018–2023
9.4.8 Australia & New Zealand
9.4.8.1 Market Estimates & Forecast, 2018–2023
9.4.8.2 Market Estimates & Forecast, by Type, 2018–2023
9.4.8.4 Market Estimates & Forecast, by Category, 2018–2023
9.4.8.3 Market Estimates & Forecast, by Application, 2018–2023
9.4.9 Rest of Asia-Pacific
9.4.9.1 Market Estimates & Forecast, 2018–2023
9.4.9.2 Market Estimates & Forecast, by Type, 2018–2023
9.4.9.3 Market Estimates & Forecast, by Category, 2018–2023
9.4.9.4 Market Estimates & Forecast, by Application, 2018–2023
9.5 Rest of the World (RoW)
9.5.1 Market Estimates & Forecast, 2018–2023
9.5.2 Market Estimates & Forecast, by Type, 2018–2023
9.5.3 Market Estimates & Forecast, by Category, 2018–2023
9.5.4 Market Estimates & Forecast, by Application, 2018–2023
9.5.5 South America
9.5.5.1 Market Estimates & Forecast, 2018–2023
9.5.5.2 Market Estimates & Forecast, by Type, 2018–2023
9.5.5.3 Market Estimates & Forecast, by Category, 2018–2023
9.5.5.4 Market Estimates & Forecast, by Application, 2018–2023
9.5.6 Middle East
9.5.6.1 Market Estimates & Forecast, 2018–2023
9.5.6.2 Market Estimates & Forecast, by Type, 2018–2023
9.5.6.3 Market Estimates & Forecast, by Category, 2018–2023
9.5.6.4 Market Estimates & Forecast, by Application, 2018–2023
9.5.7 Africa
9.5.7.1 Market Estimates & Forecast, 2018–2023
9.5.7.2 Market Estimates & Forecast, by Type, 2018–2023
9.5.7.3 Market Estimates & Forecast, by Category, 2018–2023
9.5.7.4 Market Estimates & Forecast, by Application, 2018–2023
10. Company Landscape
10.1 Introduction
10.2 Market Strategy
10.3 Key Development Analysis
(Expansions/ Mergers and Acquisitions/ Joint Ventures/ New Product Developments/ Agreements/ Investments
11. Company Profiles
11.1 Sigma-Aldrich, Inc.
11.1.1 Company Overview
11.1.2 Financial Updates
11.1.3 Product/Business Segment Overview
11.1.4 Strategy
11.1.5 Key Developments
11.1.6 SWOT Analysis
11.2 Ernesto Ventos SA
11.2.1 Company Overview
11.2.2 Financial Updates
11.2.3 Product/Business Segment Overview
11.2.4 Strategy
11.2.5 Key Developments
11.2.6 SWOT Analysis
11.3 Alteya Organics, LLC
11.3.1 Company Overview
11.3.2 Financial Updates
11.3.3 Product/Business Segment Overview
11.3.4 Strategy
11.3.5 Key Developments
11.3.6 SWOT Analysis
11.4 Givaudan SA
11.4.1 Company Overview
11.4.2 Financial Updates
11.4.3 Product/Business Segment Overview
11.4.4 Strategy
11.4.5 Key Developments
11.4.6 SWOT Analysis
11.5 Firmenich International SA
11.5.1 Company Overview
11.5.2 Financial Updates
11.5.3 Product/Business Segment Overview
11.5.4 Strategy
11.5.5 Key Developments
11.5.6 SWOT Analysis
11.6 Symrise AG
11.6.1 Company Overview
11.6.2 Financial Updates
11.6.3 Product/Business Segment Overview
11.6.4 Strategy
11.6.5 Key Developments
11.6.6 SWOT Analysis
11.7 V. MANE FILS SA
11.7.1 Company Overview
11.7.2 Financial Updates
11.7.3 Product/Business Segment Overview
11.7.4 Strategy
11.7.5 Key Developments
11.7.6 SWOT Analysis
11.8 Robertet SA
11.8.1 Company Overview
11.8.2 Financial Updates
11.8.3 Product/Business Segment Overview
11.8.4 Strategy
11.8.5 Key Developments
11.8.6 SWOT Analysis
11.9 International Flavors & Fragrances Inc.
11.9.1 Company Overview
11.9.2 Financial Updates
11.9.3 Product/Business Segment Overview
11.9.4 Strategy
11.9.5 Key Developments
11.9.6 SWOT Analysis
11.10 BERJÉ INC.
11.10.1 Company Overview
11.10.2 Financial Updates
11.10.3 Product/Business Segment Overview
11.10.4 Strategy
11.10.5 Key Developments
11.10.6 SWOT Analysis
12. Conclusion
LIST OF TABLES
Table 1 Global Rose Oil Market, by Region, 2018–2023 (USD Million)
Table 2 Global Rose Oil Market, by Product Type, 2018–2023 (USD Million)
Table 3 Global Rose Oil Market, by Category, 2018–2023 (USD Million)
Table 4 Global Rose Oil Market, by Application, 2018–2023 (USD Million)
Table 5 North America: Rose Oil Market, by Country, 2018–2023 (USD Million)
Table 6 North America: Rose Oil Market, by Product Type, 2018–2023 (USD Million)
Table 7 North America: Rose Oil Market, by Category, 2018–2023 (USD Million)
Table 8 North America: Rose Oil Market, by Application, 2018–2023 (USD Million)
Table 9 US: Rose Oil Market, by Product Type, 2018–2023 (USD Million)
Table 10 US: Rose Oil Market, by Category, 2018–2023 (USD Million)
Table 11 US: Rose Oil Market, by Application, 2018–2023 (USD Million)
Table 12 Canada: Rose Oil Market, by Product Type, 2018–2023 (USD Million)
Table 13 Canada: Rose Oil Market, by Category, 2018–2023 (USD Million)
Table 14 Canada: Rose Oil Market, by Application, 2018–2023 (USD Million)
Table 15 Mexico: Rose Oil Market, by Product Type, 2018–2023 (USD Million)
Table 16 Mexico: Rose Oil Market, by Category, 2018–2023 (USD Million)
Table 17 Mexico: Rose Oil Market, by Application, 2018–2023 (USD Million)
Table 18 Europe: Rose Oil Market, by Country, 2018–2023 (USD Million)
Table 19 Europe: Rose Oil Market, by Product Type, 2018–2023 (USD Million)
Table 20 Europe: Rose Oil Market, by Category, 2018–2023 (USD Million)
Table 21 Europe: Rose Oil Market, by Application, 2018–2023 (USD Million)
Table 22 Germany: Rose Oil Market, by Product Type, 2018–2023 (USD Million)
Table 23 Germany: Rose Oil Market, by Category, 2018–2023 (USD Million)
Table 24 Germany: Rose Oil Market, by Application, 2018–2023 (USD Million)
Table 25 France: Rose Oil Market, by Product Type, 2018–2023 (USD Million)
Table 26 France: Rose Oil Market, by Category, 2018–2023 (USD Million)
Table 27 France: Rose Oil Market, by Application, 2018–2023 (USD Million)
Table 28 Italy: Rose Oil Market, by Product Type, 2018–2023 (USD Million)
Table 29 Italy: Rose Oil Market, by Category, 2018–2023 (USD Million)
Table 30 Italy: Rose Oil Market, by Application, 2018–2023 (USD Million)
Table 31 Spain: Rose Oil Market, by Product Type, 2018–2023 (USD Million)
Table 32 Spain: Rose Oil Market, by Category, 2018–2023 (USD Million)
Table 33 Spain: Rose Oil Market, by Application, 2018–2023 (USD Million)
Table 34 UK: Rose Oil Market, by Product Type, 2018–2023 (USD Million)
Table 35 UK: Rose Oil Market, by Category, 2018–2023 (USD Million)
Table 36 UK: Rose Oil Market, by Application, 2018–2023 (USD Million)
Table 37 Rest of Europe: Rose Oil Market, by Product Type, 2018–2023 (USD Million)
Table 38 Rest of Europe: Rose Oil Market, by Category, 2018–2023 (USD Million)
Table 39 Rest of Europe: Rose Oil Market, by Application, 2018–2023 (USD Million)
Table 40 Asia-Pacific: Rose Oil Market, by Country, 2018–2023 (USD Million)
Table 41 Asia-Pacific: Rose Oil Market, by Product Type, 2018–2023 (USD Million)
Table 42 Asia-Pacific: Rose Oil Market, by Category, 2018–2023 (USD Million)
Table 43 Asia-Pacific: Rose Oil Market, by Application, 2018–2023 (USD Million)
Table 44 China: Rose Oil Market, by Product Type, 2018–2023 (USD Million)
Table 45 China: Rose Oil Market, by Category, 2018–2023 (USD Million)
Table 46 China: Rose Oil Market, by Application, 2018–2023 (USD Million)
Table 47 India: Rose Oil Market, by Product Type, 2018–2023 (USD Million)
Table 48 India: Rose Oil Market, by Category, 2018–2023 (USD Million)
Table 49 India: Rose Oil Market, by Application, 2018–2023 (USD Million)
Table 50 Japan: Rose Oil Market, by Product Type, 2018–2023 (USD Million)
Table 51 Japan: Rose Oil Market, by Category, 2018–2023 (USD Million)
Table 52 Japan: Rose Oil Market, by Application, 2018–2023 (USD Million)
Table 53 Australia & New Zealand: Rose Oil Market, by Product Type, 2018–2023 (USD Million)
Table 54 Australia & New Zealand: Rose Oil Market, by Category, 2018–2023 (USD Million)
Table 55 Australia & New Zealand: Rose Oil Market, by Application, 2018–2023 (USD Million)
Table 56 Rest of Asia-Pacific: Rose Oil Market, by Product Type, 2018–2023 (USD Million)
Table 57 Rest of Asia-Pacific: Rose Oil Market, by Category, 2018–2023 (USD Million)
Table 58 Rest of Asia-Pacific: Rose Oil Market, by Application, 2018–2023 (USD Million)
Table 59 Rest of the World (RoW): Rose Oil Market, by Country, 2018–2023 (USD Million)
Table 60 Rest of the World (RoW): Rose Oil Market, by Product Type, 2018–2023 (USD Million)
Table 61 Rest of the World (RoW): Rose Oil Market, by Category, 2018–2023 (USD Million)
Table 62 Rest of the World (RoW): Rose Oil Market, by Application, 2018–2023 (USD Million)
Table 63 South America: Rose Oil Market, by Product Type, 2018–2023 (USD Million)
Table 64 South America: Rose Oil Market, by Category, 2018–2023 (USD Million)
Table 65 South America: Rose Oil Market, by Application, 2018–2023 (USD Million)
Table 66 Middle East: Rose Oil Market, by Product Type, 2018–2023 (USD Million)
Table 67 Middle East: Rose Oil Market, by Category, 2018–2023 (USD Million)
Table 68 Middle East: Rose Oil Market, by Application, 2018–2023 (USD Million)
Table 69 Africa: Rose Oil Market, by Product Type, 2018–2023 (USD Million)
Table 70 Africa: Rose Oil Market, by Category, 2018–2023 (USD Million)
Table 71 Africa: Rose Oil Market, by Application, 2018–2023 (USD Million)
LIST OF FIGURES
FIGURE 1 Global Rose Oil Market Segmentation
FIGURE 2 Forecast Research Methodology
FIGURE 3 Five Forces Analysis of Global Rose Oil Market
FIGURE 4 Value Chain of Global Rose Oil Market
FIGURE 5 Share of Global Rose Oil Market in 2018, by Country (%)
FIGURE 6 Global Rose Oil Market, 2018–2023
FIGURE 7 Global Rose Oil Market Size by Product Type, 2018
FIGURE 8 Share of Global Rose Oil Market, by Product Type, 2018–2023
FIGURE 9 Global Rose Oil Market Size by Category, 2018
FIGURE 10 Share of Global Rose Oil Market, by Category, 2018–2023
FIGURE 11 Global Rose Oil Market Size, by Application, 2018
FIGURE 12 Share of Global Rose Oil Market, by Application, 2018–2023