Rennet Market Segmentation
Rennet Market By Source (USD Billion, 2025-2035)
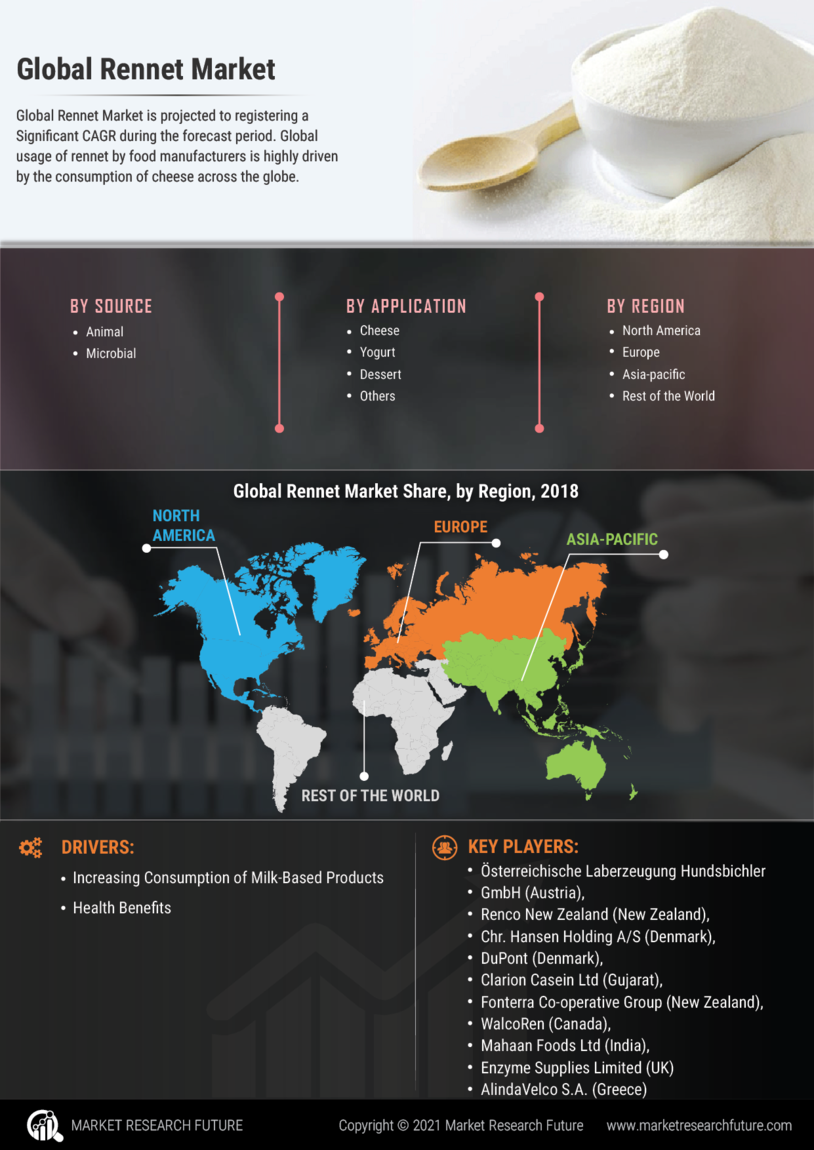
- Animal Rennet
- Microbial Rennet
- Plant-Based Rennet
Rennet Market By Application (USD Billion, 2025-2035)
- Cheese Production
- Desserts
- Processed Foods
- Confectionery
Rennet Market By Form (USD Billion, 2025-2035)
- Liquid Rennet
- Powder Rennet
- Tablet Rennet
Rennet Market By End Use (USD Billion, 2025-2035)
- Food Industry
- Pharmaceutical Industry
- Cosmetics Industry