Segmentation Quick Reference
| Dimension | Sub-Segments | Dominant Segment | Fastest Growing Segment |
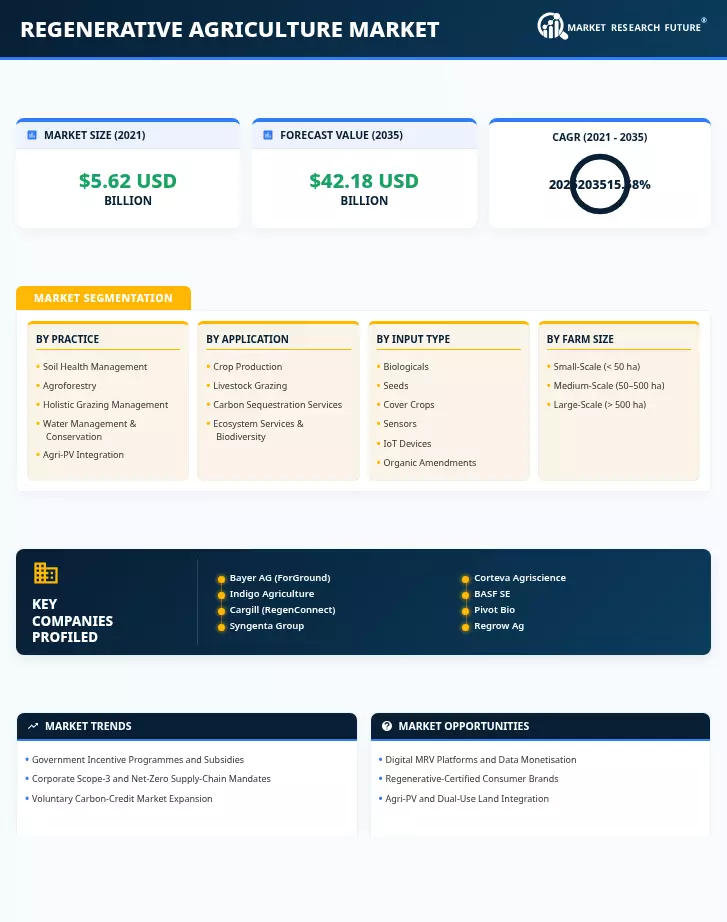
| By Practice | Soil Health Management, Agroforestry, Holistic Grazing Management, Water Management & Conservation, Agri-PV Integration | Soil Health Management | Agri-PV Integration |
| By Application | Crop Production, Livestock Grazing, Carbon Sequestration Services, Ecosystem Services & Biodiversity | Crop Production | Carbon Sequestration Services |
| By Input Type | Biologicals, Seeds and Cover Crops, Sensors and IoT Devices, Organic Amendments | Biologicals | Sensors and IoT Devices |
| By Farm Size | Small-Scale (< 50 ha), Medium-Scale (50–500 ha), Large-Scale (> 500 ha) | Small-Scale | Small-Scale |
Market Segmentation Overview
By Practice
| Sub-Segment | Key Trend |
| Soil Health Management | Regulatory mandates for cover cropping and reduced tillage are driving adoption |
| Agroforestry | Carbon-credit revenue enabling tree-based system scale-up |
| Holistic Grazing Management | Adaptive multi-paddock grazing linked to methane-reduction targets |
| Water Management & Conservation | Drought-resilience investment in arid and semi-arid regions |
| Agri-PV Integration | Dual-use land economics delivering solar + grazing revenue stacking |
Soil health management remains the backbone of regenerative transitions globally, while agri-PV integration is gaining traction as energy and agriculture converge on shared land assets.
By Application
| Sub-Segment | Key Trend |
| Crop Production | Multinational sourcing mandates embedding regenerative specs into grain and oilseed contracts |
| Livestock Grazing | Adaptive grazing and silvopasture reduce enteric methane intensity |
| Carbon Sequestration Services | Tokenised carbon marketplaces are lowering transaction barriers |
| Ecosystem Services & Biodiversity | Biodiversity-credit frameworks creating new payment streams |
Crop production commands the largest share due to sheer acreage addressability, while carbon sequestration services represent the most dynamic growth vector.
By Input Type
| Sub-Segment | Key Trend |
| Biologicals | Microbial inoculants and biostimulants replacing synthetic fertiliser inputs |
| Seeds and Cover Crops | Multi-species cover-crop mixes are gaining ground in integrated rotations |
| Sensors and IoT Devices | Real-time soil-health monitoring feeding digital MRV platforms |
| Organic Amendments | Biochar and compost blends improving soil carbon retention economics |
Biologicals dominate input spend as the economics of microbial nitrogen fixation reach cost parity with synthetic alternatives in key crop systems.
By Farm Size
| Sub-Segment | Key Trend |
| Small-Scale (< 50 ha) | Carbon-credit aggregation models enabling smallholder participation |
| Medium-Scale (50–500 ha) | Corporate contract farming embedding regenerative requirements |
| Large-Scale (> 500 ha) | Enterprise-level precision no-till and digital MRV deployment |
Small-scale farms hold both the majority share and the fastest growth trajectory, as aggregation platforms transform fragmented smallholdings into viable carbon-credit cohorts.