Semiconductor & Electronics Market Segmentation
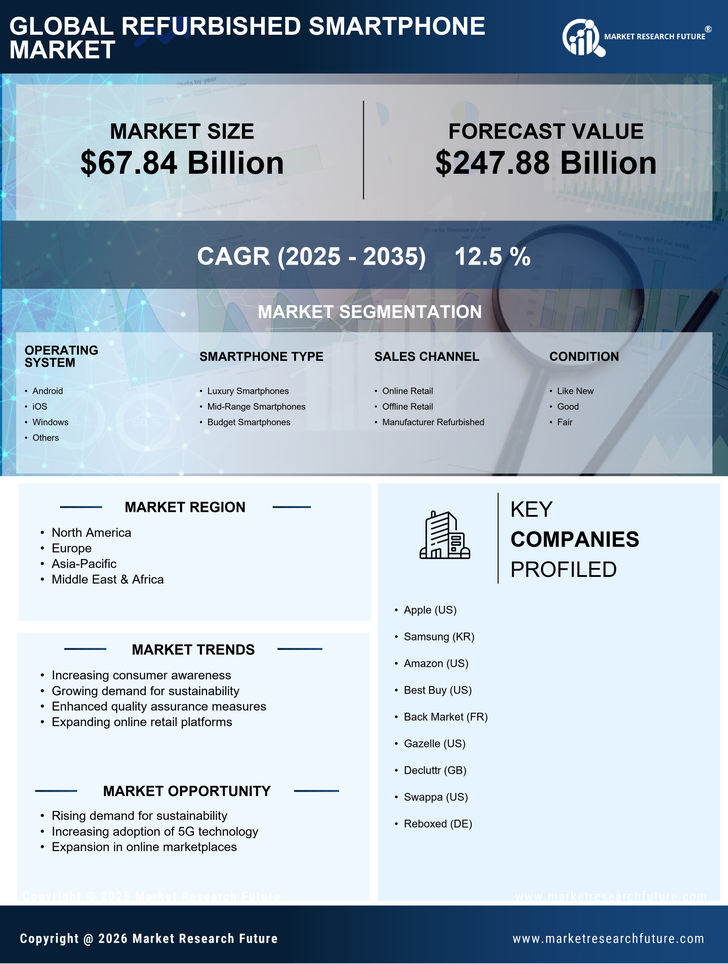
Semiconductor & Electronics By Operating System (USD Billion, 2025-2035)
- Android
- iOS
- Windows
- Others
Semiconductor & Electronics By Smartphone Type (USD Billion, 2025-2035)
- Luxury Smartphones
- Mid-Range Smartphones
- Budget Smartphones
Semiconductor & Electronics By Sales Channel (USD Billion, 2025-2035)
- Online Retail
- Offline Retail
- Manufacturer Refurbished
Semiconductor & Electronics By Condition (USD Billion, 2025-2035)
- Like New
- Good
- Fair