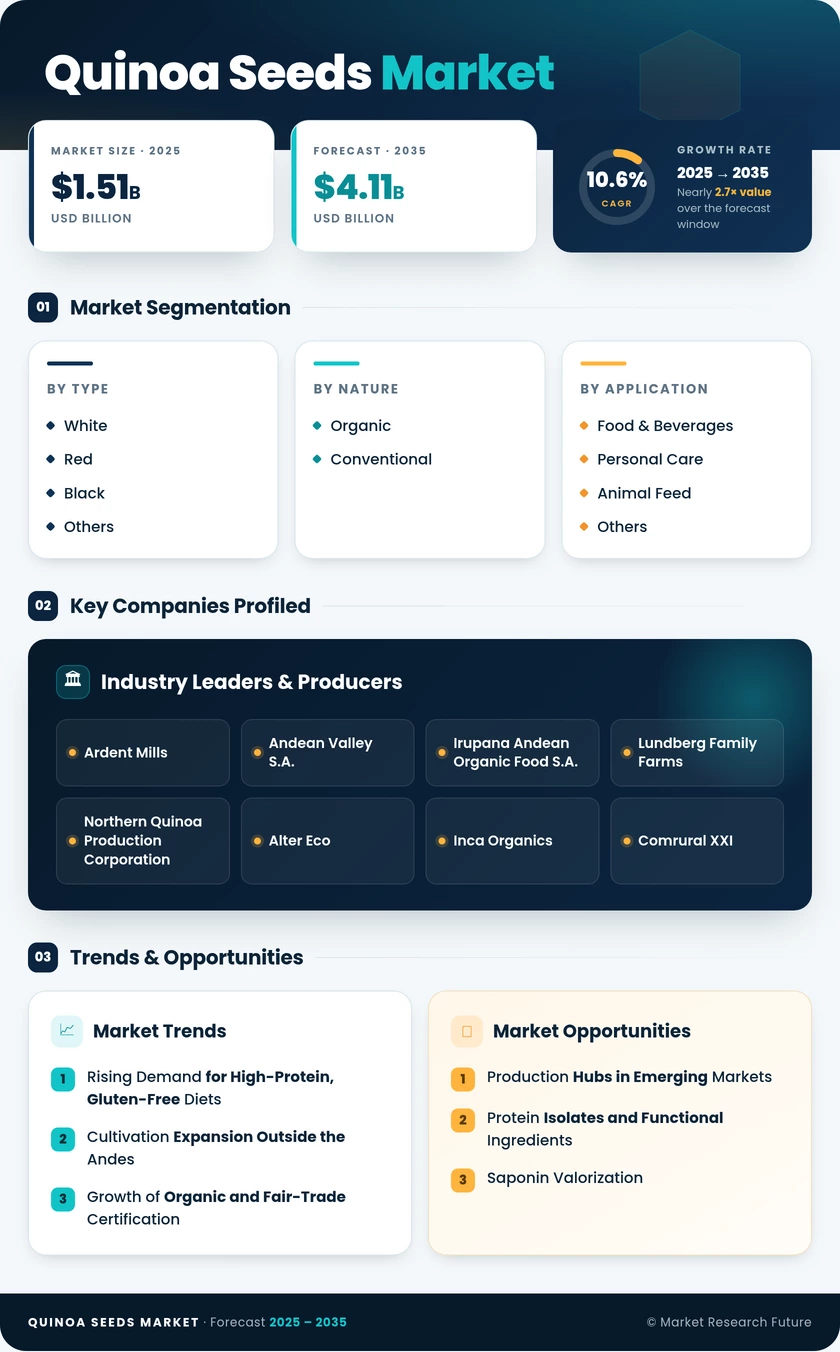
Quinoa Seeds Market (2026 - 2035)

ID: MRFR/FnB/5794-HCR 90 Pages Snehal Singh Last Updated: October 21, 2026
Quinoa Seeds Market Size, Share, Industry Trend & Analysis Research Report Information By Type (White, Red, Black, Others), By Nature (Organic, Conventional), By Application (Food & Beverages, Personal Care, Animal Feed, Others), By Distribution Channel (Store-Based, Non-Store-Based), By Region (North America, Europe, Asia-Pacific, South America, Middle East & Africa) – Forecast Till 2035
Quinoa Seeds Market
Market Size
Forecast Period2026-2035
CAGR (2026-2035)10.6%
2025 Market SizeUSD 1.51 Billion
2035 Market SizeUSD 4.11 Billion
Key Players
Ardent Mills
Andean Valley S.A.
Irupana Andean Organic Food S.A.
Lundberg Family Farms
Northern Quinoa Production Corporation
Alter Eco
Opportunities
  • Production Hubs in Emerging Markets
  • Protein Isolates and Functional Ingredients
  • Saponin Valorization
  1. 1 Market Summary | |
  2. 2 Key Report Takeaways | |
    1. 2.1 By Type | |
    2. 2.2 By Nature | |
    3. 2.3 By Application | |
    4. 2.4 By Distribution Channel | |
    5. 2.5 By Region | |
  3. 3 Market Size and Forecast (2021–2035) | |
  4. 4 Driver Impact Analysis | |
    1. 4.1 Rising Demand for High-Protein, Gluten-Free Diets | |
    2. 4.2 Cultivation Expansion Outside the Andes | |
    3. 4.3 Growth of Organic and Fair-Trade Certification | |
    4. 4.4 Processor Reformulation | |
    5. 4.5 Climate-Resilient Crop Programs | |
    6. 4.6 Online and Direct-to-Consumer Grocery | |
    7. 4.7 Andean Trade Promotion Policies | |
  5. 5 Restraints Impact Analysis | |
    1. 5.1 Price Volatility of Andean Supply | |
    2. 5.2 Climate Shocks in the Altiplano | |
    3. 5.3 Saponin Removal and Processing Costs | |
    4. 5.4 Competition from Millets, Amaranth, and Rice | |
    5. 5.5 Stricter Organic Import Compliance | |
  6. 6 Opportunities | |
    1. 6.1 Production Hubs in Emerging Markets | |
    2. 6.2 Protein Isolates and Functional Ingredients | |
    3. 6.3 Saponin Valorization | |
    4. 6.4 Traceability Data and Contract-Farming Platforms | |
    5. 6.5 Private-Label Expansion in Asia | |
  7. 7 Regional Market Share and Country-Level Analysis | |
    1. 7.1 North America | | |
      1. 7.1.1 United States | | |
      2. 7.1.2 Canada | | |
      3. 7.1.3 Rest of North America | |
    2. 7.2 Europe | | |
      1. 7.2.1 France | | |
      2. 7.2.2 Germany | | |
      3. 7.2.3 United Kingdom | | |
      4. 7.2.4 Spain | | |
      5. 7.2.5 Russia | | |
      6. 7.2.6 Rest of Europe | |
    3. 7.3 Asia-Pacific | | |
      1. 7.3.1 China | | |
      2. 7.3.2 Australia | | |
      3. 7.3.3 India | | |
      4. 7.3.4 Rest of Asia-Pacific | |
    4. 7.4 South America | | |
      1. 7.4.1 Peru | | |
      2. 7.4.2 Bolivia | | |
      3. 7.4.3 Brazil | | |
      4. 7.4.4 Argentina | | |
      5. 7.4.5 Rest of South America | |
    5. 7.5 Middle East & Africa | | |
      1. 7.5.1 Saudi Arabia | | |
      2. 7.5.2 UAE | | |
      3. 7.5.3 South Africa | | |
      4. 7.5.4 Egypt | | |
      5. 7.5.5 Rest of Middle East & Africa | |
  8. 8 Future Outlook (2026–2035) | |
    1. 8.1 Precision Agronomy and Breeding | |
    2. 8.2 Food Security and Population Growth | |
    3. 8.3 Ingredient Platforms over Commodity Trade | |
    4. 8.4 Sustainability Reporting and Traceability | |
  9. 9 Segmentation Analysis | |
    1. 9.1 By Type | | |
      1. 9.1.1 White | | |
      2. 9.1.2 Red | | |
      3. 9.1.3 Black | | |
      4. 9.1.4 Others | |
    2. 9.2 By Nature | | |
      1. 9.2.1 Organic | | |
      2. 9.2.2 Conventional | |
    3. 9.3 By Application | | |
      1. 9.3.1 Food & Beverages | | |
      2. 9.3.2 Personal Care | | |
      3. 9.3.3 Animal Feed | | |
      4. 9.3.4 Others | |
    4. 9.4 By Distribution Channel | | |
      1. 9.4.1 Store-Based | | |
      2. 9.4.2 Non-Store-Based | |
  10. 10 Competitive Landscape | |
    1. 10.1 Market Concentration Analysis | |
    2. 10.2 Competitive Benchmarking Matrix | |
  11. 11 Recent News & Developments | |
  12. 12 Report Scope and Methodology | |
  13. 13 Detailed Sources and Citations | |
  14. 14 Frequently Asked Questions (FAQs) | | LIST OF TABLES | |
  15. TABLE 1 Global Market Snapshot, 2025–2035 | |
  16. TABLE 2 Global Market Size & Forecast, by Revenue (USD Billion), 2021–2035 | |
  17. TABLE 3 Driver Impact Analysis, 2026–2035 | |
  18. TABLE 4 Restraints Impact Analysis, 2026–2035 | |
  19. TABLE 5 Regional Summary, 2025 | |
  20. TABLE 6 North America, by Country, 2025 | |
  21. TABLE 7 Europe, by Country, 2025 | |
  22. TABLE 8 Asia-Pacific, by Country, 2025 | |
  23. TABLE 9 South America, by Country, 2025 | |
  24. TABLE 10 Middle East & Africa, by Country, 2025 | |
  25. TABLE 11 Global Market, by Type, 2025 | |
  26. TABLE 12 Global Market, by Nature, 2025 | |
  27. TABLE 13 Global Market, by Application, 2025 | |
  28. TABLE 14 Global Market, by Distribution Channel, 2025 | |
  29. TABLE 15 Competitive Benchmarking Matrix, 2025 | |
  30. TABLE 16 Report Scope and Methodology | |
  31. TABLE 17 Detailed Sources and Citations | | LIST OF FIGURES | |
  32. FIGURE 1 Market Dynamics Overview (Drivers, Restraints, Opportunities) | |
  33. FIGURE 2 Quinoa Value Chain Analysis | |
  34. FIGURE 3 Porter's Five Forces Analysis | |
  35. FIGURE 4 Global Market Size Trend, 2021–2035 (USD Billion) | |
  36. FIGURE 5 Share by Type, 2025 | |
  37. FIGURE 6 Share by Nature, 2025 | |
  38. FIGURE 7 Share by Application, 2025 | |
  39. FIGURE 8 Share by Distribution Channel, 2025 | |
  40. FIGURE 9 Regional Share, 2025 | |
  41. FIGURE 10 Competitive Landscape Positioning, 2025

Segmentation Quick Reference

DimensionSub-SegmentsDominant SegmentFastest Growing Segment
By TypeWhite, Red, Black, OthersWhite (58.0% share)Black (12.4% CAGR)
By NatureOrganic, ConventionalConventional (66.5% share)Organic (12.9% CAGR)
By ApplicationFood & Beverages, Personal Care, Animal Feed, OthersFood & Beverages (78.0% share)Personal Care (13.7% CAGR)
By Distribution ChannelStore-Based, Non-Store-BasedStore-Based (63.5% share)Non-Store-Based (13.1% CAGR)
By RegionNorth America, Europe, Asia-Pacific, South America, Middle East & AfricaSouth America (38.5% share)Asia-Pacific (13.4% CAGR)

Market Segmentation Overview

By Type

Sub-SegmentKey Trend
WhiteDefault choice for flours, flakes, and foodservice
RedSteady use in salads and ready meals
BlackPremium blends and antioxidant positioning
OthersTri-color mixes and chef-led specialty varieties

White quinoa leads by a wide margin because its neutral flavor and soft texture let processors use it across flours, flakes, and cooked dishes without reformulating recipes. Black quinoa grows fastest as brands build premium tri-color and single-color ranges around its darker look and higher antioxidant content. Red quinoa keeps a stable position in prepared salads, where its firmer grain holds up after cooking.

By Nature

Sub-SegmentKey Trend
OrganicRetailer own-brand ranges and export premiums
ConventionalCost-driven demand from processors and foodservice

Conventional quinoa leads because industrial processors and foodservice buyers prioritize price and reliable volume over certification. Organic quinoa grows fastest as European and US retailers expand certified own-brand lines, and tighter USDA and EU import rules widen the premium paid to exporters with documented traceability.

By Application

Sub-SegmentKey Trend
Food & BeveragesReformulation into pasta, bars, cereals, beverages
Personal CareHydrolyzed protein and saponin surfactants
Animal FeedUse of off-grade seed and husks
OthersNutraceutical and industrial starch uses

Food & Beverages dominates since most quinoa is eaten as whole grain or used in pasta, cereals, and snack formulations. Personal Care is the fastest-growing application because cosmetic formulators value hydrolyzed quinoa protein in hair care and saponins as natural surfactants recovered from processing wastewater. Animal Feed absorbs off-grade fractions, improving producer economics.

By Distribution Channel

Sub-SegmentKey Trend
Store-BasedSupermarket and natural-food store dominance
Non-Store-BasedOnline grocery and subscription replenishment

Store-Based channels lead because supermarkets and natural-food stores remain where most shoppers first encounter and repurchase quinoa. Non-Store-Based channels grow fastest as online grocery platforms in China, India, and the US offer bulk packs and subscriptions, letting smaller importers and direct-to-consumer brands reach buyers without retail slotting fees.


Download PDF ×

We do not share your information with anyone. However, we may send you emails based on your report interest from time to time. You may contact us at any time to opt-out.