ID: MRFR/HCIT/0269-HCR | February 2021 | Region: Global | 105 pages
Market Scenario
Prescribed health apps are health-based software programs, designed to provide health services over mobile communication devices. These health apps assist patients to manage their medical condition on the real-time basis and provide the feedback back to professionals. The normal human functions such as blood pressure, blood sugar, heart rate, calories burned, cholesterol, and other fitness related data are displayed on a dashboard of the app with the help of the health-based app.
The global prescribed health apps market is majorly driven by the need to reduce long waiting periods to access healthcare facilities, rising penetration of mobile devices in healthcare, the rise in a number of healthcare facilities, and medical professionals relying on medical apps to foster the growth. Additionally, increasing availability of advanced networks and connectivity platforms and the growing need for technological advancements are propelling the growth of the prescribed health apps market globally.
According to the research conducted by NCBI, around 68% of the population in the US own a health app in their mobile phones. This increased use of health apps is likely to drive the growth of the prescribed health apps market globally.
Factors that are likely to hamper the growth of the market are lack of awareness and patient information safety.
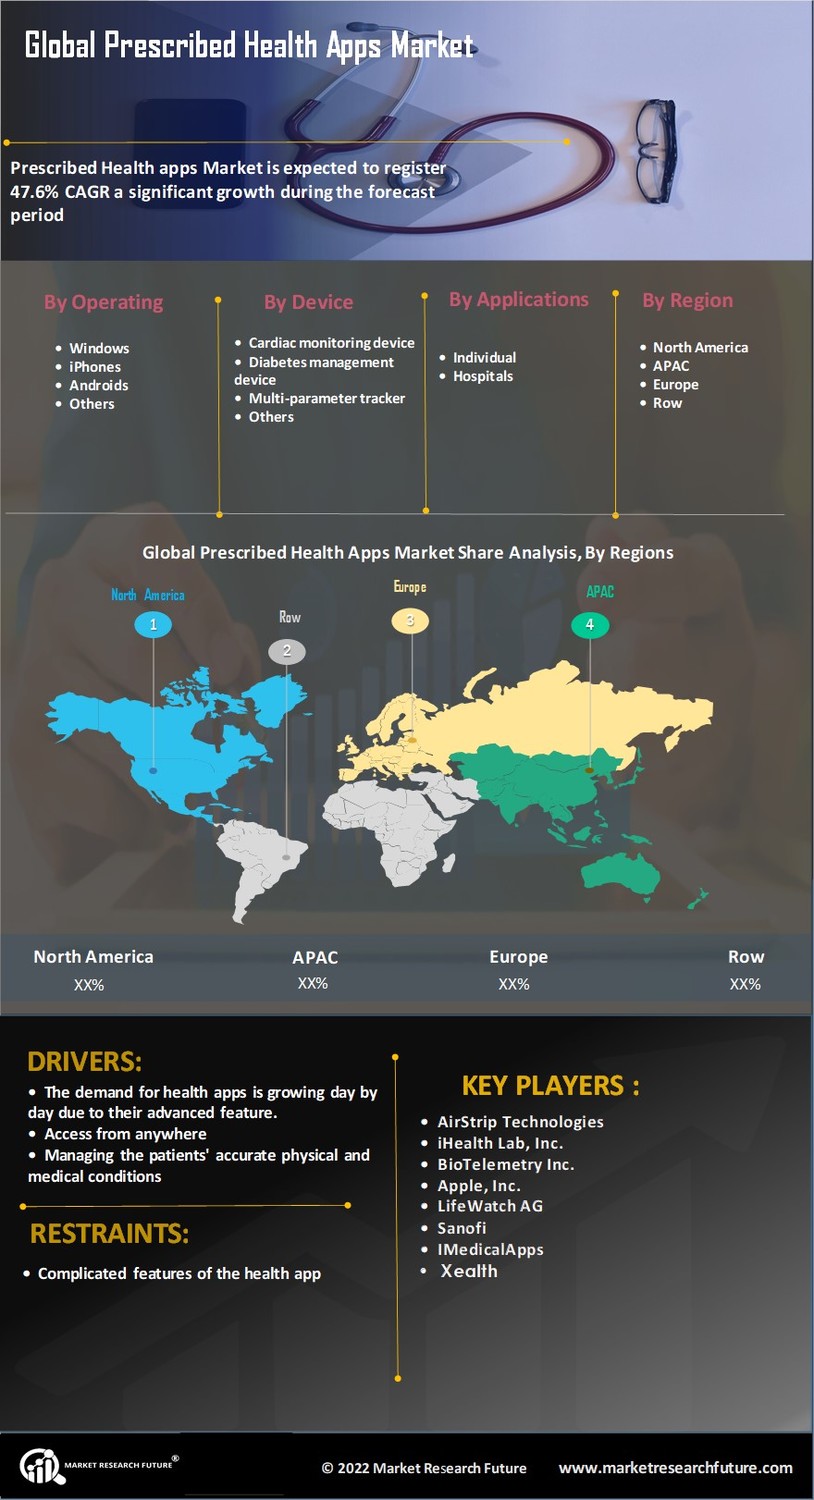
The global prescribed health apps market is expected to grow at a CAGR of 47.1% during the forecast period.
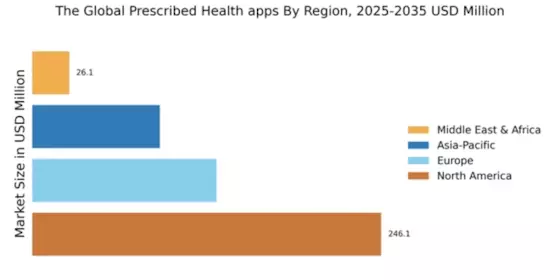
Figure: Global Prescribed Health Apps Market, by Region, 2017 (%)
Source: World Health Organization, Centers for Disease Control and Prevention, expert interview, market research future analysis, annual report, white paper, and company presentation
Intended Audience
Research Methodology:
Source: World Health Organization, Centers for Disease Control and Prevention, expert interview, market research future analysis, annual report, white paper, and company presentation
Segments
The global prescribed health apps market is segmented on the basis of type, device, application, and end-user.
On the basis of type, it is segmented into iPhones, androids, windows, and, others.
On the basis of device, the market is segmented into diabetes management device, multi-parameter tracker, cardiac monitoring device, and others.
On the basis of application, the market is segmented into disease management, fitness, nutrition and diet, medication adherence, lifestyle management, and others.
On the basis of end-user, the market is segmented into hospitals, specialty centers, and home cares.
Regional Analysis
The North American prescribed health apps market is a growing market in the Americas region. On a regional basis, the Americas region is segmented into North America and South America. North America is segmented into the US and Canada. The increasing emphasis on chronic diseases management by health-based apps is encouraging physicians to prefer these apps. According to the survey conducted by NCBI, in 2015 around 35% of the parents and 17% of teens in New York had used a health-based app. This growing demand for mobile apps among the physicians along with the increasing penetration of mobile devices in healthcare settings likely to drive the growth of the prescribed health apps market in North America.
Europe is the second largest market and holds a noticeable share in the global prescribed health apps market. The European market is expected to grow during the forecast period owing to the availability of newer and advanced treatment facilities and increasing skilled medical professionals along with the growing need for better healthcare infrastructure. Furthermore, the growing awareness about chronic disease management and the increase in a number of medical apps to promote health monitoring are propelling the growth of the prescribed health apps market in Europe.
Asia Pacific is expected to be the fastest growing market. Increasing prevalence of chronic diseases is the major driver of the market growth. India is the fastest growing region owing to its large youth population and increasing patient population. The growing awareness about health and availability of new treatment methods drive the market in this region. Increasing healthcare expenditure and the overall growth of the healthcare diagnostic and treatment industry also drive the market.
The Middle East and Africa is expected to show the least growth in the market due to some major factors such as lack of awareness and limited access and affordability of treatment facilities. In the Middle East, United Arab Emirates is the largest market owing to the development of healthcare infrastructure and increasing skilled medical professionals.
Key Players
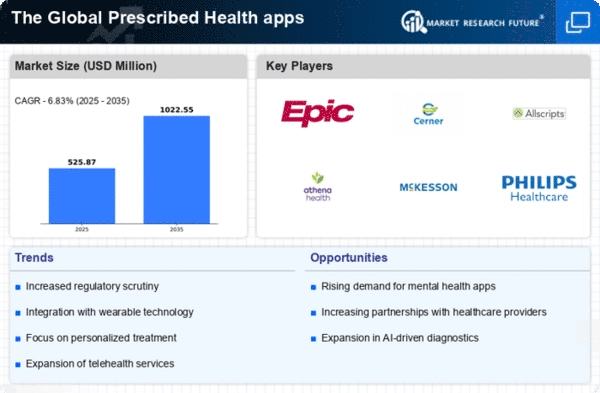
Some of the players in the prescribed health apps market are BioTelemetry Inc., AirStrip Technologies, LifeWatch AG, Sanofi, Apple, Inc., iHealth Lab, and Cerner Corporation.
Frequently Asked Questions (FAQ) :
Prescribed Health Apps Market is expected to exhibit a strong 47.1% CAGR over the forecast period from 2018 to 2023.
Increasing availability of advanced connectivity platforms is the major driver for the Prescribed Health Apps Market.
The Americas dominate the Global Prescribed Health Apps Market with a strong 42% share in 2017.
Leading players in the Global Prescribed Health Apps Market include BioTelemetry Inc., AirStrip Technologies, and Sanofi, among others.
Table of Content
1. Report Prologue
2. Market Introduction
2.1 Definition
2.2 Scope of the Study
2.2.1 Research Objective
2.2.2 Assumptions
2.2.3 Limitations
3. Research Methodology
3.1 Introduction
3.2 Primary Research
3.3 Secondary Research
3.4 Market Size Estimation
4. Market Dynamics
4.1 Drivers
4.2 Restraints
4.3 Opportunities
4.4 Challenges
4.5 Macroeconomic Indicators
4.6 Technology Trends & Assessment
5. Market Factor Analysis
5.1 Porter’s Five Forces Analysis
5.1.1 Bargaining Power of Suppliers
5.1.2 Bargaining Power of Buyers
5.1.3 Threat of New Entrants
5.1.4 Threat of Substitutes
5.1.5 Intensity of Rivalry
5.2 Value Chain Analysis
5.3 Investment Feasibility Analysis
5.4 Pricing Analysis
6. Global Prescribed Health Apps Market, by Type
6.1 Introduction
6.2 iPhones
6.2.1 Market Estimates & Forecast, 2017–2023
6.3 Androids
6.3.1 Market Estimates & Forecast, 2017–2023
6.4 Windows
6.4.1 Market Estimates & Forecast, 2017–2023
6.4 Others
6.4.1 Market Estimates & Forecast, 2017–2023
7. Global Prescribed Health Apps Market, by Device
7.1 Introduction
7.2 Diabetes Management Device
7.2.1 Market Estimates & Forecast, 2017–2023
7.3 Multi-Parameter Tracker
7.3.1 Market Estimates & Forecast, 2017–2023
7.4 Cardiac Monitoring Device
7.4.1 Market Estimates & Forecast, 2017–2023
7.5 Others
7.5.1 Market Estimates & Forecast, 2017–2023
8. Global Prescribed Health Apps Market, by Application
8.1 Introduction
8.2 Disease Management
8.2.1 Market Estimates & Forecast, 2017–2023
8.3 Fitness
8.3.1 Market Estimates & Forecast, 2017–2023
8.4 Nutrition & Diet
8.4.1 Market Estimates & Forecast, 2017–2023
8.5 Medication Adherence
8.5.1 Market Estimates & Forecast, 2017–2023
8.6 Lifestyle Management
8.6.1 Market Estimates & Forecast, 2017–2023
8.7 Others
8.7.1 Market Estimates & Forecast, 2017–2023
9. Global Prescribed Health Apps Market, by End-User
9.1 Introduction
9.2 Hospitals
9.2.1 Market Estimates & Forecast, 2017–2023
9.3 Specialty centers
9.3.1 Market Estimates & Forecast, 2017–2023
9.4 Home Cares
9.4.1 Market Estimates & Forecast, 2017–2023
10 Global Prescribed Health Apps Market, by Region
10.1 Introduction
10.2 Americas
10.2.1 North America
10.2.1.1 U.S.
10.2.1.2 Canada
10.2.2 South America
10.3 Europe
10.3.1 Western Europe
10.3.1.1 Germany
10.3.1.2 France
10.3.1.3 U.K.
10.3.1.4 Italy
10.3.1.5 Spain
10.3.1.6 Rest of Western Europe
10.3.2 Eastern Europe
10.4 Asia Pacific
10.4.1 Japan
10.4.2 China
10.4.3 India
10.4.4 Australia
10.4.5 Republic of Korea
10.4.6 Rest of Asia Pacific
10.5 Middle East & Africa
10.5.1 United Arab Emirates
10.5.2 Saudi Arabia
10.5.3 Oman
10.5.4 Kuwait
10.5.5 Qatar
10.5.6 Rest of the Middle East & Africa
11 Company Landscape
11.1 Introduction
11.2 Market Share Analysis
11.3 Key Development & Strategies
11.3.1 Key Developments
11 Company Profiles
11.1 BioTelemetry, Inc.
11.1.1 Company Overview
11.1.2 Product Overview
11.1.3 Financials
11.1.4 SWOT Analysis
11.2 AirStrip Technologies
11.2.1 Company Overview
11.2.2 Product Overview
11.2.3 Financial Overview
11.2.4 Key Developments
11.2.5 SWOT Analysis
11.3 LifeWatch AG
11.3.1 Company Overview
11.3.2 Product Overview
11.3.3 Financial Overview
11.3.4 Key Development
11.3.5 SWOT Analysis
11.4 Sanofi
11.4.1 Company Overview
11.4.2 Product/Business Segment Overview
11.4.3 Financial Overview
11.4.4 Key Development
11.4.5 SWOT Analysis
11.5 Apple, Inc.
11.5.1 Company Overview
11.5.2 Product Overview
11.5.3 Financial overview
11.5.4 Key Developments
11.6 iHealth Lab
11.6.1 Company Overview
11.6.2 Product Overview
11.6.3 Financial Overview
11.6.4 Key Developments
11.7 Cerner Corporation
11.7.1 Overview
11.7.2 Product Overview
11.7.3 Financials
11.7.4 Key Developments
11.7.5 SWOT Analysis
11.8 Others
12 MRFR Conclusion
12.1 Key Findings
12.1.1 From CEO’s View Point
12.1.2 Unmet Needs of the Market
12.2 Key Companies to Watch
12.3 Prediction of Pharmaceutical Industry
13 Appendix
LIST OF TABLES
Table 1 Prescribed Health Apps Industry Synopsis, 2017–2023
Table 2 Global Prescribed Health Apps Market Estimates & Forecast, 2017–2023, (USD Million)
Table 3 Global Prescribed Health Apps Market, by Region, 2017–2023, (USD Million)
Table 5 Global Prescribed Health Apps Market, by Type, 2017–2023, (USD Million)
Table 6 Global Prescribed Health Apps Market, by Device, 2017–2023, (USD Million)
Table 7 Global Prescribed Health Apps Market, by End-User, 2017–2023, (USD Million)
Table 8 North America Prescribed Health Apps Market, by Type, 2017–2023, (USD Million)
Table 9 North America Prescribed Health Apps Market, by Device
, 2017–2023, (USD Million)
Table 10 North America Prescribed Health Apps Market, by End-User, 2017–2023, (USD Million)
Table 11 US Prescribed Health Apps Market, by Type, 2017–2023, (USD Million)
Table 12 US Prescribed Health Apps Market, by Device, 2017–2023, (USD Million)
Table 13 US Prescribed Health Apps Market, by End-User, 2017–2023, (USD Million)
Table 14 Canada Prescribed Health Apps Market, by Type, 2017–2023, (USD Million)
Table 15 Canada Prescribed Health Apps Market, by Device, 2017–2023, (USD Million)
Table 16 Canada Prescribed Health Apps Market, by End-User, 2017–2023, (USD Million)
Table 17 South America Prescribed Health Apps Market, by Type, 2017–2023, (USD Million)
Table 18 South America Prescribed Health Apps Market, by Device, 2017–2023, (USD Million)
Table 19 South America Prescribed Health Apps Market, by End-User, 2017–2023, (USD Million)
Table 20 Europe Prescribed Health Apps Market, by Type, 2017–2023, (USD Million)
Table 21 Europe Prescribed Health Apps Market, by Device, 2017–2023, (USD Million)
Table 22 Europe Prescribed Health Apps Market, by End-User, 2017–2023, (USD Million)
Table 23 Western Europe Prescribed Health Apps Market by Type, 2017–2023, (USD Million)
Table 24 Western Europe Prescribed Health Apps Market, by Device, 2017–2023, (USD Million)
Table 25 Western Europe Prescribed Health Apps Market, by End-User, 2017–2023, (USD Million)
Table 26 Eastern Europe Prescribed Health Apps Market, by Type, 2017–2023, (USD Million)
Table 27 Eastern Europe Prescribed Health Apps Market, by Device
, 2017–2023, (USD Million)
Table 28 Eastern Europe Prescribed Health Apps Market, by End-User, 2017–2023, (USD Million)
Table 29 Asia Pacific Prescribed Health Apps Market, by Type, 2017–2023, (USD Million)
Table 30 Asia Pacific Prescribed Health Apps Market, by Device, 2017–2023, (USD Million)
Table 31 Asia Pacific Prescribed Health Apps Market, by End-User, 2017–2023, (USD Million)
Table 32 Middle East & Africa Prescribed Health Apps Market, by Type, 2017–2023, (USD Million)
Table 33 Middle East & Africa Prescribed Health Apps Market, by Device, 2017–2023, (USD Million)
Table 34 Middle East & Africa Prescribed Health Apps Market, by End-User, 2017–2023, (USD Million)
LIST OF FIGURES
Figure 1 Research Process
Figure 2 Segmentation for Global Prescribed Health Apps Market
Figure 3 Segmentation Market Dynamics for Prescribed Health Apps Market
Figure 4 Global Prescribed Health Apps Market Share, by Type 2016
Figure 5 Global Prescribed Health Apps Market Share, by Devices 2016
Figure 6 Global Prescribed Health Apps Market Share, by End Users, 2016
Figure 7 Global Prescribed Health Apps Market Share, by Region, 2016
Figure 8 North America Prescribed Health Apps Market Share, by Country, 2016
Figure 9 Europe Prescribed Health Apps Market Share, by Country, 2016
Figure 10 Asia Pacific Prescribed Health Apps Market Share, by Country, 2016
Figure 11 Middle East & Africa Prescribed Health Apps Market Share, by Country, 2016
Figure 12 Global Prescribed Health Apps Market: Company Share Analysis, 2016 (%)
Figure 13 BioTelemetry Inc.: Key Financials
Figure 14 BioTelemetry Inc: Segmental Revenue
Figure 16 BioTelemetry Inc: Geographical Revenue
Figure 17 AirStrip Technologies: Key Financials
Figure 18 AirStrip Technologies: Segmental Revenue
Figure 19 AirStrip Technologies: Geographical Revenue
Figure 20 iHealth Lab: Key Financials
Figure 21 iHealth Lab: Segmental Revenue
Figure 22 iHealth Lab: Geographical Revenue
Figure 23 LifeWatch AG: Key Financials
Figure 24 LifeWatch AG: Segmental Revenue
Figure 25 LifeWatch AG: Geographical Revenue
Figure 26 Sanofi: Key Financials
Figure 27 Sanofi: Segmental Revenue
Figure 28 Sanofi: Geographical Revenue
Figure 29 Apple, Inc.: Key Financials
Figure 30 Apple, Inc.: Segmental Revenue
Figure 31 Apple, Inc.: Geographical Revenue
Figure 32 Cerner Corporation: Key Financials
Figure 33 Cerner Corporation: Segmental Revenue
Figure 34 Cerner Corporation: Geographical Revenue