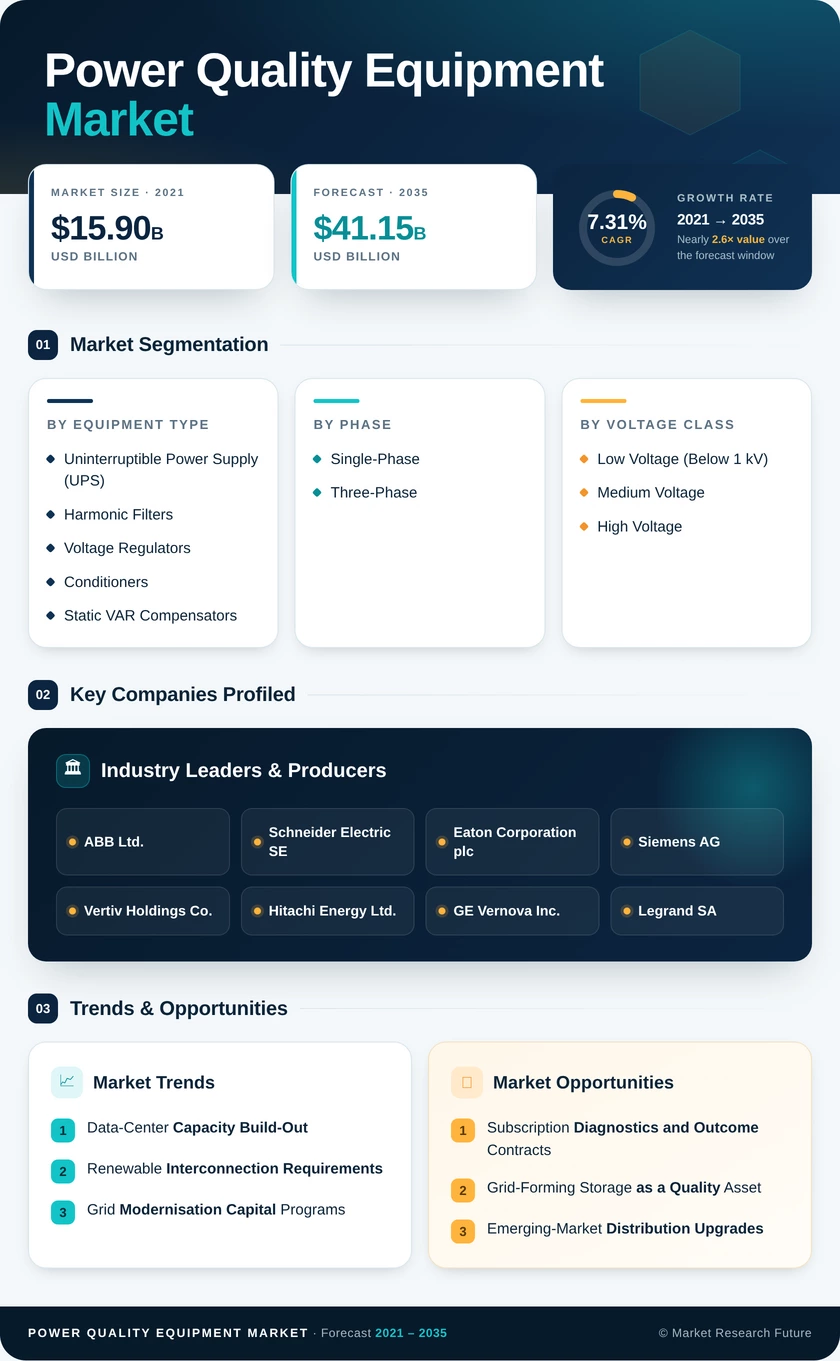
Power Quality Equipment Market (2026 - 2035)

ID: MRFR/EnP/2234-HCR 111 Pages Chitranshi Jaiswal Last Updated: October 16, 2026
Power Quality Equipment Market Research Report By Equipment Type (Uninterruptible Power Supply (UPS), Harmonic Filters, Voltage Regulators and Conditioners, Static VAR Compensators and STATCOM, Surge Protection Devices, Static Transfer Switches, Power Quality Meters, Active Power Filters, Other Equipment Types), By Phase (Single-Phase, Three-Phase), By Voltage Class (Low Voltage (Below 1 kV), Medium Voltage, High Voltage), By Application (Renewable Integration, Automation and Robotics, Data Centers, EV Fast Charging, Oil and Gas, Marine), By End-User (Utilities, Commercial and Industrial, Residential) - Forecast to 2035
Power Quality Equipment Market
Market Size
Forecast Period2026-2035
CAGR (2026-2035)7.31%
2025 Market SizeUSD 20.33 Billion
2035 Market SizeUSD 41.15 Billion
Key Players
ABB Ltd.
Schneider Electric SE
Eaton Corporation plc
Siemens AG
Vertiv Holdings Co.
Hitachi Energy Ltd.
Opportunities
  • Subscription Diagnostics and Outcome Contracts
  • Grid-Forming Storage as a Quality Asset
  • Emerging-Market Distribution Upgrades
  1. 1 Market Summary | |
    1. 1.1 Study Assumptions and Market Definition | |
    2. 1.2 Scope of the Study | |
    3. 1.3 Research Methodology | |
  2. 2 Key Report Takeaways | |
    1. 2.1 By Equipment Type | |
    2. 2.2 By Phase | |
    3. 2.3 By Voltage Class | |
    4. 2.4 By Application | |
    5. 2.5 By End-User | |
    6. 2.6 By Region | |
  3. 3 Market Size and Forecast (2021–2035) | |
    1. 3.1 Historical Market Size (2021–2025) | |
    2. 3.2 Current and Forecast Market Size (2026–2035) | |
    3. 3.3 Market Size by Revenue (USD Billion) | |
    4. 3.4 Year-over-Year Growth Analysis | |
  4. 4 Driver Impact Analysis | |
    1. 4.1 Data-Center Capacity Build-Out | |
    2. 4.2 Renewable Interconnection Requirements | |
    3. 4.3 Grid Modernisation Capital Programs | |
    4. 4.4 Variable-Frequency Drive Proliferation | |
    5. 4.5 EV Fast-Charging Deployment | |
    6. 4.6 Tightening Distortion Standards | |
    7. 4.7 Process Heat Electrification | |
  5. 5 Restraints Impact Analysis | |
    1. 5.1 High Upfront Capital Cost | |
    2. 5.2 Commoditisation and Price Erosion | |
    3. 5.3 Power Semiconductor Supply Constraints | |
    4. 5.4 Inconsistent Standards Enforcement | |
    5. 5.5 Shortage of Power Systems Engineers | |
  6. 6 Opportunities | |
    1. 6.1 Subscription Diagnostics and Outcome Contracts | |
    2. 6.2 Grid-Forming Storage as a Quality Asset | |
    3. 6.3 Emerging-Market Distribution Upgrades | |
    4. 6.4 Waveform Data Monetisation | |
    5. 6.5 Modular Retrofit for Constrained Electrical Rooms | |
  7. 7 Regional Market Share and Country-Level Analysis | |
    1. 7.1 North America | | |
      1. 7.1.1 United States | |
    2. 7.2 Europe | |
    3. 7.3 Asia-Pacific | |
    4. 7.4 South America | |
    5. 7.5 Middle East & Africa | |
  8. 8 Future Outlook (2026–2035) | |
    1. 8.1 Autonomous Correction and Machine Learning | |
    2. 8.2 Electrification Supercycle | |
    3. 8.3 Platform Economics and Software Attach | |
    4. 8.4 Efficiency Disclosure and Sustainability Reporting | |
  9. 9 Segmentation Analysis | |
    1. 9.1 By Equipment Type | | |
      1. 9.1.1 Uninterruptible Power Supply (UPS) | | |
      2. 9.1.2 Harmonic Filters | | |
      3. 9.1.3 Voltage Regulators and Conditioners | | |
      4. 9.1.4 Static VAR Compensators and STATCOM | | |
      5. 9.1.5 Surge Protection Devices | | |
      6. 9.1.6 Static Transfer Switches | | |
      7. 9.1.7 Power Quality Meters | | |
      8. 9.1.8 Active Power Filters | | |
      9. 9.1.9 Other Equipment Types | |
    2. 9.2 By Phase | | |
      1. 9.2.1 Single-Phase | | |
      2. 9.2.2 Three-Phase | |
    3. 9.3 By Voltage Class | | |
      1. 9.3.1 Low Voltage (Below 1 kV) | | |
      2. 9.3.2 Medium Voltage | | |
      3. 9.3.3 High Voltage | |
    4. 9.4 By Application | | |
      1. 9.4.1 Renewable Integration | | |
      2. 9.4.2 Automation and Robotics | | |
      3. 9.4.3 Data Centers | | |
      4. 9.4.4 EV Fast Charging | | |
      5. 9.4.5 Oil and Gas | | |
      6. 9.4.6 Marine | |
    5. 9.5 By End-User | | |
      1. 9.5.1 Utilities | | |
      2. 9.5.2 Commercial and Industrial | | |
      3. 9.5.3 Residential | |
  10. 10 Competitive Landscape | |
    1. 10.1 Market Concentration Analysis (2026) | |
    2. 10.2 Competitive Benchmarking Matrix | |
    3. 10.3 Company Profiles | |
  11. 11 Recent News and Developments | |
  12. 12 Report Scope and Methodology | |
    1. 12.1 Study Period and Base Year | |
    2. 12.2 Data Sources and Citations | |
    3. 12.3 Abbreviations | |
  13. 13 Detailed Sources and Citations | |
  14. 14 Frequently Asked Questions (FAQs) | | LIST OF TABLES | |
  15. TABLE 1 Global Market Size and Forecast, by Revenue (USD Billion), 2021–2035 | |
  16. TABLE 2 Year-over-Year Growth Analysis, 2021–2035 | |
  17. TABLE 3 Driver Impact Analysis Matrix, 2026–2035 | |
  18. TABLE 4 Restraint Impact Analysis Matrix, 2026–2035 | |
  19. TABLE 5 Regional Summary and Investment Themes, 2025 | |
  20. TABLE 6 North America Size, by Country, 2021–2035 (USD Billion) | |
  21. TABLE 7 Europe Size, by Country, 2021–2035 (USD Billion) | |
  22. TABLE 8 Asia-Pacific Size, by Country, 2021–2035 (USD Billion) | |
  23. TABLE 9 South America Size, by Country, 2021–2035 (USD Billion) | |
  24. TABLE 10 Middle East & Africa Size, by Country, 2021–2035 (USD Billion) | |
  25. TABLE 11 Size, by Equipment Type, 2021–2035 (USD Billion) | |
  26. TABLE 12 Size, by Phase, 2021–2035 (USD Billion) | |
  27. TABLE 13 Size, by Voltage Class, 2021–2035 (USD Billion) | |
  28. TABLE 14 Size, by Application, 2021–2035 (USD Billion) | |
  29. TABLE 15 Size, by End-User, 2021–2035 (USD Billion) | |
  30. TABLE 16 Regional Size, by Equipment Type, 2021–2035 (USD Billion) | |
  31. TABLE 17 Regional Size, by Application, 2021–2035 (USD Billion) | |
  32. TABLE 18 Competitive Benchmarking Matrix, 2026 | |
  33. TABLE 19 Company Profiles — Key Players | |
  34. TABLE 20 Recent Developments and Strategic Announcements, 2023–2025 | |
  35. TABLE 21 Report Scope and Methodology Summary | |
  36. TABLE 22 Detailed Sources and Citations Index | | LIST OF FIGURES | |
  37. FIGURE 1 Market Dynamics — Drivers, Restraints, and Opportunities | |
  38. FIGURE 2 Industry Value Chain Analysis | |
  39. FIGURE 3 Porter's Five Forces Assessment | |
  40. FIGURE 4 Market Size Trend and Forecast Curve, 2021–2035 | |
  41. FIGURE 5 Year-over-Year Growth Trajectory, 2021–2035 | |
  42. FIGURE 6 Share by Equipment Type, 2025 vs 2035 | |
  43. FIGURE 7 Share by Phase, 2025 | |
  44. FIGURE 8 Share by Voltage Class, 2025 | |
  45. FIGURE 9 Share by Application, 2025 vs 2035 | |
  46. FIGURE 10 Share by End-User, 2025 | |
  47. FIGURE 11 Regional Revenue Share Distribution, 2025 | |
  48. FIGURE 12 Regional CAGR Comparison, 2026–2035 | |
  49. FIGURE 13 Competitive Landscape Positioning Map, 2026 | |
  50. FIGURE 14 Top-Five Supplier Share Concentration, 2026

Segmentation Quick Reference

DimensionSub-SegmentsDominant SegmentFastest Growing Segment
By Equipment TypeUninterruptible Power Supply (UPS); Harmonic Filters; Voltage Regulators and Conditioners; Static VAR Compensators and STATCOM; Surge Protection Devices; Static Transfer SwitchesUninterruptible Power Supply (UPS) — 39.8% share (2025)Voltage Regulators and Conditioners — 10.29% CAGR (2026–2035)
By PhaseSingle-Phase; Three-PhaseThree-Phase — 64.25% share (2025)Single-Phase — 7.62% CAGR (2026–2035)
By Voltage ClassLow Voltage (Below 1 kV); Medium Voltage; High VoltageMedium Voltage — 55.8% share (2025)Low Voltage (Below 1 kV) — 8.57% CAGR (2026–2035)
By ApplicationRenewable Integration; Automation and Robotics; Data Centers; EV Fast Charging; Oil and Gas; MarineRenewable Integration — 24.3% share (2025)EV Fast Charging — 9.72% CAGR (2026–2035)
By End-UserUtilities; Commercial and Industrial; ResidentialCommercial and Industrial — 66.7% share (2025)Utilities — 7.68% CAGR (2026–2035)


Market Segmentation Overview

By Equipment Type

Sub-SegmentKey Trend
Uninterruptible Power Supply (UPS)Lithium-ion migration shortens refresh cycles and raises density per rack
Harmonic FiltersActive topologies displace tuned passive banks in drive-dense plants.
Voltage Regulators and ConditionersSub-cycle correction replaces mechanical tap-changing
Static VAR Compensators and STATCOMRenewable collector substations become the primary order source.
Surge Protection DevicesIEC 61643-01:2024 test duties obsolete part of the installed base
Static Transfer SwitchesDual-corded mission-critical campuses drive specification.


Uninterruptible Power Supply (UPS) leads this dimension on installed value because continuity requirements in data centers and clinical settings translate directly into redundancy budgets. Voltage Regulators and Conditioners grow fastest, since operators increasingly find that momentary sags — not full outages — account for most process interruptions, and mechanical regulators cannot respond within a cycle. Static VAR Compensators and STATCOM units track renewable interconnection volume rather than general capex, giving them a different demand rhythm from the rest of the portfolio.

By Phase

Sub-SegmentKey Trend
Single-PhaseRooftop solar and residential chargers push conditioning into homes.
Three-PhaseIndependent per-phase control reduces imbalance and transformer stress.


Three-Phase holds the dominant position because industrial and large commercial sites gain both efficiency and inherent load balance, and because cabling economics favour it decisively above a few hundred kilowatts. Single-Phase grows faster from a much smaller base, driven by residential photovoltaic inverters and small retail premises where installation simplicity outweighs efficiency loss. Advanced controllers that regulate each phase independently are the notable technical development, eroding the long-held assumption that three-phase installations balance themselves.

By Voltage Class

Sub-SegmentKey Trend
Low Voltage (Below 1 kV)Modular plug-and-play units retrofit without full shutdown
Medium VoltageDynamic VAR devices deployed at distribution substations
High VoltageOffshore wind export cables require dedicated voltage support.


Medium Voltage leads because distribution feeders aggregate harmonic sources from many customers, making substation-level correction cheaper than treating each load individually. Low Voltage (Below 1 kV) grows fastest as buildings add heat pumps, chargers, and inverters that generate distortion behind the meter, and as modular designs allow retrofit into existing panels without outage. High Voltage remains project-driven and lumpy, concentrated where long subsea or overhead export circuits require compensation as a connection condition.

By Application

Sub-SegmentKey Trend
Renewable IntegrationGrid-code compliance mandated at the connection point
Automation and RoboticsPrecision tolerances tighten distortion requirements on production lines.
Data CentersAI training clusters raise density and pulsed-load severity.
EV Fast ChargingCorridor density regulations force compensation alongside chargers
Oil and GasRugged conditioning sustains demand at remote installations.
MarineShore-power connection and vessel electrification create niche specifications.


Renewable Integration leads because compliance is enforced before energisation, producing the most predictable order flow in this dimension. EV Fast Charging grows fastest as regulated corridor requirements in Europe and North America push charging pools into power ranges that distort adjacent feeders without active correction. Automation and Robotics supplies steady replacement volume tied to drive penetration, while Marine remains small and specification-heavy, shaped by corrosion resistance and shore-power synchronisation requirements rather than by volume economics.

By End-User

Sub-SegmentKey Trend
UtilitiesPremium-power tariffs bundle real-time harmonic monitoring
Commercial and IndustrialQuantified downtime cost supports straightforward business cases.
ResidentialCombined inverter-conditioner packages ship with rooftop solar.


Commercial and Industrial buyers dominate spending because their downtime costs are measurable, often insured, and therefore easy to convert into approved capital. Utilities represent the fastest-growing group as regulators tie distributed-energy interconnection approvals to demonstrated quality of supply, turning a technical preference into a compliance obligation with budget attached. Residential remains the smallest sub-segment and the only one reaching customers through retail bundling rather than engineered sales channels, which caps average selling prices.




Download PDF ×

We do not share your information with anyone. However, we may send you emails based on your report interest from time to time. You may contact us at any time to opt-out.