Power Module Packaging Market (2026 - 2035)

ID: MRFR/SEM/34576-HCR 200 Pages Aarti Dhapte Last Updated: October 13, 2026
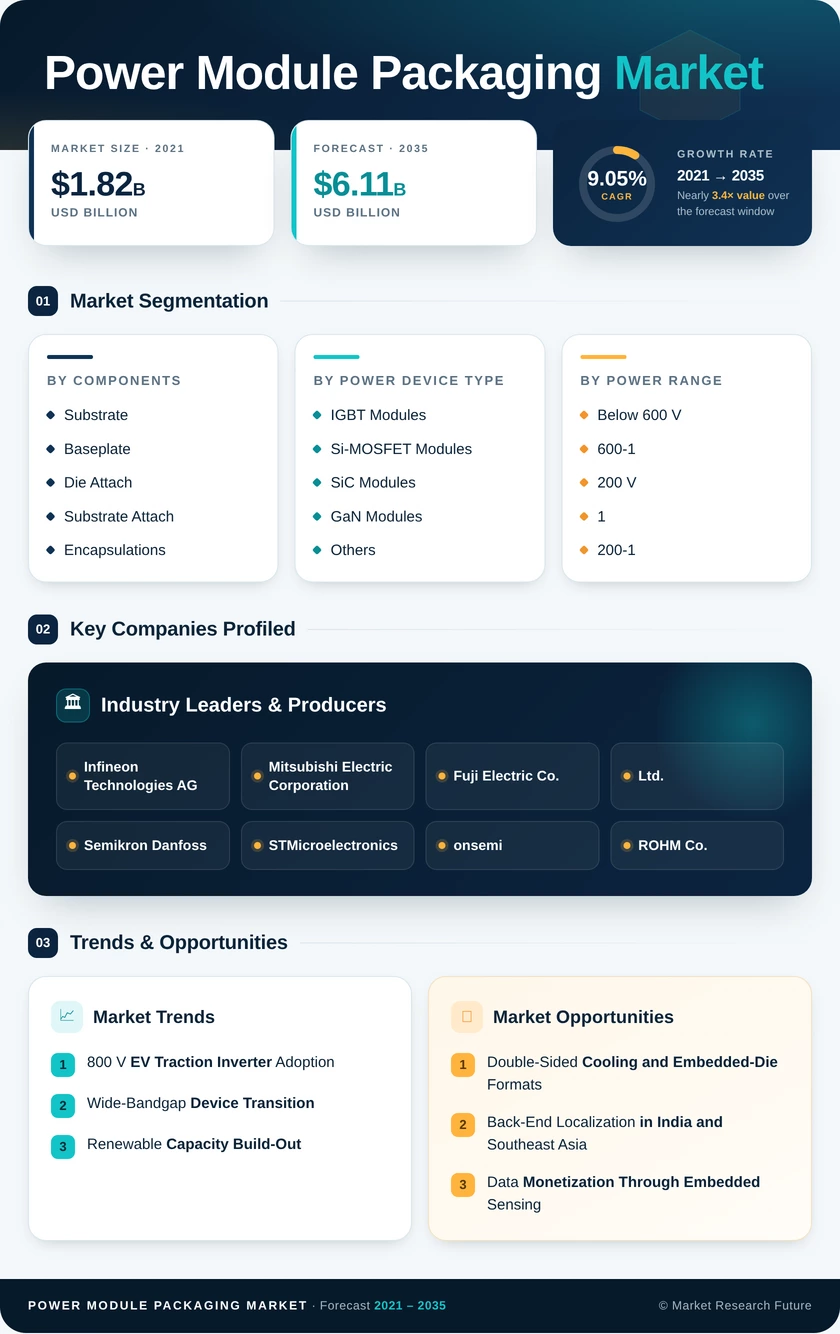
Power Module Packaging Market Size, Share and Research Report By Components (Substrate, Baseplate, Die Attach, Substrate Attach, Encapsulations, Interconnections, Others), By Power Device Type (IGBT Modules, Si-MOSFET Modules, SiC Modules, GaN Modules, Others), By Power Range (Below 600 V, 600–1,200 V, 1,200–1,700 V, Above 1,700 V), By End-User (Automotive, Industrial, Consumer Electronics, Renewable Energy, Others) and By Regional (North America, Europe, South America, Asia Pacific, Middle East and Africa) - Industry Forecast to 2035.
Power Module Packaging Market
Market Size
Forecast Period2026-2035
CAGR (2026-2035)9.05%
2025 Market SizeUSD 2.55 Billion
2035 Market SizeUSD 6.11 Billion
Key Players
Infineon Technologies AG
Mitsubishi Electric Corporation
Fuji Electric Co., Ltd.
Semikron Danfoss
STMicroelectronics
onsemi
Opportunities
  • Double-Sided Cooling and Embedded-Die Formats
  • Back-End Localization in India and Southeast Asia
  • Data Monetization Through Embedded Sensing
  1. 1 Market Summary | |
  2. 2 Key Report Takeaways | |
    1. 2.1 By Components | |
    2. 2.2 By Power Device Type | |
    3. 2.3 By Power Range | |
    4. 2.4 By End-User | |
    5. 2.5 By Region | |
  3. 3 Market Size and Forecast (2021–2035) | |
    1. 3.1 Historical Market Size (2021–2025) | |
    2. 3.2 Forecast Market Size (2026–2035) | |
    3. 3.3 Year-over-Year Growth Analysis | |
  4. 4 Driver Impact Analysis | |
    1. 4.1 800 V EV Traction Inverter Adoption | |
    2. 4.2 Wide-Bandgap Device Transition | |
    3. 4.3 Renewable Capacity Build-Out | |
    4. 4.4 Semiconductor Industrial Policy | |
    5. 4.5 AI Data-Center Power Density | |
    6. 4.6 Lead-Free and Reliability Mandates | |
  5. 5 Restraints Impact Analysis | |
    1. 5.1 High Material Costs | |
    2. 5.2 EV Demand Volatility | |
    3. 5.3 Critical Raw Material Export Controls | |
    4. 5.4 Qualification Cycles and Reliability Risk | |
    5. 5.5 Skilled Workforce Shortage | |
  6. 6 Opportunities | |
    1. 6.1 Double-Sided Cooling and Embedded-Die Formats | |
    2. 6.2 Back-End Localization in India and Southeast Asia | |
    3. 6.3 Data Monetization Through Embedded Sensing | |
    4. 6.4 High-Voltage Rail and Grid Modules | |
    5. 6.5 Material Recovery and Circular Models | |
  7. 7 Regional Market Share and Country-Level Analysis | |
    1. 7.1 North America | | |
      1. 7.1.1 US | | |
      2. 7.1.2 Canada | | |
      3. 7.1.3 Mexico | |
    2. 7.2 Europe | | |
      1. 7.2.1 Germany | | |
      2. 7.2.2 UK | | |
      3. 7.2.3 France | | |
      4. 7.2.4 Italy | | |
      5. 7.2.5 Spain | | |
      6. 7.2.6 Nordic Countries | | |
      7. 7.2.7 Russia | | |
      8. 7.2.8 Rest of Europe | |
    3. 7.3 Asia-Pacific | | |
      1. 7.3.1 China | | |
      2. 7.3.2 India | | |
      3. 7.3.3 Japan | | |
      4. 7.3.4 South Korea | | |
      5. 7.3.5 ASEAN | | |
      6. 7.3.6 Rest of Asia-Pacific | |
    4. 7.4 South America | | |
      1. 7.4.1 Brazil | | |
      2. 7.4.2 Argentina | | |
      3. 7.4.3 Rest of South America | |
    5. 7.5 Middle East & Africa | | |
      1. 7.5.1 Saudi Arabia | | |
      2. 7.5.2 UAE | | |
      3. 7.5.3 South Africa | | |
      4. 7.5.4 Egypt | | |
      5. 7.5.5 Rest of MEA | |
  8. 8 Future Outlook (2026–2035) | |
    1. 8.1 Electrification Supercycle | |
    2. 8.2 Wide-Bandgap at Scale | |
    3. 8.3 AI-Driven Design and Digital Manufacturing | |
    4. 8.4 ESG, PFAS, and Circularity | |
  9. 9 Segmentation Analysis | |
    1. 9.1 By Components | | |
      1. 9.1.1 Substrate | | |
      2. 9.1.2 Baseplate | | |
      3. 9.1.3 Die Attach | | |
      4. 9.1.4 Substrate Attach | | |
      5. 9.1.5 Encapsulations | | |
      6. 9.1.6 Interconnections | | |
      7. 9.1.7 Others | |
    2. 9.2 By Power Device Type | | |
      1. 9.2.1 IGBT Modules | | |
      2. 9.2.2 Si-MOSFET Modules | | |
      3. 9.2.3 SiC Modules | | |
      4. 9.2.4 GaN Modules | | |
      5. 9.2.5 Others | |
    3. 9.3 By Power Range | | |
      1. 9.3.1 Below 600 V | | |
      2. 9.3.2 600-1,200 V | | |
      3. 9.3.3 1,200-1,700 V | | |
      4. 9.3.2 Above 1,700 V | |
    4. 9.4 By End-User | | |
      1. 9.4.1 Automotive | | |
      2. 9.4.2 Industrial | | |
      3. 9.4.3 Consumer Electronics | | |
      4. 9.4.4 Renewable Energy | | |
      5. 9.4.5 Others | |
  10. 10 Competitive Landscape | |
    1. 10.1 Market Concentration Analysis | |
    2. 10.2 Competitive Benchmarking Matrix | |
    3. 10.3 Company Profiles | | |
      1. 10.3.1 Infineon Technologies AG | | |
      2. 10.3.2 Mitsubishi Electric Corporation | | |
      3. 10.3.3 Fuji Electric Co., Ltd. | | |
      4. 10.3.4 Semikron Danfoss | | |
      5. 10.3.5 STMicroelectronics | | |
      6. 10.3.6 onsemi | | |
      7. 10.3.7 ROHM Co., Ltd. | | |
      8. 10.3.8 Wolfspeed, Inc. | | |
      9. 10.3.9 Hitachi Energy | | |
      10. 10.3.10 Toshiba Electronic Devices & Storage | | |
      11. 10.3.11 Amkor Technology | |
  11. 11 Recent News & Developments | |
  12. 12 Report Scope and Methodology | |
  13. 13 Detailed Sources and Citations | |
  14. 14 Frequently Asked Questions (FAQs) | | LIST OF TABLES | |
  15. TABLE 1 Global Power Module Packaging Market Summary, 2025–2035 | |
  16. TABLE 2 Global Power Module Packaging Market Size & Forecast, by Revenue (USD Billion), 2021–2035 | |
  17. TABLE 3 Driver Impact Analysis, 2026–2035 | |
  18. TABLE 4 Restraints Impact Analysis, 2026–2035 | |
  19. TABLE 5 Regional Market Summary, 2025 | |
  20. TABLE 6 North America Power Module Packaging Market, by Country, 2025 | |
  21. TABLE 7 Europe Power Module Packaging Market, by Country, 2025 | |
  22. TABLE 8 Asia-Pacific Power Module Packaging Market, by Country, 2025 | |
  23. TABLE 9 South America Power Module Packaging Market, by Country, 2025 | |
  24. TABLE 10 Middle East & Africa Power Module Packaging Market, by Country, 2025 | |
  25. TABLE 11 Global Power Module Packaging Market, by Components, 2025 | |
  26. TABLE 12 Global Power Module Packaging Market, by Power Device Type, 2025 | |
  27. TABLE 13 Global Power Module Packaging Market, by Power Range, 2025 | |
  28. TABLE 14 Global Power Module Packaging Market, by End-User, 2025 | |
  29. TABLE 15 Competitive Benchmarking Matrix, 2025 | |
  30. TABLE 16 Report Scope and Methodology | |
  31. TABLE 17 Detailed Sources and Citations | | LIST OF FIGURES | |
  32. FIGURE 1 Market Dynamics Overview — Drivers, Restraints, Opportunities | |
  33. FIGURE 2 Power Module Packaging Value Chain Analysis | |
  34. FIGURE 3 Porter's Five Forces Analysis | |
  35. FIGURE 4 Global Market Size Trend (USD Billion), 2021–2035 | |
  36. FIGURE 5 Market Share by Components, 2025 | |
  37. FIGURE 6 Market Share by Power Device Type, 2025 | |
  38. FIGURE 7 Market Share by Power Range, 2025 | |
  39. FIGURE 8 Market Share by End-User, 2025 | |
  40. FIGURE 9 Regional Market Share, 2025 | |
  41. FIGURE 10 Asia-Pacific Country-Level Share, 2025 | |
  42. FIGURE 11 Competitive Landscape — Revenue Share Ranges of Key Players, 2025 | |
  43. FIGURE 12 Company Positioning Matrix

Segmentation Quick Reference

DimensionSub-SegmentsDominant SegmentFastest Growing Segment
By ComponentsSubstrate, Baseplate, Die Attach, Substrate Attach, Encapsulations, Interconnections, OthersSubstrate (34.8% share)Encapsulations (10.3% CAGR)
By Power Device TypeIGBT Modules, Si-MOSFET Modules, SiC Modules, GaN Modules, OthersSiC Modules (39.4% share)GaN Modules (11.4% CAGR)
By Power RangeBelow 600 V, 600-1,200 V, 1,200-1,700 V, Above 1,700 V600-1,200 V (37.0% share)Above 1,700 V (9.8% CAGR)
By End-UserAutomotive, Industrial, Consumer Electronics, Renewable Energy, OthersAutomotive (45.2% share)Renewable Energy (12.1% CAGR)
By RegionNorth America, Europe, Asia-Pacific, South America, Middle East & AfricaAsia-Pacific (46.5% share)Asia-Pacific (46.5% share)

Market Segmentation Overview

By Components

Sub-SegmentKey Trend
SubstrateSilicon-nitride AMB displacing alumina DBC in SiC modules
BaseplateAlSiC composites replacing copper to cut weight
Die AttachSintered silver and copper replacing lead solder
Substrate AttachLow-temperature nano-silver pastes eliminating voids
EncapsulationsSilicone gels rated for high partial-discharge stress
InterconnectionsCopper clips and ribbons reducing loop inductance
OthersPhase-change thermal interface films

Substrate leads this dimension because SiC dies demand ceramics that combine isolation with high thermal conductivity and crack resistance. Encapsulations grow fastest, as 1,200 V automotive and 3,300 V rail modules need gels that suppress partial discharge across wide temperature swings. Die Attach follows as lead-free sintering becomes standard in AQG 324-qualified designs.

By Power Device Type

Sub-SegmentKey Trend
IGBT ModulesShare eroding but entrenched in rail and heavy industry
Si-MOSFET ModulesPrice pressure; suppliers bundling drivers and sensors
SiC ModulesDefault choice for 800 V traction inverters
GaN ModulesRapid uptake in data-center and onboard-charger designs
OthersNiche hybrid and thyristor formats

SiC Modules dominate because their efficiency gains in traction inverters justify higher die and packaging costs. GaN Modules grow fastest on high-frequency operation that shrinks magnetics in data-center power shelves and onboard chargers. IGBT Modules retain revenue in cost-sensitive and legacy platforms even as their share declines.

By Power Range

Sub-SegmentKey Trend
Below 600 VEmbedded-die formats for 48 V distribution
600-1,200 VStandard footprints speeding EV design cycles
1,200-1,700 VSolar and industrial drive inverters
Above 1,700 V3,300 V SiC converters for high-speed rail

The 600-1,200 V class leads because it maps directly onto 400 V and 800 V vehicle batteries and fast chargers. Above 1,700 V grows fastest as rail operators and grid utilities adopt SiC converters, though stacked substrates and IEC 60664-1 creepage rules raise packaging complexity. Below 600 V modules compete on assembly cost through embedded-die approaches.

By End-User

Sub-SegmentKey Trend
Automotive800 V platforms requiring 200 kW-class modules
IndustrialVariable-frequency drives and robotics
Consumer ElectronicsCompact GaN fast chargers
Renewable EnergyDouble-sided cooling for 25-year inverter life
OthersRail, aerospace, and telecom power

Automotive leads on sheer EV inverter and onboard-charger volume, with OEMs dictating qualification standards for the whole supply chain. Renewable Energy grows fastest as solar and offshore wind inverters specify long-life modules with robust encapsulation. Industrial demand stays stable, anchored by motor drives that favor proven IGBT and SiC packages.

7 minutes ago

Download PDF ×

We do not share your information with anyone. However, we may send you emails based on your report interest from time to time. You may contact us at any time to opt-out.