Positive Displacement Pumps Market (2026 - 2035)

ID: MRFR/EnP/21132-HCR 111 Pages Pradeep Nandi Last Updated: October 16, 2026
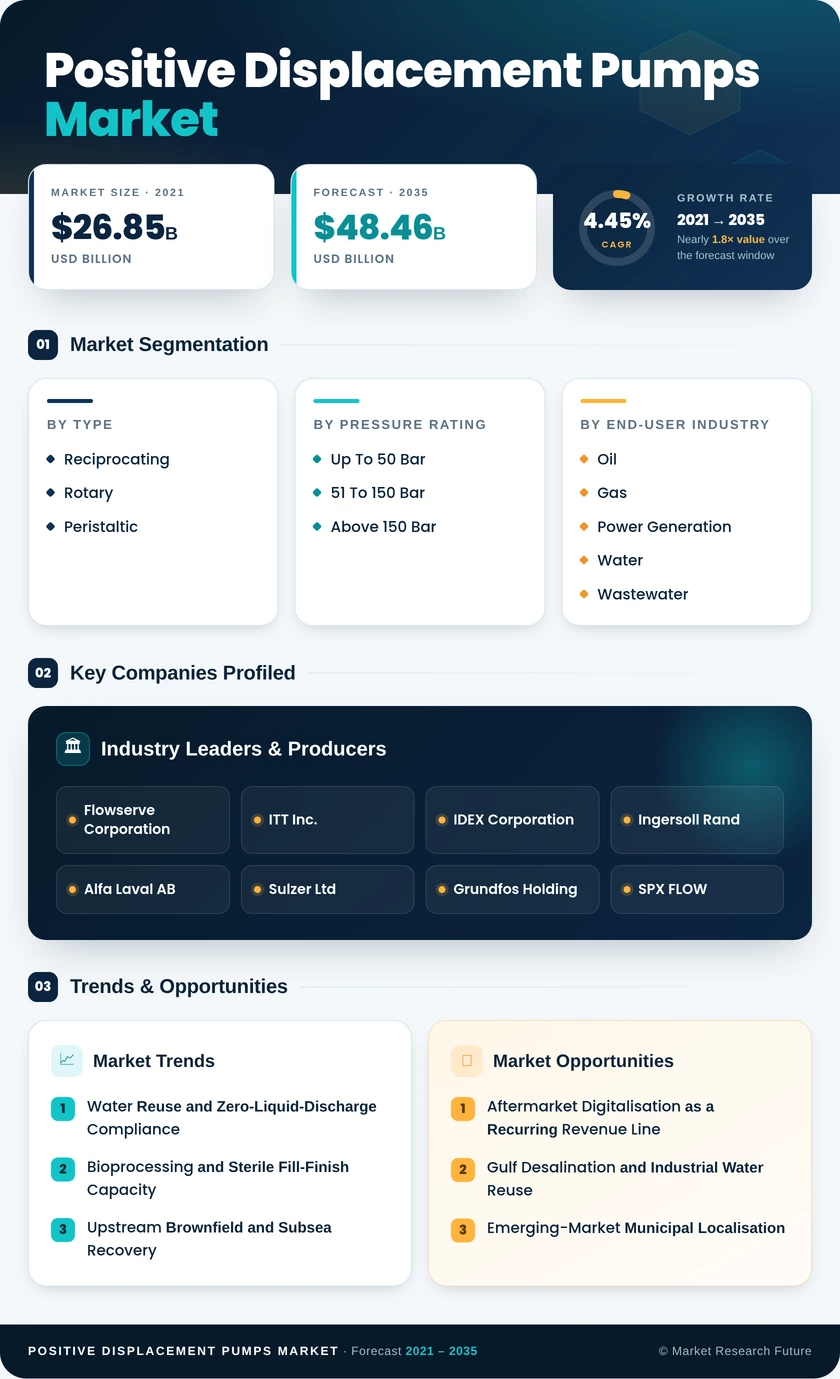
Positive Displacement Pumps Market Research Report By Type (Reciprocating, Rotary, Peristaltic), By Pressure Rating (Up To 50 Bar, 51 To 150 Bar, Above 150 Bar), By End-User Industry (Oil and Gas, Power Generation, Water and Wastewater, Chemical and Petrochemical, Food and Beverage, Pharmaceutical and Biotechnology, Mining and Minerals, Pulp and Paper, Others) and By Regional (North America, Europe, South America, Asia Pacific, Middle East and Africa) - Growth & Industry Forecast to 2035
Positive Displacement Pumps Market
Market Size
Forecast Period2026-2035
CAGR (2026-2035)4.45%
2025 Market SizeUSD 31.42 Billion
2035 Market SizeUSD 48.46 Billion
Key Players
Flowserve Corporation
ITT Inc.
IDEX Corporation
Ingersoll Rand
Alfa Laval AB
Sulzer Ltd
Opportunities
  • Aftermarket Digitalisation as a Recurring Revenue Line
  • Gulf Desalination and Industrial Water Reuse
  • Emerging-Market Municipal Localisation
  1. 1 Market Summary |
    1. 1.1 Study Assumptions & Market Definition |
    2. 1.2 Scope of the Study |
    3. 1.3 Research Methodology
  2. 2 Key Report Takeaways |
    1. 2.1 By Technology |
    2. 2.2 By Sector |
    3. 2.3 By Geography
  3. 3 Market Size & Forecast (2021–2035) |
    1. 3.1 Historical Market Size (2021–2025) |
    2. 3.2 Current & Forecast Market Size (2026–2035) |
    3. 3.3 Market Size by Revenue (USD Billion) |
    4. 3.4 Year-over-Year Growth Analysis
  4. 4 Driver Impact Analysis |
    1. 4.1 Water Reuse and Zero-Liquid-Discharge Compliance |
    2. 4.2 Bioprocessing and Sterile Fill-Finish Capacity |
    3. 4.3 Upstream Brownfield and Subsea Recovery
  5. 5 Restraints Impact Analysis |
    1. 5.1 Alloy Cost Volatility and Margin Compression |
    2. 5.2 Competitive Substitution at the Viscosity Boundary
  6. 6 Opportunities |
    1. 6.1 Aftermarket Digitalisation as a Recurring Revenue Line |
    2. 6.2 Gulf Desalination and Industrial Water Reuse |
    3. 6.3 Emerging-Market Municipal Localisation |
    4. 6.4 Hygienic Processing Retrofit Cycle |
    5. 6.5 Carbon Capture and Hydrogen Ancillary Duty
  7. 7 Regional Market Share & Country-Level Analysis |
    1. 7.1 North America | |
      1. 7.1.1 US | |
      2. 7.1.2 Canada | |
      3. 7.1.3 Mexico |
    2. 7.2 Europe | |
      1. 7.2.1 Germany | |
      2. 7.2.2 UK | |
      3. 7.2.3 France | |
      4. 7.2.4 Italy | |
      5. 7.2.5 Spain | |
      6. 7.2.6 Nordic Countries | |
      7. 7.2.7 Russia | |
      8. 7.2.8 Rest of Europe |
    3. 7.3 Asia-Pacific | |
      1. 7.3.1 China | |
      2. 7.3.2 India | |
      3. 7.3.3 Japan | |
      4. 7.3.4 South Korea | |
      5. 7.3.5 ASEAN | |
      6. 7.3.6 Rest of Asia-Pacific |
    4. 7.4 South America | |
      1. 7.4.1 Brazil | |
      2. 7.4.2 Argentina | |
      3. 7.4.3 Rest of South America |
    5. 7.5 Middle East & Africa | |
      1. 7.5.1 Saudi Arabia | |
      2. 7.5.2 UAE | |
      3. 7.5.3 South Africa | |
      4. 7.5.4 Egypt | |
      5. 7.5.5 Rest of Middle East & Africa
  8. 8 Future Outlook (2026–2035) |
    1. 8.1 Autonomous Operation & Predictive Maintenance |
    2. 8.2 Electrification & Drive Integration |
    3. 8.3 Water Scarcity as a Structural Demand Floor |
    4. 8.4 Sustainability Disclosure & Total Cost Accounting
  9. 9 Market Segmentation Analysis |
    1. 9.1 By Type | |
      1. 9.1.1 Reciprocating | |
      2. 9.1.2 Rotary | |
      3. 9.1.3 Peristaltic |
    2. 9.2 By Pressure Rating | |
      1. 9.2.1 Up To 50 Bar | |
      2. 9.2.2 51 To 150 Bar | |
      3. 9.2.3 Above 150 Bar |
    3. 9.3 By End-User Industry | |
      1. 9.3.1 Oil and Gas | |
      2. 9.3.2 Power Generation | |
      3. 9.3.3 Water and Wastewater | |
      4. 9.3.4 Chemical and Petrochemical | |
      5. 9.3.5 Food and Beverage | |
      6. 9.3.6 Pharmaceutical and Biotechnology | |
      7. 9.3.7 Mining and Minerals | |
      8. 9.3.8 Pulp and Paper | |
      9. 9.3.9 Others
  10. 10 Competitive Landscape |
    1. 10.1 Market Share Analysis (2026) |
    2. 10.2 Competitive Benchmarking Matrix |
    3. 10.3 Company Profiles | |
      1. 10.3.1 Flowserve Corporation | |
      2. 10.3.2 ITT Inc. | |
      3. 10.3.3 IDEX Corporation | |
      4. 10.3.4 Ingersoll Rand | |
      5. 10.3.5 Alfa Laval AB | |
      6. 10.3.6 Sulzer Ltd | |
      7. 10.3.7 Grundfos Holding | |
      8. 10.3.8 SPX FLOW, Inc. | |
      9. 10.3.9 KSB SE & Co. KGaA | |
      10. 10.3.10 NETZSCH Pumpen & Systeme | |
      11. 10.3.11 Watson-Marlow Fluid Technology | |
      12. 10.3.12 Dover Corporation (PSG)
  11. 11 Recent News & Developments
  12. 12 Report Scope & Methodology
  13. 13 Detailed Sources & Citations
  14. 14 Frequently Asked Questions (FAQs)
  15. 15 LIST OF TABLES Source: Market Research Future Analysis
  16. 16 LIST OF FIGURES Source: Market Research Future Analysis

Segmentation Quick Reference

DimensionSub-SegmentsDominant SegmentFastest Growing Segment
By TypeReciprocating; Rotary; PeristalticReciprocatingPeristaltic
By Pressure RatingUp To 50 Bar; 51 To 150 Bar; Above 150 BarUp To 50 BarAbove 150 Bar
By End-User IndustryOil and Gas; Power Generation; Water and Wastewater; Chemical and Petrochemical; Food and Beverage; Pharmaceutical and Biotechnology; Mining and Minerals; Pulp and Paper; OthersWater and WastewaterPharmaceutical and Biotechnology
By GeographyNorth America; Europe; Asia-Pacific; South America; Middle East & AfricaAsia-PacificAsia-Pacific


Market Segmentation Overview

By Type

Sub-SegmentKey Trend
ReciprocatingMigration from packed-gland to hydraulically balanced diaphragm heads for leak-free metering
RotaryTwin-screw and progressive-cavity designs displacing gear sets in variable-viscosity duty
PeristalticLonger-life hose compounds extending service intervals in abrasive slurry applications


Type selection is increasingly driven by containment and validation requirements rather than by hydraulic performance alone. Buyers facing fugitive emission limits or sterility documentation obligations now specify the flow-path architecture first and size the hydraulics second, a reversal of traditional engineering sequence that favours diaphragm and hose-based designs.

By Pressure Rating

Sub-SegmentKey Trend
Up To 50 BarStandardised skid packages with integrated drives shortening municipal delivery cycles
51 To 150 BarRising duplex and super-duplex content as process chemistries become more aggressive.
Above 150 BarSubsea and desalination duty pushing qualification testing and materials science forward


Pressure class correlates tightly with margin structure. Equipment above 150 bar carries engineered-to-order pricing, extended qualification, and shorter service intervals, while sub-50-bar duty has commoditised around catalogue configurations sold through distribution.

By End-User Industry

Sub-SegmentKey Trend
Oil and GasBrownfield recovery and produced-water reinjection dominate new awards
Power GenerationFlue-gas desulfurization wastewater treatment sustains dosing demand.
Water and WastewaterReuse mandates raise pump intensity per cubic metre treated.
Chemical and PetrochemicalFugitive emission rules accelerate seal-less adoption.
Food and BeverageClean-in-place validation retiring non-compliant legacy equipment
Pharmaceutical and BiotechnologySingle-use flow paths becoming default for sterile operations.
Mining and MineralsThickened tailings management expanding abrasive-duty scope.
Pulp and PaperCapacity renewal in Nordic and South American mills
OthersMarine scrubber and HVAC chemical dosing niches expanding


End-user mix determines cyclicality more than geography does. Suppliers weighted toward water, pharmaceutical, and food verticals show materially steadier revenue than those concentrated in oil and gas, and that stability difference is increasingly reflected in how investors value pump manufacturers.




Download PDF ×

We do not share your information with anyone. However, we may send you emails based on your report interest from time to time. You may contact us at any time to opt-out.