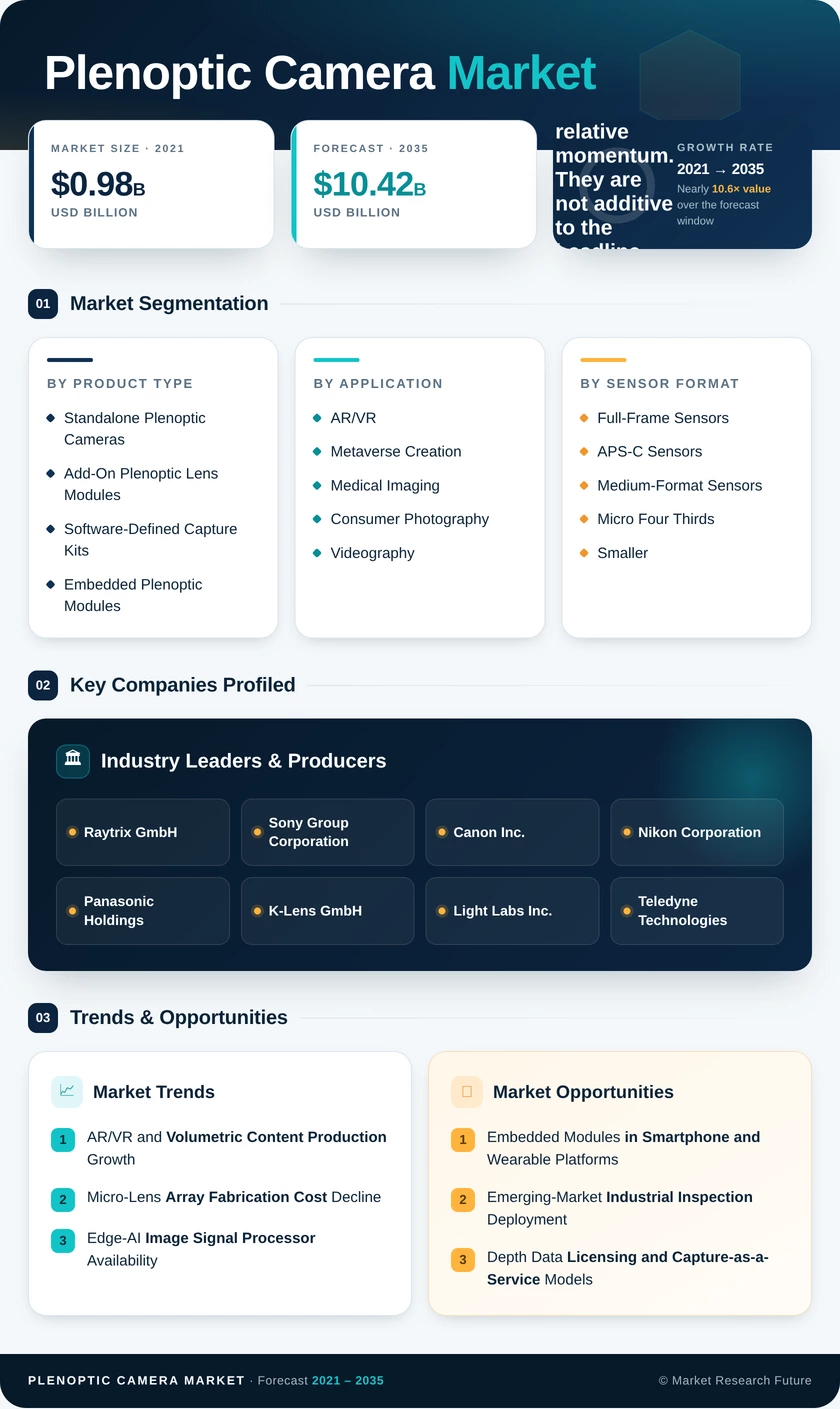
Plenoptic Camera Market (2026 – 2035)

ID: MRFR/SEM/6049-HCR 100 Pages Nirmit Biswas Last Updated: September 16, 2026
Plenoptic Camera Market Size, Share and Research Report By Product Type (Standalone Plenoptic Cameras, Add-On Plenoptic Lens Modules, Software-Defined Capture Kits, and Embedded Plenoptic Modules), By Application (AR/VR and Metaverse Creation, Medical Imaging, Consumer Photography and Videography, Industrial Inspection, and Defense and Surveillance), By Sensor Format (Full-Frame Sensors, APS-C Sensors, Medium-Format Sensors, and Micro Four Thirds and Smaller), By End-User Industry (Media and Entertainment, Healthcare, Manufacturing, Aerospace and Defense, Automotive, and Research and Academia) – Industry Forecast Till 2035.
Plenoptic Camera Market
Market Size
Forecast Period2026-2035
CAGR (2026-2035)16.1%
2025 Market SizeUSD 2.03 Billion
2035 Market SizeUSD 10.42 Billion
Key Players
Raytrix GmbH
Sony Group Corporation
Canon Inc.
Nikon Corporation
Panasonic Holdings
K-Lens GmbH
Opportunities
  • Embedded Modules in Smartphone and Wearable Platforms
  • Emerging-Market Industrial Inspection Deployment
  • Depth Data Licensing and Capture-as-a-Service Models
  1. 1 Market Summary | |
    1. 1.1 Study Assumptions & Market Definition | |
    2. 1.2 Scope of the Study | |
    3. 1.3 Research Methodology | |
  2. 2 Key Report Takeaways | |
    1. 2.1 By Product Type | |
    2. 2.2 By Application | |
    3. 2.3 By Sensor Format | |
    4. 2.4 By End-User Industry | |
    5. 2.5 By Region | |
  3. 3 Market Size and Forecast (2021–2035) | |
    1. 3.1 Historical Market Size (2021–2024) | |
    2. 3.2 Base Year Estimate (2025) | |
    3. 3.3 Forecast Market Size (2026–2035) | |
    4. 3.4 Year-over-Year Growth Analysis | |
  4. 4 Driver Impact Analysis | |
    1. 4.1 AR/VR and Volumetric Content Production Growth | |
    2. 4.2 Micro-Lens Array Fabrication Cost Decline | |
    3. 4.3 Edge-AI Image Signal Processor Availability | |
    4. 4.4 Defense Passive-Ranging Procurement | |
    5. 4.5 Medical Intraoperative Depth Imaging Adoption | |
    6. 4.6 Robotics and Industrial Inspection Depth Accuracy Needs | |
    7. 4.7 Developer Ecosystem Around Software-Defined Capture | |
  5. 5 Restraints Impact Analysis | |
    1. 5.1 Effective Resolution Loss Versus Conventional Sensors | |
    2. 5.2 Absence of Interchange Standards for Ray-Field Data | |
    3. 5.3 Specialty Optics Supply Concentration | |
    4. 5.4 Compute and Storage Overhead Per Capture | |
    5. 5.5 Clinical Validation and Reimbursement Lag | |
  6. 6 Opportunities | |
    1. 6.1 Embedded Modules in Smartphone and Wearable Platforms | |
    2. 6.2 Emerging-Market Industrial Inspection Deployment | |
    3. 6.3 Depth Data Licensing and Capture-as-a-Service Models | |
    4. 6.4 Privacy-Preserving Analytics in Regulated Environments | |
    5. 6.5 Retrofit Lens Modules for Installed Camera Bodies | |
  7. 7 Regional Market Share and Country-Level Analysis | |
    1. 7.1 North America | | |
      1. 7.1.1 US | | |
      2. 7.1.2 Canada | | |
      3. 7.1.3 Mexico | |
    2. 7.2 Europe | | |
      1. 7.2.1 Germany | | |
      2. 7.2.2 UK | | |
      3. 7.2.3 France | | |
      4. 7.2.4 Italy | | |
      5. 7.2.5 Spain | | |
      6. 7.2.6 Nordic Countries | | |
      7. 7.2.7 Russia | | |
      8. 7.2.8 Rest of Europe | |
    3. 7.3 Asia-Pacific | | |
      1. 7.3.1 China | | |
      2. 7.3.2 India | | |
      3. 7.3.3 Japan | | |
      4. 7.3.4 South Korea | | |
      5. 7.3.5 ASEAN | | |
      6. 7.3.6 Rest of Asia-Pacific | |
    4. 7.4 South America | | |
      1. 7.4.1 Brazil | | |
      2. 7.4.2 Argentina | | |
      3. 7.4.3 Rest of South America | |
    5. 7.5 Middle East & Africa | | |
      1. 7.5.1 Saudi Arabia | | |
      2. 7.5.2 UAE | | |
      3. 7.5.3 South Africa | | |
      4. 7.5.4 Egypt | | |
      5. 7.5.5 Rest of MEA | |
  8. 8 Future Outlook (2026–2035) | |
    1. 8.1 Depth Becomes Infrastructure Rather Than Feature | |
    2. 8.2 Reconstruction Moves Fully to Silicon | |
    3. 8.3 Standards Consolidation Unlocks Fleet Procurement | |
    4. 8.4 Sustainability Reporting Reshapes Production Logistics | |
  9. 9 Segmentation Analysis | |
    1. 9.1 By Product Type | | |
      1. 9.1.1 Standalone Plenoptic Cameras | | |
      2. 9.1.2 Add-On Plenoptic Lens Modules | | |
      3. 9.1.3 Software-Defined Capture Kits | | |
      4. 9.1.4 Embedded Plenoptic Modules | |
    2. 9.2 By Application | | |
      1. 9.2.1 AR/VR and Metaverse Creation | | |
      2. 9.2.2 Medical Imaging | | |
      3. 9.2.3 Consumer Photography and Videography | | |
      4. 9.2.4 Industrial Inspection | | |
      5. 9.2.5 Defense and Surveillance | |
    3. 9.3 By Sensor Format | | |
      1. 9.3.1 Full-Frame Sensors | | |
      2. 9.3.2 APS-C Sensors | | |
      3. 9.3.3 Medium-Format Sensors | | |
      4. 9.3.4 Micro Four Thirds and Smaller | |
    4. 9.4 By End-User Industry | | |
      1. 9.4.1 Media and Entertainment | | |
      2. 9.4.2 Healthcare | | |
      3. 9.4.3 Manufacturing | | |
      4. 9.4.4 Aerospace and Defense | | |
      5. 9.4.5 Automotive | | |
      6. 9.4.6 Research and Academia | |
  10. 10 Competitive Landscape | |
    1. 10.1 Market Concentration Analysis | |
    2. 10.2 Competitive Benchmarking Matrix | |
    3. 10.3 Company Profiles | | |
      1. 10.3.1 Raytrix GmbH | | |
      2. 10.3.2 Sony Group Corporation | | |
      3. 10.3.3 Canon Inc. | | |
      4. 10.3.4 Nikon Corporation | | |
      5. 10.3.5 Panasonic Holdings | | |
      6. 10.3.6 K-Lens GmbH | | |
      7. 10.3.7 Light Labs Inc. | | |
      8. 10.3.8 Teledyne Technologies | | |
      9. 10.3.9 Ricoh Company Ltd. | | |
      10. 10.3.10 OmniVision Technologies | | |
      11. 10.3.11 Ximea GmbH | |
  11. 11 Recent News & Developments | |
  12. 12 Report Scope and Methodology | |
    1. 12.1 Study Period & Base Year | |
    2. 12.2 Valuation Currency & Assumptions | |
    3. 12.3 Abbreviations | |
  13. 13 Detailed Sources and Citations | |
  14. 14 Frequently Asked Questions | | LIST OF TABLES | |
  15. TABLE 1 Global Plenoptic Camera Market Size & Forecast, by Revenue (USD Billion), 2021–2035 | |
  16. TABLE 2 Global Plenoptic Camera Market — Year-over-Year Growth Analysis, 2021–2035 | |
  17. TABLE 3 Driver Impact Analysis — Plenoptic Camera Market, 2026–2035 | |
  18. TABLE 4 Restraint Impact Analysis — Plenoptic Camera Market, 2026–2035 | |
  19. TABLE 5 Global Plenoptic Camera Market Size, by Region, 2021–2035 (USD Billion) | |
  20. TABLE 6 North America Plenoptic Camera Market Size, by Country, 2021–2035 (USD Billion) | |
  21. TABLE 7 Europe Plenoptic Camera Market Size, by Country, 2021–2035 (USD Billion) | |
  22. TABLE 8 Asia-Pacific Plenoptic Camera Market Size, by Country, 2021–2035 (USD Billion) | |
  23. TABLE 9 South America Plenoptic Camera Market Size, by Country, 2021–2035 (USD Billion) | |
  24. TABLE 10 Middle East & Africa Plenoptic Camera Market Size, by Country, 2021–2035 (USD Billion) | |
  25. TABLE 11 Global Plenoptic Camera Market Size, by Product Type, 2021–2035 (USD Billion) | |
  26. TABLE 12 Global Plenoptic Camera Market Size, by Application, 2021–2035 (USD Billion) | |
  27. TABLE 13 Global Plenoptic Camera Market Size, by Sensor Format, 2021–2035 (USD Billion) | |
  28. TABLE 14 Global Plenoptic Camera Market Size, by End-User Industry, 2021–2035 (USD Billion) | |
  29. TABLE 15 North America Plenoptic Camera Market Size, by Product Type, 2021–2035 (USD Billion) | |
  30. TABLE 16 North America Plenoptic Camera Market Size, by Application, 2021–2035 (USD Billion) | |
  31. TABLE 17 Europe Plenoptic Camera Market Size, by Application, 2021–2035 (USD Billion) | |
  32. TABLE 18 Europe Plenoptic Camera Market Size, by End-User Industry, 2021–2035 (USD Billion) | |
  33. TABLE 19 Asia-Pacific Plenoptic Camera Market Size, by Product Type, 2021–2035 (USD Billion) | |
  34. TABLE 20 Asia-Pacific Plenoptic Camera Market Size, by Sensor Format, 2021–2035 (USD Billion) | |
  35. TABLE 21 South America Plenoptic Camera Market Size, by End-User Industry, 2021–2035 (USD Billion) | |
  36. TABLE 22 Middle East & Africa Plenoptic Camera Market Size, by Application, 2021–2035 (USD Billion) | |
  37. TABLE 23 Competitive Benchmarking Matrix — Plenoptic Camera Market, 2026 | |
  38. TABLE 24 Company Profiles — Key Players, Plenoptic Camera Market | |
  39. TABLE 25 Recent Developments & Strategic Announcements, 2023–2025 | |
  40. TABLE 26 Report Scope & Methodology Summary | |
  41. TABLE 27 Detailed Sources and Citations Index | | LIST OF FIGURES | |
  42. FIGURE 1 Plenoptic Camera Market Dynamics — Drivers, Restraints, and Opportunities | |
  43. FIGURE 2 Industry Value Chain Analysis — Plenoptic Camera Market | |
  44. FIGURE 3 Porter's Five Forces Analysis — Plenoptic Camera Market | |
  45. FIGURE 4 Global Plenoptic Camera Market Size Trend, 2021–2035 (USD Billion) | |
  46. FIGURE 5 Year-over-Year Growth Rate Trend, 2022–2035 (%) | |
  47. FIGURE 6 Market Share by Product Type, 2025 vs 2035 (%) | |
  48. FIGURE 7 Market Share by Application, 2025 vs 2035 (%) | |
  49. FIGURE 8 Market Share by Sensor Format, 2025 (%) | |
  50. FIGURE 9 Market Share by End-User Industry, 2025 (%) | |
  51. FIGURE 10 Regional Revenue Share, 2025 (%) | |
  52. FIGURE 11 Regional CAGR Comparison, 2026–2035 (%) | |
  53. FIGURE 12 North America Country-Level Share, 2025 (%) | |
  54. FIGURE 13 Asia-Pacific Country-Level Share, 2025 (%) | |
  55. FIGURE 14 Competitive Landscape — Estimated Revenue Share Ranges, 2026 | |
  56. FIGURE 15 Strategic Positioning Matrix — Key Players

Segmentation Quick Reference

DimensionSub-SegmentsDominant SegmentFastest Growing Segment
By Product TypeStandalone Plenoptic Cameras; Add-On Plenoptic Lens Modules; Software-Defined Capture Kits; Embedded Plenoptic ModulesStandalone Plenoptic Cameras (44.1% share, 2025)Software-Defined Capture Kits (22.6% CAGR, 2026–2035)
By ApplicationAR/VR and Metaverse Creation; Medical Imaging; Consumer Photography and Videography; Industrial Inspection; Defense and SurveillanceAR/VR and Metaverse Creation (29.8% share, 2025)Medical Imaging (23.2% CAGR, 2026–2035)
By Sensor FormatFull-Frame Sensors; APS-C Sensors; Medium-Format Sensors; Micro Four Thirds and SmallerFull-Frame Sensors (USD 0.86 Billion, 2025)Medium-Format Sensors (20.5% CAGR, 2026–2035)
By End-User IndustryMedia and Entertainment; Healthcare; Manufacturing; Aerospace and Defense; Automotive; Research and AcademiaMedia and Entertainment (31.6% share, 2025)Healthcare (21.9% CAGR, 2026–2035)


Market Segmentation Overview

By Product Type

Sub-SegmentKey Trend
Standalone Plenoptic CamerasTurn-key optics and calibrated workflows retain studio and defense integrator loyalty
Add-On Plenoptic Lens ModulesRetrofit assemblies convert capital decisions into accessory purchases on existing mounts
Software-Defined Capture KitsCPU-GPU pipelines emulate ray-field arrays on commodity sensors below USD 900
Embedded Plenoptic ModulesMeta-optic layers shrink flange distance for handset and robotics integration


Standalone Plenoptic Cameras lead because studios and defense buyers pay for calibrated, plug-and-play reliability rather than configurability, and their procurement cycles reward proven optics over experimentation. Software-Defined Capture Kits grow fastest as developer toolchains let commodity sensors approximate ray-field capture at a fraction of hardware cost, pulling in application niches too small for hardware vendors to prospect. Add-On Plenoptic Lens Modules sit between the two, functioning as a conversion funnel toward full-body purchases within roughly eighteen months.

By Application

Sub-SegmentKey Trend
AR/VR and Metaverse CreationVolumetric stages replace multi-camera photogrammetry rigs at studios and publishers
Medical ImagingIntraoperative depth cues and multi-plane cytopathology scanning drive clearance activity
Consumer Photography and VideographyTap-to-refocus outputs move from novelty to expected handset capability
Industrial InspectionSub-millimeter accuracy holds where stereo pairs fail under specular glare
Defense and SurveillancePassive ranging avoids emission in contested electromagnetic environments


AR/VR and Metaverse Creation holds the largest application share because streaming platforms and game publishers have made volumetric capture a standing production budget line rather than a per-project experiment. Medical Imaging grows fastest as regulatory clearances accumulate and surgeons adopt depth delineation of vascular structures that flat endoscopic video cannot resolve. Industrial Inspection expands on a different logic entirely — buyers select plenoptic capture specifically for specular-surface performance that stereo baselines cannot match on machined metal.

By Sensor Format

Sub-SegmentKey Trend
Full-Frame SensorsShallow depth of field preserves cinematographic control alongside depth capture
APS-C SensorsWeight-to-pixel-density balance suits drone mapping and field robotics payloads
Medium-Format Sensors53 mm-class price declines open billboard-grade detail to commercial studios
Micro Four Thirds and SmallerNanophotonic stacks enable compact bodies without thick glass assemblies


Full-Frame Sensors generate the most revenue because cinematographers require artistic depth-of-field control that smaller formats cannot deliver, and professional rental fleets standardize around the format. Medium-Format Sensors grow fastest as falling 53 mm-class pricing brings billboard-grade detail within reach of commercial studios that previously treated the format as prohibitive. APS-C Sensors persist in a pragmatic niche where drone and field robotics payload budgets make body weight the binding constraint rather than resolution.

By End-User Industry

Sub-SegmentKey Trend
Media and EntertainmentStreaming originals and live extended-reality events sustain permanent stage investment
HealthcareSurgical visualization and diagnostic scanning expand as clearances accumulate
ManufacturingError-free assembly verification reduces defect escape costs on electronics lines
Aerospace and DefenseContested-environment passive sensing avoids revealing platform position
AutomotivePaint, panel, and cabin monitoring applications enter production programs
Research and AcademiaOptical physics and computer vision programs seed downstream commercial adoption


Media and Entertainment retains pole position because streaming original content and live extended-reality events justify permanent volumetric stages rather than rented per-project capacity. Healthcare accelerates fastest, with hospitals, research institutes, and device OEMs scaling deployment as depth-enabled surgical visualization clearances accumulate — though reimbursement lag still confines many early buyers to research budgets. Aerospace and Defense follows a procurement-cycle rhythm rather than a commercial one, with multi-year tranches producing lumpier revenue than manufacturing or automotive demand.




Download PDF ×

We do not share your information with anyone. However, we may send you emails based on your report interest from time to time. You may contact us at any time to opt-out.