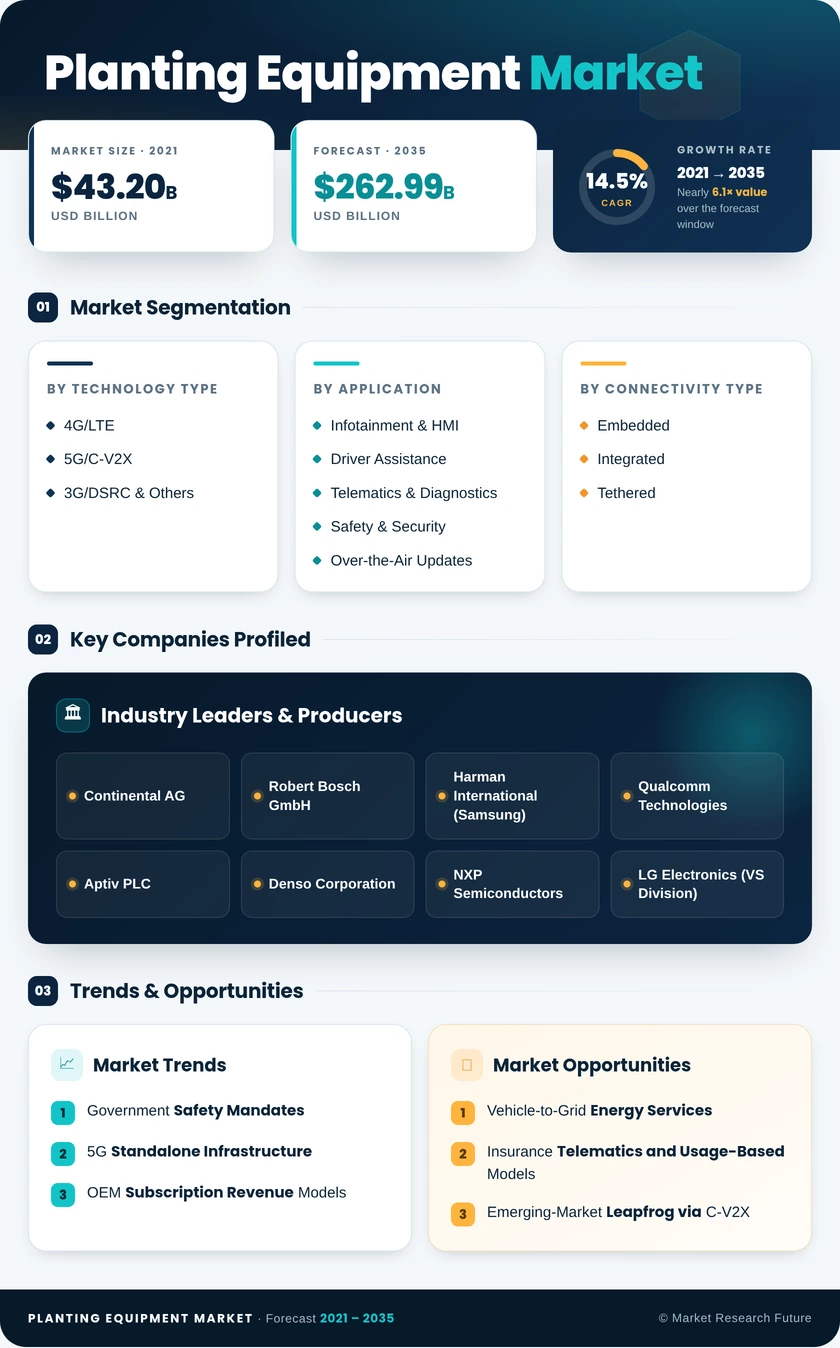
Planting Equipment Market

ID: MRFR/Equip/21058-HCR
100 Pages
Pradeep Nandi
Last Updated: July 22, 2026
Planting Equipment Market Research Report By Equipment Type (Planters, Transplanters, Seeders, Fertilizers, Pest Control Equipment), By Farming Type (Crop Farming, Horticulture, Livestock Farming, Fish Farming, Forestry), By Power Source (Tractor-Drawn, Self-Propelled, Manual, Electric, Hydraulic), By Application (Field Preparation, Planting, Fertilizing, Pest Control, Harvesting), By Size (Small, Medium, Large, Extra Large) and By Regional (North America, Europe, South America, Asia Pacific, Middle East and Africa) - Growth & Industry Forecast to 2035
Planting Equipment Market
Market Size
Forecast Period2025 - 2035
CAGR (2025 - 2035)6.21%
2024 Market Size$ 290.01 Billion
2025 Market Size$ 308.02 Billion
2035 Market Size$ 562.75 Billion
Key Players
John Deere
AGCOCorporation
CNH Industrial
Kubota Corporation
Buhler Industries
Mahindra & Mahindra
Opportunities
  • Global Population Growth
  • Technological Innovations
  • Sustainability Initiatives
  1. 1 Market Overview |
    1. 1.1 Study Assumptions & Market Definition |
    2. 1.2 Scope of the Study |
    3. 1.3 Research Methodology
  2. 2 Market Summary & Key Takeaways
  3. 3 Market Dynamics |
    1. 3.1 Market Drivers Analysis | |
      1. 3.1.1 Regulatory Safety Mandates (eCall, V2X) | |
      2. 3.1.2 5G Standalone Network Roll-Outs | |
      3. 3.1.3 OEM Subscription Revenue Model Transition | |
      4. 3.1.4 Autonomous-Driving R&D Investment | |
      5. 3.1.5 Smart-City Corridor Deployments | |
      6. 3.1.6 Cybersecurity Compliance Spending | |
      7. 3.1.7 Fleet Telematics & Logistics Digitization |
    2. 3.2 Market Restraints Analysis | |
      1. 3.2.1 Data-Privacy Regulation Fragmentation | |
      2. 3.2.2 Semiconductor and Chipset Supply Volatility | |
      3. 3.2.3 Consumer Willingness-to-Pay Limits | |
      4. 3.2.4 Spectrum-Allocation Delays for V2X | |
      5. 3.2.5 Legacy-Fleet Integration Complexity |
    3. 3.3 Market Opportunity Analysis | |
      1. 3.3.1 Vehicle-to-Grid Energy Services | |
      2. 3.3.2 Insurance Telematics and Usage-Based Models | |
      3. 3.3.3 Emerging-Market Leapfrog via C-V2X | |
      4. 3.3.4 Aftermarket Retrofit Platforms | |
      5. 3.3.5 AI-Driven Predictive Maintenance |
    4. 3.4 Industry Value Chain Analysis |
    5. 3.5 Porter's Five Forces Analysis
  4. 4 Global Connected Car Market Size & Forecast (2021–2035) |
    1. 4.1 Historical Market Size (2021–2025) |
    2. 4.2 Current & Forecast Market Size (2026–2035) |
    3. 4.3 Market Size by Revenue (USD Billion) |
    4. 4.4 Year-over-Year Growth Analysis
  5. 5 Segmentation Analysis |
    1. 5.1 By Technology Type | |
      1. 5.1.1 4G/LTE | |
      2. 5.1.2 5G/C-V2X | |
      3. 5.1.3 3G/DSRC & Others |
    2. 5.2 By Application | |
      1. 5.2.1 Infotainment & HMI | |
      2. 5.2.2 Driver Assistance | |
      3. 5.2.3 Telematics & Diagnostics | |
      4. 5.2.4 Safety & Security | |
      5. 5.2.5 Over-the-Air Updates |
    3. 5.3 By Connectivity Type | |
      1. 5.3.1 Embedded | |
      2. 5.3.2 Integrated | |
      3. 5.3.3 Tethered |
    4. 5.4 By Vehicle Connectivity | |
      1. 5.4.1 V2C (Vehicle-to-Cloud) | |
      2. 5.4.2 V2V (Vehicle-to-Vehicle) | |
      3. 5.4.3 V2I (Vehicle-to-Infrastructure) | |
      4. 5.4.4 V2G (Vehicle-to-Grid) |
    5. 5.5 By End Market | |
      1. 5.5.1 OEM-Fitted | |
      2. 5.5.2 Aftermarket
  6. 6 Regional Analysis |
    1. 6.1 North America | |
      1. 6.1.1 United States | |
      2. 6.1.2 Canada | |
      3. 6.1.3 Mexico |
    2. 6.2 Europe | |
      1. 6.2.1 Germany | |
      2. 6.2.2 United Kingdom | |
      3. 6.2.3 France | |
      4. 6.2.4 Italy | |
      5. 6.2.5 Spain | |
      6. 6.2.6 Nordic Countries | |
      7. 6.2.7 Russia | |
      8. 6.2.8 Rest of Europe |
    3. 6.3 Asia-Pacific | |
      1. 6.3.1 China | |
      2. 6.3.2 India | |
      3. 6.3.3 Japan | |
      4. 6.3.4 South Korea | |
      5. 6.3.5 ASEAN | |
      6. 6.3.6 Rest of Asia-Pacific |
    4. 6.4 South America | |
      1. 6.4.1 Brazil | |
      2. 6.4.2 Argentina | |
      3. 6.4.3 Rest of South America |
    5. 6.5 Middle East & Africa | |
      1. 6.5.1 Saudi Arabia | |
      2. 6.5.2 UAE | |
      3. 6.5.3 South Africa | |
      4. 6.5.4 Egypt | |
      5. 6.5.5 Rest of MEA
  7. 7 Competitive Landscape |
    1. 7.1 Market Share Analysis (2025) |
    2. 7.2 Competitive Benchmarking Matrix |
    3. 7.3 Company Profiles | |
      1. 7.3.1 Continental AG | |
      2. 7.3.2 Robert Bosch GmbH | |
      3. 7.3.3 Harman International (Samsung) | |
      4. 7.3.4 Qualcomm Technologies | |
      5. 7.3.5 Aptiv PLC | |
      6. 7.3.6 Denso Corporation | |
      7. 7.3.7 NXP Semiconductors | |
      8. 7.3.8 LG Electronics | |
      9. 7.3.9 Visteon Corporation | |
      10. 7.3.10 ZF Friedrichshafen AG
  8. 8 Future Outlook & Strategic Recommendations (2026–2035) |
    1. 8.1 Software-Defined Vehicle Architectures |
    2. 8.2 Autonomous-Vehicle Data Ecosystems |
    3. 8.3 Electrification and Vehicle-to-Everything Integration |
    4. 8.4 Sustainability Reporting and ESG-Driven Fleet Procurement
  9. 9 Recent Developments & News
  10. 10 Frequently Asked Questions (FAQs)
  11. 11 Report Scope & Methodology |
    1. 11.1 Study Period & Base Year |
    2. 11.2 Data Sources & Citations |
    3. 11.3 Abbreviations
  12. 12 LIST OF TABLES |
  13. TABLE 1 Global Connected Car Market Size & Forecast, by Revenue (USD Billion), 2021–2035 |
  14. TABLE 2 Global Connected Car Market — Year-over-Year Growth Analysis, 2021–2035 |
  15. TABLE 3 Global Connected Car Market Size, by Technology Type, 2021–2035 (USD Billion) |
  16. TABLE 4 Global Connected Car Market Size, by Application, 2021–2035 (USD Billion) |
  17. TABLE 5 Global Connected Car Market Size, by Connectivity Type, 2021–2035 (USD Billion) |
  18. TABLE 6 Global Connected Car Market Size, by Vehicle Connectivity, 2021–2035 (USD Billion) |
  19. TABLE 7 Global Connected Car Market Size, by End Market, 2021–2035 (USD Billion) |
  20. TABLE 8 Global Connected Car Market Size, by Region, 2021–2035 (USD Billion) |
  21. TABLE 9 North America Connected Car Market Size, by Country, 2021–2035 (USD Billion) |
  22. TABLE 10 Europe Connected Car Market Size, by Country, 2021–2035 (USD Billion) |
  23. TABLE 11 Asia-Pacific Connected Car Market Size, by Country, 2021–2035 (USD Billion) |
  24. TABLE 12 South America Connected Car Market Size, by Country, 2021–2035 (USD Billion) |
  25. TABLE 13 Middle East & Africa Connected Car Market Size, by Country, 2021–2035 (USD Billion) |
  26. TABLE 14 Driver Impact Analysis — Connected Car Market, 2026–2035 |
  27. TABLE 15 Restraint Impact Analysis — Connected Car Market, 2026–2035 |
  28. TABLE 16 Competitive Benchmarking Matrix — Global Connected Car Market, 2025 |
  29. TABLE 17 Recent Developments & Strategic Announcements, 2023–2025 |
  30. TABLE 18 Report Scope & Methodology Summary |
  31. TABLE 19 Detailed Sources and Citations
  32. 13 LIST OF FIGURES |
  33. FIGURE 1 Connected Car Market Dynamics — Drivers, Restraints, and Opportunities |
  34. FIGURE 2 Industry Value Chain Analysis — Connected Car Market |
  35. FIGURE 3 Porter's Five Forces Analysis — Connected Car Market |
  36. FIGURE 4 Global Connected Car Market Size Trend (USD Billion), 2021–2035 |
  37. FIGURE 5 Connected Car Market Share, by Technology Type (%), 2025 |
  38. FIGURE 6 Connected Car Market Share, by Application (%), 2025 |
  39. FIGURE 7 Connected Car Market Share, by Connectivity Type (%), 2025 |
  40. FIGURE 8 Connected Car Market Share, by Vehicle Connectivity (%), 2025 |
  41. FIGURE 9 Connected Car Market Share, by End Market (%), 2025 |
  42. FIGURE 10 Connected Car Market Share, by Region (%), 2025 |
  43. FIGURE 11 Competitive Landscape — Market Share of Key Players (%), 2025

Segmentation Quick Reference

DimensionSub-SegmentsDominant SegmentFastest Growing Segment
Technology Type4G/LTE; 5G/C-V2X; 3G/DSRC & Others4G/LTE5G/C-V2X
ApplicationInfotainment & HMI; Driver Assistance; Telematics & Diagnostics; Safety & Security; Over-the-Air UpdatesInfotainment & HMIOver-the-Air Updates
Connectivity TypeEmbedded; Integrated; TetheredEmbeddedIntegrated
Vehicle ConnectivityV2C; V2V; V2I; V2GV2CV2G
End MarketOEM-Fitted; AftermarketOEM-FittedAftermarket
RegionAsia-Pacific; North America; Europe; South America; MEAAsia-PacificMiddle East & Africa


Market Segmentation Overview

By Technology Type

Sub-SegmentKey Trend
4G/LTERemains dominant due to ubiquitous infrastructure; module costs below USD 15
5G/C-V2XRapid adoption driven by automaker SoC integration and spectrum allocation
3G/DSRC & OthersDeclining share as 3G sunsets; DSRC limited to legacy U.S. deployments


4G/LTE continues to underpin the majority of connected-vehicle deployments globally, but the technology landscape is shifting decisively toward 5G/C-V2X as automakers design next-generation platforms around ultra-low-latency communication.

By Application

Sub-SegmentKey Trend
Infotainment & HMISmartphone-mirroring and voice-assistant integration drive consumer pull
Driver AssistanceADAS content per vehicle rising with L2+ proliferation
Telematics & DiagnosticsFleet operators demand real-time asset health visibility
Safety & SecurityeCall and stolen-vehicle-recovery mandates expand baseline
Over-the-Air UpdatesOEMs monetize post-sale feature unlocks and recall remediation


Infotainment & HMI captures the largest share because it directly shapes the consumer purchase decision, while OTA updates represent the fastest-growing application thanks to their role in enabling software-defined-vehicle business models.

By Connectivity Type

Sub-SegmentKey Trend
EmbeddedeSIM adoption makes factory-installed connectivity the default
IntegratedSmartphone-bridge architectures appeal to cost-sensitive segments
TetheredAftermarket dongles serve legacy vehicles and short-term connectivity needs


Embedded connectivity dominates as automakers bundle multi-year data plans with vehicle purchases, while integrated architectures grow fastest as mid-range models adopt smartphone-mirroring solutions.

By Vehicle Connectivity

Sub-SegmentKey Trend
V2C (Vehicle-to-Cloud)Cloud analytics power navigation, diagnostics, and content streaming
V2V (Vehicle-to-Vehicle)Cooperative awareness messages support collision avoidance
V2I (Vehicle-to-Infrastructure)Smart-signal and toll-collection applications expand
V2G (Vehicle-to-Grid)Bidirectional EV charging creates energy-revenue opportunities


V2C leads because it underpins the widest range of consumer and enterprise applications, from real-time navigation to predictive maintenance. V2G grows fastest as the intersection of electrification and connectivity creates new revenue streams.

By End Market

Sub-SegmentKey Trend
OEM-FittedRegulatory mandates make factory connectivity standard
AftermarketFleet-management and insurance-telematics devices drive retrofit adoption


OEM-Fitted solutions hold the majority of revenue because government mandates in the EU, China, and the U.S. require embedded connectivity in new vehicles. The aftermarket segment grows rapidly as fleet operators retrofit older vehicles with telematics devices.




Download PDF ×

We do not share your information with anyone. However, we may send you emails based on your report interest from time to time. You may contact us at any time to opt-out.