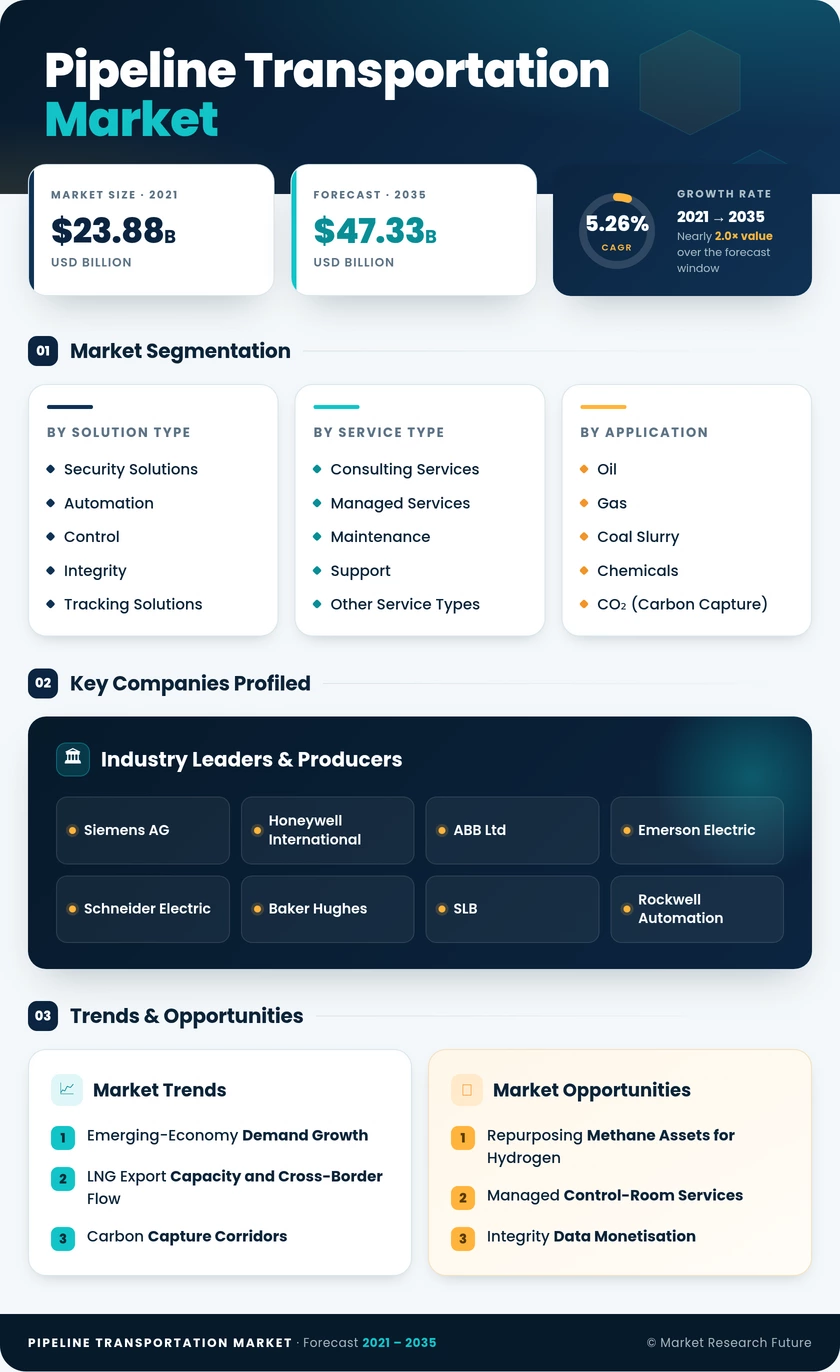
Segmentation Quick Reference
| Dimension | Sub-Segments | Dominant Segment | Fastest Growing Segment |
| By Solution Type | Security Solutions; Automation and Control; Integrity and Tracking Solutions; Network Communication Solutions; Other Solution Types | Network Communication Solutions | Automation and Control |
| By Service Type | Consulting Services; Managed Services; Maintenance and Support; Other Service Types | Maintenance and Support | Managed Services |
| By Application | Oil and Gas; Coal Slurry; Chemicals; CO₂ (Carbon Capture); Other Applications | Oil and Gas | CO₂ (Carbon Capture) |
| By Pipeline Operation | Transmission Pipelines; Distribution Pipelines; Gathering Systems | Transmission Pipelines | Gathering Systems |
| By Geography | North America; Europe; Asia-Pacific; South America; Middle East & Africa | North America | Asia-Pacific |
Market Segmentation Overview
By Solution Type
| Sub-Segment | Key Trend |
| Security Solutions | Directive-driven OT segmentation and cryptographic device attestation |
| Automation and Control | Templated control logic shrinking commissioning from months to weeks |
| Integrity and Tracking Solutions | Continuous fibre-optic sensing displacing periodic inspection cycles |
| Network Communication Solutions | Right-of-way fibre retrofit with spare-strand monetisation |
| Other Solution Types | Custody-transfer metering and hydraulic simulation upgrades |
Solution spend is migrating from capital hardware toward configurable, certified software layers. Vendors that pre-validate control templates against regulatory acceptance criteria are winning share from bespoke integrators, particularly on brownfield retrofits where downtime windows are unforgiving.
By Service Type
| Sub-Segment | Key Trend |
| Consulting Services | Conversion feasibility and regulatory strategy work surging in Europe |
| Managed Services | Shared operations centres priced per kilometre per month |
| Maintenance and Support | Outcome-based contracts replacing time-and-materials billing |
| Other Service Types | Cybersecurity audit, operator certification and commissioning support |
Service revenue is proving stickier than product revenue as operators reduce in-house engineering headcount. Contract structures are shifting toward availability guarantees, which transfers performance risk to vendors and rewards those with mature remote diagnostics.
By Application
| Sub-Segment | Key Trend |
| Oil and Gas | Export tie-ins and expanded integrity assessment perimeters |
| Coal Slurry | Mine-to-port logistics investment concentrated in Asia-Pacific |
| Chemicals | Petrochemical cluster interconnection and specialty fluid handling |
| CO₂ (Carbon Capture) | Dense-phase specification and continuous composition monitoring |
| Other Applications | Water transfer, hydrogen blending and ammonia trial corridors |
Hydrocarbon applications remain the revenue anchor, but molecule diversity is rewriting engineering specifications. CO₂ and hydrogen corridors demand tighter tolerances than legacy methane service, lifting per-kilometre solution intensity meaningfully above historical norms.
By Pipeline Operation
| Sub-Segment | Key Trend |
| Transmission Pipelines | Re-rating and compression addition tied to export capacity |
| Distribution Pipelines | City-gas rollout with mandated leak-survey frequency |
| Gathering Systems | Previously unregulated mileage entering compliance perimeter |
Transmission absorbs the largest absolute investment because consequence area scales with diameter and pressure. Gathering is the growth story: regulatory expansion has forced instrumentation onto thousands of kilometres that historically operated on periodic inspection alone.
By Geography
| Sub-Segment | Key Trend |
| North America | LNG feedgas expansion and CO₂ trunk commissioning |
| Europe | Hydrogen backbone conversion with deferred amortisation financing |
| Asia-Pacific | State-programme grid extension at national procurement scale |
| South America | Unconventional basin takeaway debottlenecking |
| Middle East & Africa | Sour-gas gathering and regional export aggregation |
Regional demand logic differs sharply. Mature markets buy replacement and compliance; emerging markets buy capacity. Vendors structured to serve both — standardised platforms with locally staffed service depth — capture disproportionate share across the forecast period.


 Noah Malgeri
Co-Founder

 Peter Groot koerkamp
Account and Business Manager

 Younghwan Choi
Senior Retail Manager

 Mark Irwin
Management Consultant

 Akif Moroglu
Strategy & Business Development Director

 Guilherme Gomes Martins
Product Management Director

 Joseph Aguayo
Sales Operations & Pricing Manager

 La Terria Dodd
Program Support Specialist

 Rob Kooiker
Group Product Manager HVAC & Fire Protection GMA