Phosphorus Trichloride Market (2026 - 2035)

ID: MRFR/CnM/4277-HCR 111 Pages Chitranshi Jaiswal Last Updated: November 20, 2026
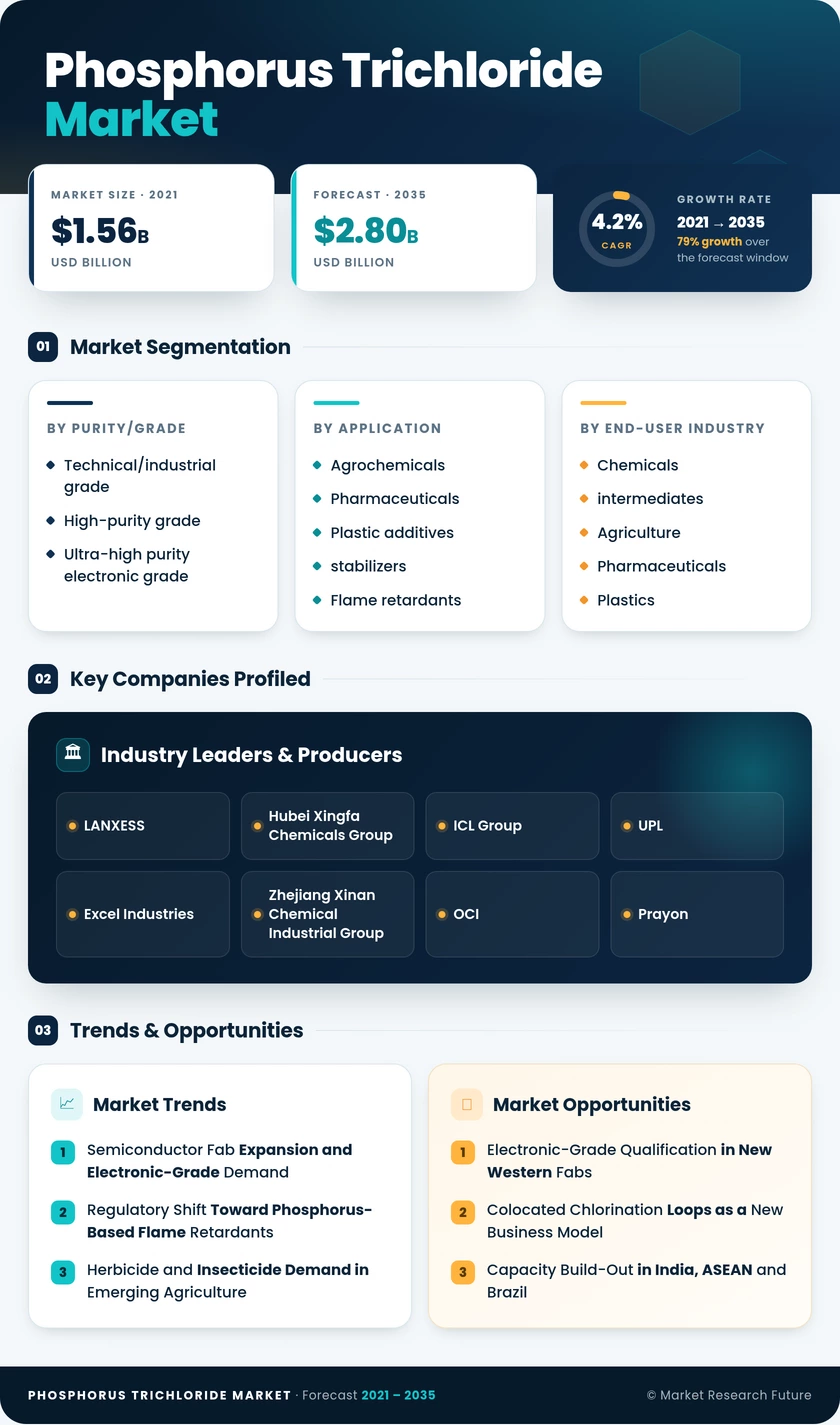
Phosphorus Trichloride Market Research Report Information By Purity/Grade (Technical/Industrial Grade, High-Purity Grade, and Ultra-High Purity Electronic Grade), By Application (Agrochemicals, Pharmaceuticals, Plastic Additives and Stabilizers, Flame Retardants, Surfactants and Detergents, Metal and Water Treatment Chemicals, and Others), By End-User Industry (Chemicals and Intermediates, Agriculture, Pharmaceuticals, Plastics and Polymers, Electronics and Semiconductors, and Others), And By Region (North America, Europe, Asia-Pacific, and Rest of the World) – Market Forecast Till 2035.
Phosphorus Trichloride Market
Market Size
Forecast Period2026-2035
CAGR (2026-2035)4.2%
2025 Market SizeUSD 1.85 Billion
2035 Market SizeUSD 2.80 Billion
Key Players
LANXESS
Hubei Xingfa Chemicals Group
ICL Group
UPL
Excel Industries
Zhejiang Xinan Chemical Industrial Group
Opportunities
  • Electronic-Grade Qualification in New Western Fabs
  • Colocated Chlorination Loops as a New Business Model
  • Capacity Build-Out in India, ASEAN and Brazil
  1. 1 Market Summary | |
  2. 2 Key Report Takeaways | |
    1. 2.1 By Purity/grade | |
    2. 2.2 By Application | |
    3. 2.3 By End-user Industry | |
    4. 2.4 By Region | |
  3. 3 Market Size and Forecast (2021–2035) | |
  4. 4 Driver Impact Analysis | |
    1. 4.1 Semiconductor Fab Expansion and Electronic-Grade Demand | |
    2. 4.2 Regulatory Shift Toward Phosphorus-Based Flame Retardants | |
    3. 4.3 Herbicide and Insecticide Demand in Emerging Agriculture | |
    4. 4.4 Lithium-Ion Electrolyte Salt Production | |
    5. 4.5 Phosphorus-Based Pharmaceutical Intermediates | |
    6. 4.6 Phosphite Antioxidant and Stabilizer Demand in Polymers | |
  5. 5 Restraints Impact Analysis | |
    1. 5.1 Chinese Overcapacity and Price Erosion in Technical Grade | |
    2. 5.2 Substitution by Thionyl Chloride in Chlorination Steps | |
    3. 5.3 Hazardous Handling and Transport Compliance Costs | |
    4. 5.4 Yellow Phosphorus Feedstock Volatility | |
    5. 5.5 Glyphosate Regulatory and Litigation Uncertainty | |
  6. 6 Opportunities | |
    1. 6.1 Electronic-Grade Qualification in New Western Fabs | |
    2. 6.2 Colocated Chlorination Loops as a New Business Model | |
    3. 6.3 Capacity Build-Out in India, ASEAN and Brazil | |
    4. 6.4 Batch Traceability and Quality Data Services | |
    5. 6.5 Halogen-Free Flame Retardants for EV Battery Enclosures | |
  7. 7 Regional Market Share and Country-Level Analysis | |
    1. 7.1 North America | | |
      1. 7.1.1 US | | |
      2. 7.1.2 Canada | | |
      3. 7.1.3 Mexico | |
    2. 7.2 Europe | | |
      1. 7.2.1 Germany | | |
      2. 7.2.2 UK | | |
      3. 7.2.3 France | | |
      4. 7.2.4 Italy | | |
      5. 7.2.5 Spain | | |
      6. 7.2.6 Nordic Countries | | |
      7. 7.2.7 Russia | | |
      8. 7.2.8 Rest of Europe | |
    3. 7.3 Asia-Pacific | | |
      1. 7.3.1 China | | |
      2. 7.3.2 India | | |
      3. 7.3.3 Japan | | |
      4. 7.3.4 South Korea | | |
      5. 7.3.5 ASEAN | | |
      6. 7.3.6 Rest of Asia-Pacific | |
    4. 7.4 South America | | |
      1. 7.4.1 Brazil | | |
      2. 7.4.2 Argentina | | |
      3. 7.4.3 Rest of South America | |
    5. 7.5 Middle East & Africa | | |
      1. 7.5.1 Saudi Arabia | | |
      2. 7.5.2 UAE | | |
      3. 7.5.3 South Africa | | |
      4. 7.5.4 Egypt | | |
      5. 7.5.5 Rest of MEA | |
  8. 8 Future Outlook (2026–2035) | |
    1. 8.1 Continuous and Digitally Controlled Chlorination | |
    2. 8.2 Semiconductor Supercycle and Electronic-Grade Supply | |
    3. 8.3 Electrification and Battery Materials | |
    4. 8.4 Sustainability Reporting and Circular Chlorine | |
  9. 9 Segmentation Analysis | |
    1. 9.1 By Purity/grade | | |
      1. 9.1.1 Technical/industrial grade | | |
      2. 9.1.2 High-purity grade | | |
      3. 9.1.3 Ultra-high purity electronic grade | |
    2. 9.2 By Application | | |
      1. 9.2.1 Agrochemicals | | |
      2. 9.2.2 Pharmaceuticals | | |
      3. 9.2.3 Plastic additives and stabilizers | | |
      4. 9.2.4 Flame retardants | | |
      5. 9.2.5 Surfactants and detergents | | |
      6. 9.2.6 Metal and water treatment chemicals | | |
      7. 9.2.7 Other applications | |
    3. 9.3 By End-user Industry | | |
      1. 9.3.1 Chemicals and intermediates | | |
      2. 9.3.2 Agriculture | | |
      3. 9.3.3 Pharmaceuticals | | |
      4. 9.3.4 Plastics and polymers | | |
      5. 9.3.5 Electronics and semiconductors | | |
      6. 9.3.6 Other end-user industries | |
  10. 10 Competitive Landscape | |
    1. 10.1 Market Concentration Analysis | |
    2. 10.2 Competitive Benchmarking Table | |
  11. 11 Recent News & Developments | |
  12. 12 Report Scope and Methodology | |
  13. 13 Detailed Sources and Citations | |
  14. 14 Frequently Asked Questions (FAQs) | | LIST OF TABLES | |
  15. TABLE 1 Global Market Snapshot, 2025–2035 | |
  16. TABLE 2 Global Market Size and Forecast, by Revenue (USD Billion), 2021–2035 | |
  17. TABLE 3 Driver Impact Analysis | |
  18. TABLE 4 Restraints Impact Analysis | |
  19. TABLE 5 Regional Summary, 2025 | |
  20. TABLE 6 North America Market, by Country, 2025 | |
  21. TABLE 7 Europe Market, by Country, 2025 | |
  22. TABLE 8 Asia-Pacific Market, by Country, 2025 | |
  23. TABLE 9 South America Market, by Country, 2025 | |
  24. TABLE 10 Middle East & Africa Market, by Country, 2025 | |
  25. TABLE 11 Market Segmentation, By Purity/grade, 2025 | |
  26. TABLE 12 Market Segmentation, by Application, 2025 | |
  27. TABLE 13 Market Segmentation, By End-user Industry, 2025 | |
  28. TABLE 14 Competitive Benchmarking Table | |
  29. TABLE 15 Report Scope and Methodology | |
  30. TABLE 16 Detailed Sources and Citations | | LIST OF FIGURES | |
  31. FIGURE 1 Market Dynamics Overview: Drivers, Restraints and Opportunities | |
  32. FIGURE 2 Value Chain Analysis: Phosphate Rock to Phosphorus Trichloride Derivatives | |
  33. FIGURE 3 Porter's Five Forces Analysis | |
  34. FIGURE 4 Global Market Size Trend (USD Billion), 2021–2035 | |
  35. FIGURE 5 Market Share, By Purity/grade, 2025 | |
  36. FIGURE 6 Market Share, By Application, 2025 | |
  37. FIGURE 7 Market Share, By End-user Industry, 2025 | |
  38. FIGURE 8 Regional Market Share, 2025 | |
  39. FIGURE 9 Competitive Landscape: Estimated Revenue Share Ranges of Key Players

Segmentation Quick Reference

DimensionSub-SegmentsDominant SegmentFastest Growing Segment
By Purity/gradeTechnical/industrial grade; High-purity grade; Ultra-high purity electronic gradeTechnical/industrial grade (61.5% share)Ultra-high purity electronic grade (5.6% CAGR)
By ApplicationAgrochemicals; Pharmaceuticals; Plastic additives and stabilizers; Flame retardants; Surfactants and detergents; Metal and water treatment chemicals; Other applicationsAgrochemicals (38.5% share)Flame retardants (5.0% CAGR)
By End-user IndustryChemicals and intermediates; Agriculture; Pharmaceuticals; Plastics and polymers; Electronics and semiconductors; Other end-user industriesChemicals and intermediates (42.3% share)Electronics and semiconductors (5.3% CAGR)
By RegionNorth America; Europe; Asia-Pacific; South America; Middle East & AfricaAsia-Pacific (57.0% share)Asia-Pacific (57.0% share)

Market Segmentation Overview

By Purity/grade

Sub-SegmentKey Trend
Technical/industrial gradePrice pressure from Chinese overcapacity; demand tied to glyphosate and phosphites
High-purity gradeStable premiums from organophosphorus and pharmaceutical synthesis
Ultra-high purity electronic gradeFab qualification and sub-ppb impurity specifications drive growth

Technical/industrial grade leads with a 61.5% share because glyphosate and phosphite producers buy on cost and accept ≥ 99% purity. Ultra-high purity electronic grade grows fastest at a 5.6% CAGR, as each advanced fab must qualify suppliers that meet ≥ 99.999% purity with lot-level metal and particle data. High-purity grade sits between the two, holding stable pricing with pharmaceutical buyers.

By Application

Sub-SegmentKey Trend
AgrochemicalsMature glyphosate demand; margin pressure from export rebate changes
PharmaceuticalsAPI chlorination and bisphosphonate synthesis in India and Europe
Plastic additives and stabilizersHigher phosphite loadings in recycled polymers
Flame retardantsHalogen-free mandates in EVs, electronics and building panels
Surfactants and detergentsPhosphonate builders in industrial cleaning
Metal and water treatment chemicalsScale and corrosion inhibitors for cooling water
Other applicationsDyes, catalysts and reagents

Agrochemicals lead with a 38.5% share, built on herbicide and insecticide synthesis, though bio-based alternatives cap new capacity. Flame retardants grow fastest at a 5.0% CAGR because RoHS limits and the Stockholm listing of Dechlorane Plus push formulators toward organophosphate chemistry. Plastic additives and stabilizers add steady volume as recycled-content rules raise phosphite use.

By End-user Industry

Sub-SegmentKey Trend
Chemicals and intermediatesGrowth in line with industrial output in China and India
AgricultureCrop protection demand in Asia-Pacific and Brazil
PharmaceuticalsGeneric API expansion and pharmacopeial purity limits
Plastics and polymersStabilizer and flame-retardant consumption
Electronics and semiconductorsLong-term offtake contracts with new fabs
Other end-user industriesTextiles, research and water treatment

Chemicals and intermediates lead with a 42.3% share, reflecting mature derivative chains that grow with general industrial activity. Electronics and semiconductors grow fastest at a 5.3% CAGR, since strict supplier audits raise switching costs and support multi-year contracts. Agriculture remains the second-largest buyer, tied to herbicide demand in Asia and South America.


Download PDF ×

We do not share your information with anyone. However, we may send you emails based on your report interest from time to time. You may contact us at any time to opt-out.