BFSI Market Segmentation
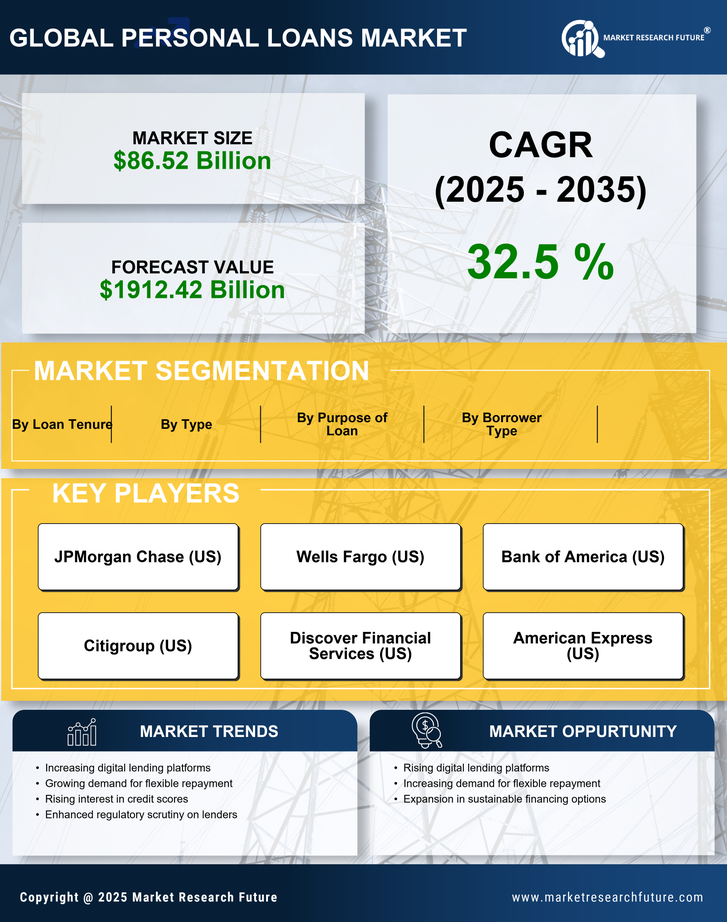
BFSI By Type (USD Billion, 2025-2035)
- Secured Loans
- Unsecured Loans
- Debt Consolidation Loans
- Personal Lines of Credit
BFSI By Borrower Type (USD Billion, 2025-2035)
- Individual Borrowers
- Joint Borrowers
- Borrowers with Bad Credit
- First-Time Borrowers
BFSI By Purpose of Loan (USD Billion, 2025-2035)
- Home Improvement
- Medical Expenses
- Education Expenses
- Travel and Vacation
BFSI By Loan Tenure (USD Billion, 2025-2035)
- Short-Term Loans
- Medium-Term Loans
- Long-Term Loans