

Healthcare Market Segmentation
Healthcare By Type (USD Billion, 2025-2035)
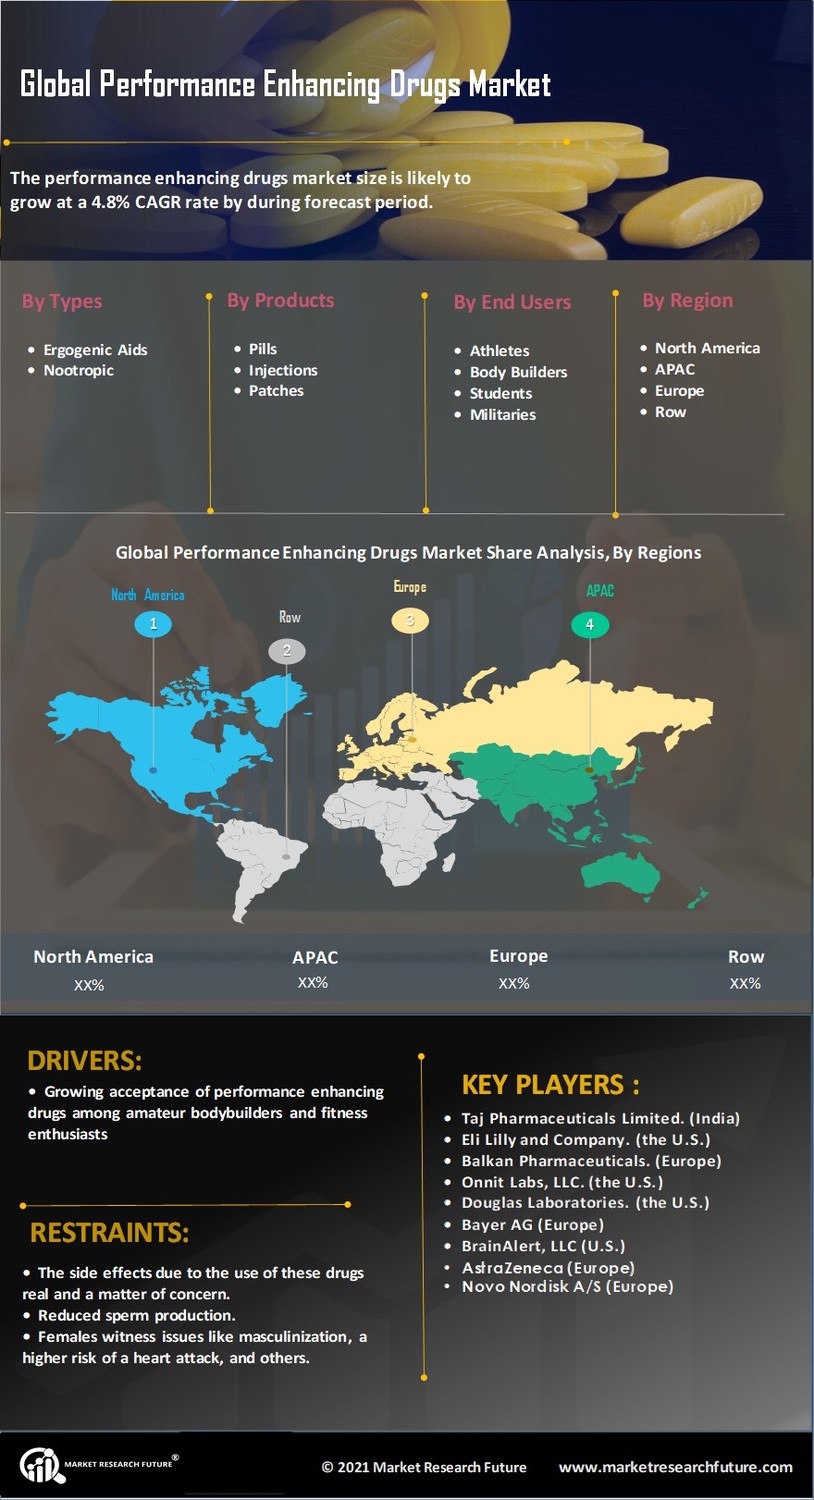
- ergogenic acids
- nootropics
Healthcare By Product (USD Billion, 2025-2035)
- pills
- patches
- injections
Healthcare By End-users (USD Billion, 2025-2035)
- athletes
- bodybuilders
- militaries
- students


