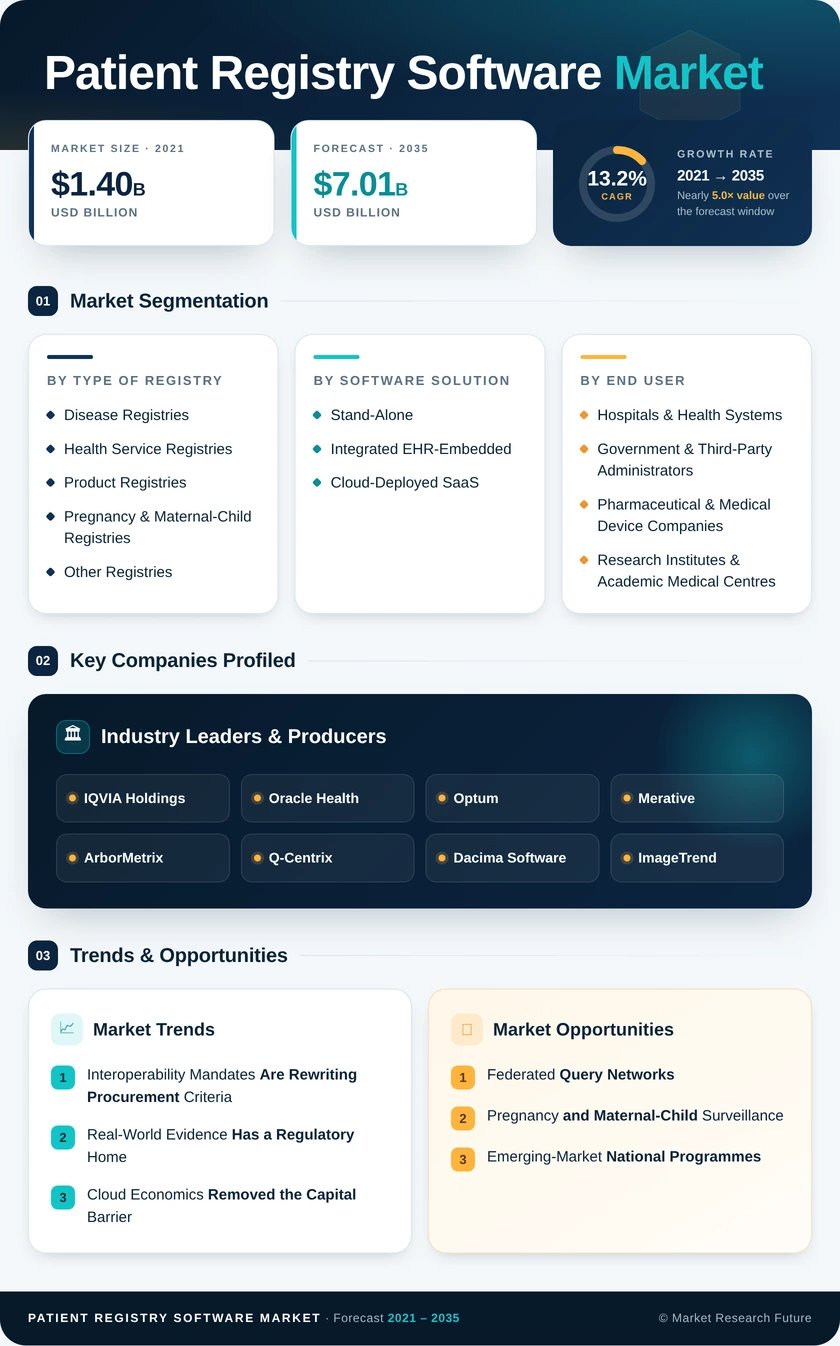
Patient Registry Software Market (2026 - 2035)

ID: MRFR/HC/5452-CR 200 Pages Rahul Gotadki Last Updated: October 27, 2026
Patient Registry Software Market Research Report By Solution Type (Standalone Software, Integrated Software, Cloud-Based Software, Web-Based Software), By Application (Chronic Disease Registries, Rare Disease Registries, Patient-Reported Outcomes Registries, Clinical Trial Registries), By Deployment Type (On-Premise, Cloud), By End User (Hospitals, Research Organizations, Healthcare Providers, Government Agencies) and By Regional (North America, Europe, South America, Asia Pacific, Middle East and Africa) - Growth & Industry Forecast 2025 To 2035
Patient Registry Software Market
Market Size
Forecast Period2026-2035
CAGR (2026-2035)13.20%
2025 Market SizeUSD 2.06 Billion
2035 Market SizeUSD 7.01 Billion
Key Players
IQVIA Holdings
Oracle Health
Optum
Merative
ArborMetrix
Q-Centrix
Opportunities
  • Federated Query Networks
  • Pregnancy and Maternal-Child Surveillance
  • Emerging-Market National Programmes
  1. 1 Market Overview |
    1. 1.1 Study Assumptions & Market Definition |
    2. 1.2 Scope of the Study |
    3. 1.3 Research Methodology
  2. 2 Market Summary & Key Takeaways |
    1. 2.1 Key Takeaways by Software Solution |
    2. 2.2 Key Takeaways by End User |
    3. 2.3 Key Takeaways by Geography
  3. 3 Global Market Size & Forecast (2021–2035) |
    1. 3.1 Historical Market Size (2021–2025) |
    2. 3.2 Current & Forecast Market Size (2026–2035) |
    3. 3.3 Market Size by Revenue (USD Billion) |
    4. 3.4 Year-over-Year Growth Analysis
  4. 4 Market Dynamics — Drivers |
    1. 4.1 Interoperability and FHIR Mandates |
    2. 4.2 Regulatory Demand for Real-World Evidence |
    3. 4.3 Cloud and SaaS Cost Economics |
    4. 4.4 AI-Assisted Data Abstraction |
    5. 4.5 Value-Based Care Quality Reporting
  5. 5 Market Dynamics — Restraints |
    1. 5.1 Fragmented Data Privacy Regimes |
    2. 5.2 Clinician Documentation Burden |
    3. 5.3 Legacy EHR Migration Complexity |
    4. 5.4 Funding Uncertainty and Data Quality Gaps
  6. 6 Market Opportunity Analysis |
    1. 6.1 Federated Query Networks |
    2. 6.2 Pregnancy and Maternal-Child Surveillance |
    3. 6.3 Emerging-Market National Programmes |
    4. 6.4 Data Monetization and Evidence-as-a-Service |
    5. 6.5 Payer-Provider Convergence |
    6. 6.6 Industry Value Chain Analysis |
    7. 6.7 Porter's Five Forces Analysis
  7. 7 Regional Analysis |
    1. 7.1 North America | |
      1. 7.1.1 US | |
      2. 7.1.2 Canada | |
      3. 7.1.3 Mexico |
    2. 7.2 Europe | |
      1. 7.2.1 Germany | |
      2. 7.2.2 UK | |
      3. 7.2.3 France | |
      4. 7.2.4 Italy | |
      5. 7.2.5 Spain | |
      6. 7.2.6 Nordic Countries | |
      7. 7.2.7 Russia | |
      8. 7.2.8 Rest of Europe |
    3. 7.3 Asia-Pacific | |
      1. 7.3.1 China | |
      2. 7.3.2 India | |
      3. 7.3.3 Japan | |
      4. 7.3.4 South Korea | |
      5. 7.3.5 ASEAN | |
      6. 7.3.6 Rest of Asia-Pacific |
    4. 7.4 South America | |
      1. 7.4.1 Brazil | |
      2. 7.4.2 Argentina | |
      3. 7.4.3 Rest of South America |
    5. 7.5 Middle East & Africa | |
      1. 7.5.1 Saudi Arabia | |
      2. 7.5.2 UAE | |
      3. 7.5.3 South Africa | |
      4. 7.5.4 Egypt | |
      5. 7.5.5 Rest of Middle East & Africa
  8. 8 Future Outlook (2026–2035) |
    1. 8.1 Autonomous Curation |
    2. 8.2 Platform Economics and Consolidation |
    3. 8.3 Evidence Markets |
    4. 8.4 Data Sovereignty and Architecture
  9. 9 Segmentation Analysis |
    1. 9.1 By Type of Registry | |
      1. 9.1.1 Disease Registries | |
      2. 9.1.2 Health Service Registries | |
      3. 9.1.3 Product Registries | |
      4. 9.1.4 Pregnancy & Maternal-Child Registries | |
      5. 9.1.5 Other Registries |
    2. 9.2 By Software Solution | |
      1. 9.2.1 Stand-Alone | |
      2. 9.2.2 Integrated EHR-Embedded | |
      3. 9.2.3 Cloud-Deployed SaaS | |
      4. 9.2.4 On- Premise Installed Systems |
    3. 9.3 By End User | |
      1. 9.3.1 Hospitals & Health Systems | |
      2. 9.3.2 Government Agencies & Third-Party Administrators | |
      3. 9.3.3 Pharmaceutical, Biotechnology & Medical Device Companies | |
      4. 9.3.4 Research Institutes & Academic Medical Centres | |
      5. 9.3.5 Other End Users
  10. 10 Competitive Landscape |
    1. 10.1 Market Concentration Analysis (2026) |
    2. 10.2 Competitive Benchmarking Matrix |
    3. 10.3 Company Profiles | |
      1. 10.3.1 IQVIA Holdings | |
      2. 10.3.2 Oracle Health | |
      3. 10.3.3 Optum | |
      4. 10.3.4 Merative | |
      5. 10.3.5 ArborMetrix | |
      6. 10.3.6 Q-Centrix | |
      7. 10.3.7 Dacima Software | |
      8. 10.3.8 ImageTrend | |
      9. 10.3.9 Medstreaming–M2S | |
      10. 10.3.10 OpenText | |
      11. 10.3.11 Veradigm | |
      12. 10.3.12 Premier Inc.
  11. 11 Recent Developments & News
  12. 12 Report Scope & Methodology |
    1. 12.1 Study Period & Base Year |
    2. 12.2 Data Sources & Citations |
    3. 12.3 Abbreviations
  13. 13 Detailed Sources and Citations
  14. 14 Frequently Asked Questions
  15. 15 LIST OF TABLES |
  16. TABLE 1 Global Patient Registry Software Market Size & Forecast, by Revenue (USD Billion), 2021–2035 |
  17. TABLE 2 Global Market — Year-over-Year Growth Analysis, 2021–2035 |
  18. TABLE 3 Driver Impact Analysis Matrix, 2026–2035 |
  19. TABLE 4 Restraint Impact Analysis Matrix, 2026–2035 |
  20. TABLE 5 Global Market Size, by Region, 2021–2035 (USD Billion) |
  21. TABLE 6 North America Market Size, by Country, 2021–2035 (USD Billion) |
  22. TABLE 7 Europe Market Size, by Country, 2021–2035 (USD Billion) |
  23. TABLE 8 Asia-Pacific Market Size, by Country, 2021–2035 (USD Billion) |
  24. TABLE 9 South America Market Size, by Country, 2021–2035 (USD Billion) |
  25. TABLE 10 Middle East & Africa Market Size, by Country, 2021–2035 (USD Billion) |
  26. TABLE 11 Global Market Size, by Type of Registry, 2021–2035 (USD Billion) |
  27. TABLE 12 Global Market Size, by Software Solution, 2021–2035 (USD Billion) |
  28. TABLE 13 Global Market Size, by End User, 2021–2035 (USD Billion) |
  29. TABLE 14 North America Market Size, by Type of Registry, 2021–2035 (USD Billion) |
  30. TABLE 15 North America Market Size, by Software Solution, 2021–2035 (USD Billion) |
  31. TABLE 16 North America Market Size, by End User, 2021–2035 (USD Billion) |
  32. TABLE 17 Europe Market Size, by Type of Registry, 2021–2035 (USD Billion) |
  33. TABLE 18 Europe Market Size, by Software Solution, 2021–2035 (USD Billion) |
  34. TABLE 19 Europe Market Size, by End User, 2021–2035 (USD Billion) |
  35. TABLE 20 Asia-Pacific Market Size, by Type of Registry, 2021–2035 (USD Billion) |
  36. TABLE 21 Asia-Pacific Market Size, by Software Solution, 2021–2035 (USD Billion) |
  37. TABLE 22 Asia-Pacific Market Size, by End User, 2021–2035 (USD Billion) |
  38. TABLE 23 South America Market Size, by Type of Registry, 2021–2035 (USD Billion) |
  39. TABLE 24 South America Market Size, by Software Solution, 2021–2035 (USD Billion) |
  40. TABLE 25 South America Market Size, by End User, 2021–2035 (USD Billion) |
  41. TABLE 26 Middle East & Africa Market Size, by Type of Registry, 2021–2035 (USD Billion) |
  42. TABLE 27 Middle East & Africa Market Size, by Software Solution, 2021–2035 (USD Billion) |
  43. TABLE 28 Middle East & Africa Market Size, by End User, 2021–2035 (USD Billion) |
  44. TABLE 29 Competitive Benchmarking Matrix, 2026 |
  45. TABLE 30 Company Profiles — Key Players |
  46. TABLE 31 Recent Developments & Strategic Announcements, 2023–2025 |
  47. TABLE 32 Report Scope & Methodology Summary |
  48. TABLE 33 Detailed Sources and Citations Index
  49. 16 LIST OF FIGURES |
  50. FIGURE 1 Market Dynamics — Drivers, Restraints, and Opportunities Snapshot |
  51. FIGURE 2 Industry Value Chain Analysis |
  52. FIGURE 3 Porter's Five Forces Analysis |
  53. FIGURE 4 Global Market Size Trend, 2021–2035 (USD Billion) |
  54. FIGURE 5 Year-over-Year Growth Curve, 2022–2035 |
  55. FIGURE 6 Market Share by Type of Registry, 2025 vs 2035 |
  56. FIGURE 7 Market Share by Software Solution, 2025 vs 2035 |
  57. FIGURE 8 Market Share by End User, 2025 vs 2035 |
  58. FIGURE 9 Regional Revenue Share, 2025 |
  59. FIGURE 10 Regional CAGR Comparison, 2026–2035 |
  60. FIGURE 11 North America Country-Level Share, 2025 |
  61. FIGURE 12 Europe Country-Level Share, 2025 |
  62. FIGURE 13 Asia-Pacific Country-Level Share, 2025 |
  63. FIGURE 14 Competitive Landscape — Estimated Vendor Share Bands, 2026 |
  64. FIGURE 15 Vendor Positioning Quadrant — Capability vs Global Reach

Segmentation Quick Reference

DimensionSub-SegmentsDominant SegmentFastest Growing Segment
By Type of RegistryDisease Registries; Health Service Registries; Product Registries; Pregnancy & Maternal-Child Registries; Other RegistriesDisease RegistriesPregnancy & Maternal-Child Registries
By Software SolutionStand-Alone; Integrated EHR-Embedded; Cloud-Deployed SaaSCloud-Deployed SaaSCloud-Deployed SaaS
By End UserHospitals & Health Systems; Government & Third-Party Administrators; Pharmaceutical & Medical Device Companies; Research Institutes & Academic Medical CentresHospitals & Health SystemsResearch Institutes & Academic Medical Centres
By GeographyNorth America; Europe; Asia-Pacific; South America; Middle East & AfricaNorth AmericaAsia-Pacific


Market Segmentation Overview

By Type of Registry

Sub-SegmentKey Trend
Disease RegistriesConsolidation of specialty society registries onto shared cloud platforms
Health Service RegistriesTighter coupling with accreditation and quality attestation workflows
Product RegistriesUnique device identifier linkage becoming a submission prerequisite
Pregnancy & Maternal-Child RegistriesRegulator-backed surveillance pilots lowering cost of entry.
Other RegistriesRare disease and genomics cohorts driving federated design


Clinical purpose still determines architecture. Disease registries need longitudinal depth and benchmarking, while product registries prioritize traceability and audit readiness — which is why vendors rarely win both categories with a single configuration.

By Software Solution

Sub-SegmentKey Trend
Stand-AloneRetained where specialty societies require vendor neutrality
Integrated EHR-EmbeddedGrowing where documentation burden is the binding constraint
Cloud-Deployed SaaSDefault choice; vendor-managed FHIR and upgrade compliance


Delivery model now carries more weight in tender scoring than feature checklists. Cloud subscriptions shift certification maintenance to the vendor, and that transfer of regulatory risk is what closes deals with mid-sized health systems.

By End User

Sub-SegmentKey Trend
Hospitals & Health SystemsConsolidating multiple registries under single enterprise contracts
Government & Third-Party AdministratorsSovereign hosting requirements shaping vendor eligibility
Pharmaceutical & Medical Device CompaniesShifting post-market obligations from trials to registries
Research Institutes & Academic Medical CentresGrant conditions mandating durable, shareable cohort infrastructure


Buyer type predicts procurement cycle length more reliably than budget size. Academic and government purchases run on grant and fiscal calendars, whereas manufacturers buy against regulatory submission deadlines that rarely move.

By Region

Sub-SegmentKey Trend
North AmericaCompliance-driven recurring spend anchored by CMS reporting
EuropeEHDS transposition creating a decade of federated infrastructure demand
Asia-PacificNational digital health missions funding registry layers at scale
South AmericaPublic health system modernization constrained by currency volatility.
Middle East & AfricaSovereign cloud mandates favouring locally hosted deployments


Regulatory maturity, not healthcare expenditure, explains regional ranking. Markets with enforceable reporting obligations convert interest into contracts; markets without them stall at pilot stage regardless of clinical need.




Download PDF ×

We do not share your information with anyone. However, we may send you emails based on your report interest from time to time. You may contact us at any time to opt-out.