Ozone Generation Market (2026 - 2035)

ID: MRFR/EnP/9396-HCR 100 Pages Priya Nagrale Last Updated: October 23, 2026
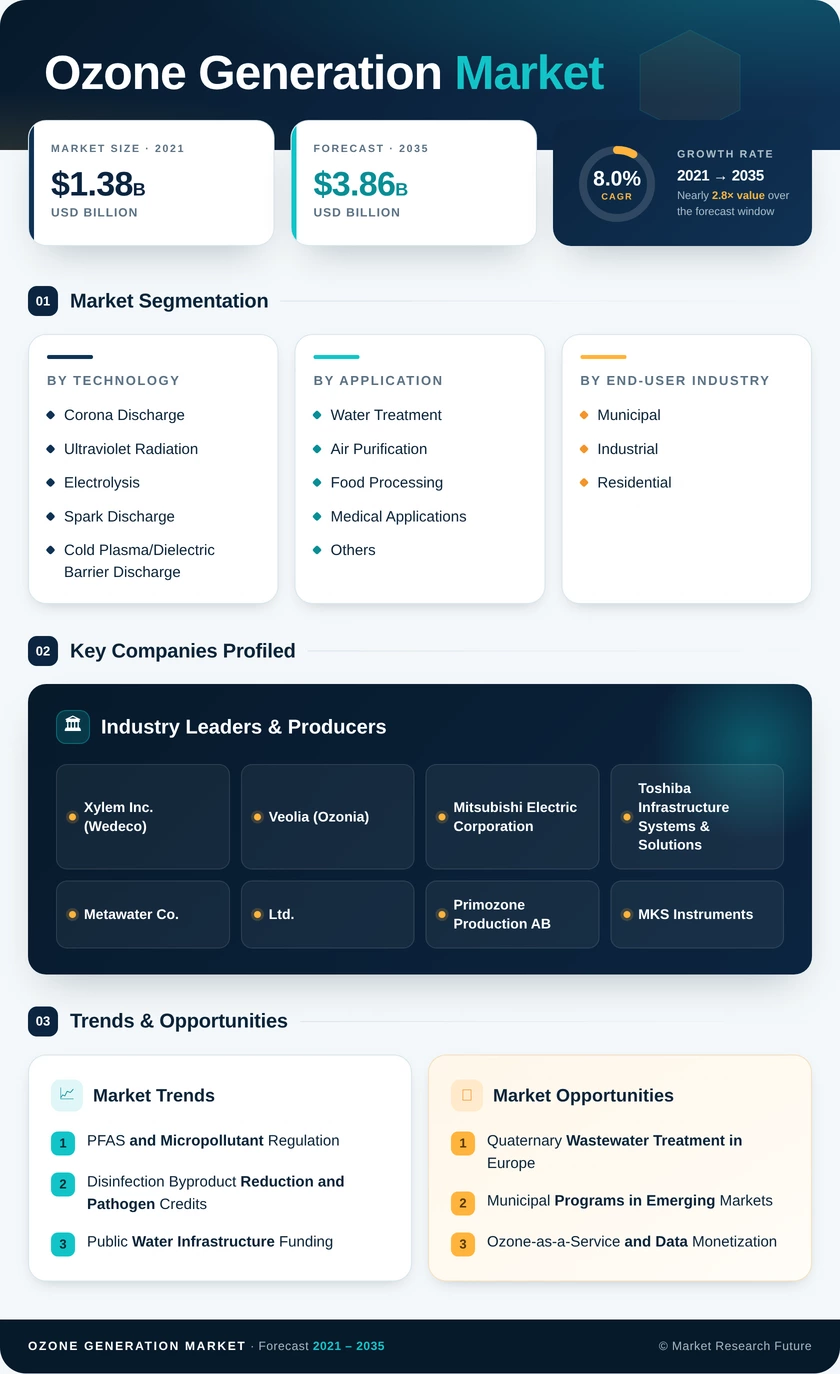
Ozone Generation Market Research Report By Technology (Corona Discharge, Ultraviolet Radiation, Electrolysis, Spark Discharge, Cold Plasma/Dielectric Barrier Discharge, Others), By Application (Water Treatment, Air Purification, Food Processing, Medical Applications, Others), By End-User Industry (Municipal, Industrial, Residential) - Forecast to 2035
Ozone Generation Market
Market Size
Forecast Period2026-2035
CAGR (2026-2035)8.0%
2025 Market SizeUSD 1.79 Billion
2035 Market SizeUSD 3.86 Billion
Key Players
Xylem Inc.
Veolia
Mitsubishi Electric Corporation
Toshiba Infrastructure Systems & Solutions
Metawater Co., Ltd.
Primozone Production AB
Opportunities
  • Quaternary Wastewater Treatment in Europe
  • Municipal Programs in Emerging Markets
  • Ozone-as-a-Service and Data Monetization
  1. 1 Market Summary | |
  2. 2 Key Report Takeaways | |
    1. 2.1 By Technology | |
    2. 2.2 By Application | |
    3. 2.3 By End-User Industry | |
    4. 2.4 By Region | |
  3. 3 Market Size and Forecast (2021–2035) | |
    1. 3.1 Historical Market Size (2021–2025) | |
    2. 3.2 Forecast Market Size (2026–2035) | |
  4. 4 Driver Impact Analysis | |
    1. 4.1 PFAS and Micropollutant Regulation | |
    2. 4.2 Disinfection Byproduct Reduction and Pathogen Credits | |
    3. 4.3 Public Water Infrastructure Funding | |
    4. 4.4 Chemical-Free Food Sanitation | |
    5. 4.5 Industrial Water Reuse | |
    6. 4.6 Generator Efficiency Gains | |
    7. 4.7 Aquaculture and Recreational Water Disinfection | |
  5. 5 Restraints Impact Analysis | |
    1. 5.1 High Capital Cost and Energy Intensity | |
    2. 5.2 Occupational and Consumer Exposure Limits | |
    3. 5.3 Competition from UV and Chlorine Dioxide | |
    4. 5.4 Bromate Formation Risk | |
    5. 5.5 Electrode Lifespan and Skilled O&M Shortage | |
  6. 6 Opportunities | |
    1. 6.1 Quaternary Wastewater Treatment in Europe | |
    2. 6.2 Municipal Programs in Emerging Markets | |
    3. 6.3 Ozone-as-a-Service and Data Monetization | |
    4. 6.4 Semiconductor Ultrapure Water | |
    5. 6.5 Cold Chain and Produce Storage | |
  7. 7 Regional Market Share and Country-Level Analysis | |
    1. 7.1 North America | | |
      1. 7.1.1 US | | |
      2. 7.1.2 Canada | | |
      3. 7.1.3 Mexico | |
    2. 7.2 Europe | | |
      1. 7.2.1 Germany | | |
      2. 7.2.2 UK | | |
      3. 7.2.3 France | | |
      4. 7.2.4 Italy | | |
      5. 7.2.5 Spain | | |
      6. 7.2.6 Nordic Countries | | |
      7. 7.2.7 Russia | | |
      8. 7.2.8 Rest of Europe | |
    3. 7.3 Asia-Pacific | | |
      1. 7.3.1 China | | |
      2. 7.3.2 India | | |
      3. 7.3.3 Japan | | |
      4. 7.3.4 South Korea | | |
      5. 7.3.5 ASEAN | | |
      6. 7.3.6 Rest of Asia-Pacific | |
    4. 7.4 South America | | |
      1. 7.4.1 Brazil | | |
      2. 7.4.2 Argentina | | |
      3. 7.4.3 Rest of South America | |
    5. 7.5 Middle East & Africa | | |
      1. 7.5.1 Saudi Arabia | | |
      2. 7.5.2 UAE | | |
      3. 7.5.3 South Africa | | |
      4. 7.5.4 Egypt | | |
      5. 7.5.5 Rest of MEA | |
  8. 8 Future Outlook (2026–2035) | |
    1. 8.1 Digital Dose Control and Autonomous Operation | |
    2. 8.2 Energy Efficiency and Electrification | |
    3. 8.3 Circular Water and Reuse | |
    4. 8.4 ESG Reporting and Chemical Reduction | |
  9. 9 Segmentation Analysis | |
    1. 9.1 By Technology | | |
      1. 9.1.1 Corona Discharge | | |
      2. 9.1.2 Ultraviolet Radiation | | |
      3. 9.1.3 Electrolysis | | |
      4. 9.1.4 Spark Discharge | | |
      5. 9.1.5 Cold Plasma/Dielectric Barrier Discharge | | |
      6. 9.1.6 Others | |
    2. 9.2 By Application | | |
      1. 9.2.1 Water Treatment | | |
      2. 9.2.2 Air Purification | | |
      3. 9.2.3 Food Processing | | |
      4. 9.2.4 Medical Applications | | |
      5. 9.2.5 Others | |
    3. 9.3 By End-User Industry | | |
      1. 9.3.1 Municipal | | |
      2. 9.3.2 Industrial | | |
      3. 9.3.3 Residential | |
  10. 10 Competitive Landscape | |
    1. 10.1 Market Concentration Analysis | |
    2. 10.2 Competitive Benchmarking Table | |
  11. 11 Recent News & Developments | |
  12. 12 Report Scope and Methodology | |
  13. 13 Detailed Sources and Citations | |
  14. 14 Frequently Asked Questions (FAQs) | | LIST OF TABLES | |
  15. TABLE 1 Global Ozone Generation Market Snapshot, 2025–2035 | |
  16. TABLE 2 Global Ozone Generation Market Size & Forecast, by Revenue (USD Billion), 2021–2035 | |
  17. TABLE 3 Driver Impact Analysis, 2026–2035 | |
  18. TABLE 4 Restraints Impact Analysis, 2026–2035 | |
  19. TABLE 5 Global Ozone Generation Market, by Region, 2025 | |
  20. TABLE 6 North America Ozone Generation Market, by Country, 2025 | |
  21. TABLE 7 Europe Ozone Generation Market, by Country, 2025 | |
  22. TABLE 8 Asia-Pacific Ozone Generation Market, by Country, 2025 | |
  23. TABLE 9 South America Ozone Generation Market, by Country, 2025 | |
  24. TABLE 10 Middle East & Africa Ozone Generation Market, by Country, 2025 | |
  25. TABLE 11 Global Ozone Generation Market, by Technology, 2025 | |
  26. TABLE 12 Global Ozone Generation Market, by Application, 2025 | |
  27. TABLE 13 Global Ozone Generation Market, by End-User Industry, 2025 | |
  28. TABLE 14 Competitive Benchmarking Table – Global Ozone Generation Market, 2025 | |
  29. TABLE 15 Report Scope and Methodology | |
  30. TABLE 16 Detailed Sources and Citations | | LIST OF FIGURES | |
  31. FIGURE 1 Market Dynamics – Drivers, Restraints and Opportunities | |
  32. FIGURE 2 Ozone Generation Industry Value Chain Analysis | |
  33. FIGURE 3 Porter's Five Forces Analysis | |
  34. FIGURE 4 Global Ozone Generation Market Size Trend (USD Billion), 2021–2035 | |
  35. FIGURE 5 Market Share by Technology, 2025 | |
  36. FIGURE 6 Market Share by Application, 2025 | |
  37. FIGURE 7 Market Share by End-User Industry, 2025 | |
  38. FIGURE 8 Regional Market Share, 2025 | |
  39. FIGURE 9 Country-Level Share Within Each Region, 2025 | |
  40. FIGURE 10 Competitive Landscape – Estimated Revenue Share Ranges of Key Players, 2025

Segmentation Quick Reference

DimensionSub-SegmentsDominant SegmentFastest Growing Segment
By TechnologyCorona Discharge, Ultraviolet Radiation, Electrolysis, Spark Discharge, Cold Plasma/Dielectric Barrier Discharge, OthersCorona Discharge (54.3% share)Electrolysis (10.2% CAGR)
By ApplicationWater Treatment, Air Purification, Food Processing, Medical Applications, OthersWater Treatment (59.4% share)Food Processing (9.5% CAGR)
By End-User IndustryMunicipal, Industrial, ResidentialMunicipal (48.9% share)Residential (8.8% CAGR)
By RegionNorth America, Europe, Asia-Pacific, South America, Middle East & AfricaNorth America (34.0% share)Asia-Pacific (9.4% CAGR)

Market Segmentation Overview

By Technology

Sub-SegmentKey Trend
Corona DischargeResonant inverters and oxygen feed raise output per kWh
Ultraviolet RadiationSteady use in low-output air and laboratory equipment
ElectrolysisPEM cells with diamond anodes enable point-of-use generation
Spark DischargeConfined to low-cost consumer appliances
Cold Plasma/Dielectric Barrier DischargeExpanding in medical sterilization and surface treatment
OthersSpecialty research and niche industrial designs

Corona Discharge leads with a 54.3% share because it remains the only technology that economically delivers high-concentration ozone at municipal scale. Electrolysis grows fastest at a 10.2% CAGR, as membrane-electrode cells produce dissolved ozone directly in water without feed gas preparation, suiting food service, healthcare, and fab rinse lines. Cold Plasma/Dielectric Barrier Discharge follows, gaining traction where precise, low-temperature sterilization is required.

By Application

Sub-SegmentKey Trend
Water TreatmentAdvanced oxidation for micropollutants and PFAS treatment trains
Air PurificationIndustrial odor control amid consumer emission limits
Food ProcessingOzonated water replaces chemical sanitizers
Medical ApplicationsDevice sterilization and dental disinfection
OthersLaundry, pools, and aquaculture

Water Treatment holds a 59.4% share, sustained by pathogen-inactivation credits and micropollutant mandates that make ozone a compliance tool for utilities. Food Processing is the fastest-growing application at a 9.5% CAGR, as FDA and USDA approvals let processors cut chlorine and peracetic acid use while extending produce shelf life. Air Purification stays relevant in industrial exhaust treatment but faces emission caps in consumer devices.

By End-User Industry

Sub-SegmentKey Trend
MunicipalRetrofits driven by byproduct rules and public funding
IndustrialReuse mandates and semiconductor ultrapure water
ResidentialCountertop electrolytic units reach mass retail

Municipal buyers dominate with a 48.9% share, relying on regulated capital plans and State Revolving Fund financing to replace chlorine primary disinfection. Residential is the fastest-growing end user at an 8.8% CAGR, as low-cost electrolytic units for produce washing and water disinfection enter big-box retail with sensors that hold ozone at safe levels. Industrial demand sits between the two, rewarding suppliers with high-purity, tightly controlled systems.


Download PDF ×

We do not share your information with anyone. However, we may send you emails based on your report interest from time to time. You may contact us at any time to opt-out.