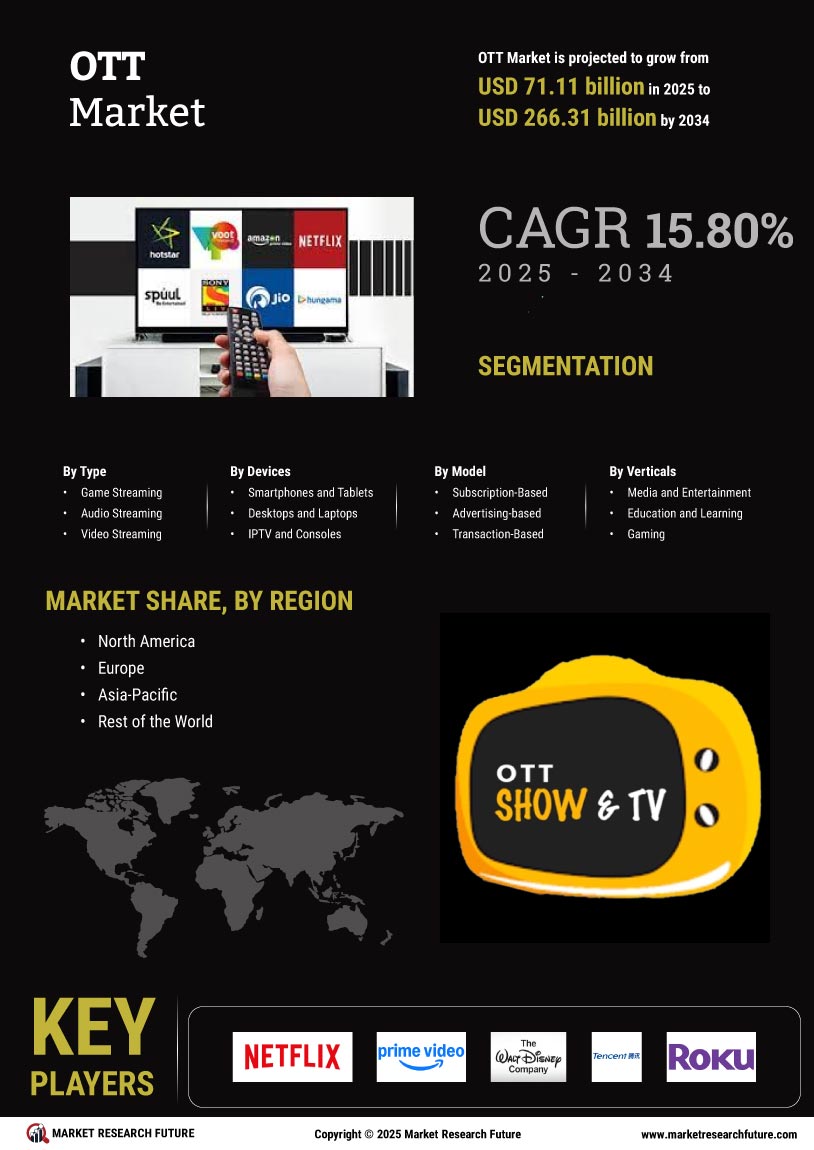
ID: MRFR/ICT/10003-HCR | 128 Pages | Author: Ankit Gupta | March 2024
TABLE OF CONTENTS
1. EXECUTIVE SUMMARY
2. MARKET INTRODUCTION
2.1. Definition
2.2. Scope of the Study
2.2.1. Research Objective
2.2.2. Assumptions
2.2.3. Limitations
3. RESEARCH METHODOLOGY
3.1. Overview
3.2. Data Mining
3.3. Secondary Research
3.4. Primary Research
3.4.1. Primary Interviews and Information Gathering Process
3.4.2. Breakdown of Primary Respondents
3.5. Forecasting Modality
3.6. Market Size Estimation
3.6.1. Bottom-Up Approach
3.6.2. Top-Down Approach
3.7. Data Triangulation
3.8. Validation
4. MARKET DYNAMICS
4.1. Overview
4.2. Drivers
4.3. Restraints
4.4. Opportunities
5. MARKET FACTOR ANALYSIS
5.1. Value Chain Analysis
5.2. Porter’s Five Forces Analysis
5.2.1. Bargaining Power of Suppliers
5.2.2. Bargaining Power of Buyers
5.2.3. Threat of New Entrants
5.2.4. Threat of Substitutes
5.2.5. Intensity of Rivalry
5.3. COVID-19 Impact Analysis
5.3.1. Market Impact Analysis
5.3.2. Regional Impact
5.3.3. Opportunity and Threat Analysis
6. GLOBAL OTT MARKET, BY TYPE
6.1. Overview
6.2. Game Streaming
6.3. Audio Streaming
6.4. Video Streaming
6.5. Communication
7. GLOBAL OTT MARKET, BY STREAMING DEVICES
7.1. Overview
7.2. Smartphones and Tablets
7.3. Desktops and Laptops
7.4. IPTV and Consoles
8. GLOBAL OTT MARKET, BY MONETIZATION MODEL
8.1. Overview
8.2. Subscritption-Based
8.3. Advertising-based
8.4. Transaction-Based
9. GLOBAL OTT MARKET, BY SERVICE VERTICALS
9.1. Overview
9.2. Media and Entertainment
9.3. Education and Learning
9.4. Gaming
9.5. Service Utilities
10. GLOBAL OTT MARKET, BY REGION
10.1. Overview
10.1. North America
10.1.1. US
10.1.2. Canada
10.2. Europe
10.2.1. Germany
10.2.2. France
10.2.3. UK
10.2.4. Italy
10.2.5. Spain
10.2.6. Rest of Europe
10.3. Asia-Pacific
10.3.1. China
10.3.2. India
10.3.3. Japan
10.3.4. South Korea
10.3.5. Australia
10.3.6. Rest of Asia-Pacific
10.4. Rest of the World
10.4.1. Middle East
10.4.2. Africa
10.4.3. Latin America
11. COMPETITIVE LANDSCAPE
11.1. Overview
11.2. Competitive Analysis
11.3. Market Share Analysis
11.4. Major Growth Strategy in the Global OTT Market,
11.5. Competitive Benchmarking
11.6. Leading Players in Terms of Number of Developments in the Global OTT Market,
11.7. Key developments and Growth Strategies
11.7.1. New Product Launch/Service Deployment
11.7.2. Merger & Acquisitions
11.7.3. Joint Ventures
11.8. Major Players Financial Matrix
11.8.1. Sales & Operating Income, 2022
11.8.2. Major Players R&D Expenditure. 2022
12. COMPANY PROFILES
12.1. Netflix, Inc.
12.1.1. Company Overview
12.1.2. Financial Overview
12.1.3. Products Offered
12.1.4. Key Developments
12.1.5. SWOT Analysis
12.1.6. Key Strategies
12.2. Amazon.com Inc. (Prime Video)
12.2.1. Company Overview
12.2.2. Financial Overview
12.2.3. Products Offered
12.2.4. Key Developments
12.2.5. SWOT Analysis
12.2.6. Key Strategies
12.3. The Walt Disney Company (Hulu)
12.3.1. Company Overview
12.3.2. Financial Overview
12.3.3. Products Offered
12.3.4. Key Developments
12.3.5. SWOT Analysis
12.3.6. Key Strategies
12.4. Tencent Holdings Ltd
12.4.1. Company Overview
12.4.2. Financial Overview
12.4.3. Products Offered
12.4.4. Key Developments
12.4.5. SWOT Analysis
12.4.6. Key Strategies
12.5. Roku Inc.
12.5.1. Company Overview
12.5.2. Financial Overview
12.5.3. Products Offered
12.5.4. Key Developments
12.5.5. SWOT Analysis
12.5.6. Key Strategies
12.6. Google LLC (YouTube)
12.6.1. Company Overview
12.6.2. Financial Overview
12.6.3. Products Offered
12.6.4. Key Developments
12.6.5. SWOT Analysis
12.6.6. Key Strategies
12.7. DAZN Group Limited
12.7.1. Company Overview
12.7.2. Financial Overview
12.7.3. Products Offered
12.7.4. Key Developments
12.7.5. SWOT Analysis
12.7.6. Key Strategies
12.8. NBC UNIVERSAL (HAYU)
12.8.1. Company Overview
12.8.2. Financial Overview
12.8.3. Products Offered
12.8.4. Key Developments
12.8.5. SWOT Analysis
12.8.6. Key Strategies
12.9. PCCW Media Group (Viu)
12.9.1. Company Overview
12.9.2. Financial Overview
12.9.3. Products Offered
12.9.4. Key Developments
12.9.5. SWOT Analysis
12.9.6. Key Strategies
13. APPENDIX
13.1. References
13.2. Related Reports
LIST OF TABLES
TABLE 1 GLOBAL OTT MARKET, SYNOPSIS, 2018–2032
TABLE 2 GLOBAL OTT MARKET, ESTIMATES & FORECAST, 2018–2032 (USD BILLION)
TABLE 3 GLOBAL OTT MARKET, BY TYPE, 2018–2032 (USD BILLION)
TABLE 4 GLOBAL OTT MARKET, BY STREAMING DEVICES, 2018–2032 (USD BILLION)
TABLE 5 GLOBAL OTT MARKET, BY MONETIZATION MODEL, 2018–2032 (USD BILLION)
TABLE 6 GLOBAL OTT MARKET, BY SERVICE VERTICALS, 2018–2032 (USD BILLION)
TABLE 7 NORTH AMERICA: OTT MARKET, BY TYPE, 2018–2032 (USD BILLION)
TABLE 8 NORTH AMERICA: OTT MARKET, BY STREAMING DEVICES, 2018–2032 (USD BILLION)
TABLE 9 NORTH AMERICA: OTT MARKET, BY MONETIZATION MODEL, 2018–2032 (USD BILLION)
TABLE 10 NORTH AMERICA: OTT MARKET, BY SERVICE VERTICALS, 2018–2032 (USD BILLION)
TABLE 11 US: OTT MARKET, BY TYPE, 2018–2032 (USD BILLION)
TABLE 12 US: OTT MARKET, BY STREAMING DEVICES, 2018–2032 (USD BILLION)
TABLE 13 US: OTT MARKET, BY MONETIZATION MODEL, 2018–2032 (USD BILLION)
TABLE 14 US: OTT MARKET, BY SERVICE VERTICALS, 2018–2032 (USD BILLION)
TABLE 15 CANADA: OTT MARKET, BY TYPE, 2018–2032 (USD BILLION)
TABLE 16 CANADA: OTT MARKET, BY STREAMING DEVICES, 2018–2032 (USD BILLION)
TABLE 17 CANADA: OTT MARKET, BY MONETIZATION MODEL, 2018–2032 (USD BILLION)
TABLE 18 CANADA: OTT MARKET, BY SERVICE VERTICALS, 2018–2032 (USD BILLION)
TABLE 1 EUROPE: OTT MARKET, BY TYPE, 2018–2032 (USD BILLION)
TABLE 2 EUROPE: OTT MARKET, BY STREAMING DEVICES, 2018–2032 (USD BILLION)
TABLE 3 EUROPE: OTT MARKET, BY MONETIZATION MODEL, 2018–2032 (USD BILLION)
TABLE 4 EUROPE: OTT MARKET, BY SERVICE VERTICALS, 2018–2032 (USD BILLION)
TABLE 5 GERMANY: OTT MARKET, BY TYPE, 2018–2032 (USD BILLION)
TABLE 6 GERMANY: OTT MARKET, BY STREAMING DEVICES, 2018–2032 (USD BILLION)
TABLE 7 GERMANY: OTT MARKET, BY MONETIZATION MODEL, 2018–2032 (USD BILLION)
TABLE 8 GERMANY: OTT MARKET, BY SERVICE VERTICALS, 2018–2032 (USD BILLION)
TABLE 9 FRANCE: OTT MARKET, BY TYPE, 2018–2032 (USD BILLION)
TABLE 10 FRANCE: OTT MARKET, BY STREAMING DEVICES, 2018–2032 (USD BILLION)
TABLE 11 FRANCE: OTT MARKET, BY MONETIZATION MODEL, 2018–2032 (USD BILLION)
TABLE 12 FRANCE: OTT MARKET, BY SERVICE VERTICALS, 2018–2032 (USD BILLION)
TABLE 13 ITALY: OTT MARKET, BY TYPE, 2018–2032 (USD BILLION)
TABLE 14 ITALY: OTT MARKET, BY STREAMING DEVICES, 2018–2032 (USD BILLION)
TABLE 15 ITALY: OTT MARKET, BY MONETIZATION MODEL, 2018–2032 (USD BILLION)
TABLE 16 ITALY: OTT MARKET, BY SERVICE VERTICALS, 2018–2032 (USD BILLION)
TABLE 17 SPAIN: OTT MARKET, BY TYPE, 2018–2032 (USD BILLION)
TABLE 18 SPAIN: OTT MARKET, BY STREAMING DEVICES, 2018–2032 (USD BILLION)
TABLE 19 SPAIN: OTT MARKET, BY MONETIZATION MODEL, 2018–2032 (USD BILLION)
TABLE 20 SPAIN: OTT MARKET, BY SERVICE VERTICALS, 2018–2032 (USD BILLION)
TABLE 21 UK: OTT MARKET, BY TYPE, 2018–2032 (USD BILLION)
TABLE 22 UK: OTT MARKET, BY STREAMING DEVICES, 2018–2032 (USD BILLION)
TABLE 23 UK: OTT MARKET, BY MONETIZATION MODEL, 2018–2032 (USD BILLION)
TABLE 24 UK: OTT MARKET, BY SERVICE VERTICALS, 2018–2032 (USD BILLION)
TABLE 25 REST OF EUROPE: OTT MARKET, BY TYPE, 2018–2032 (USD BILLION)
TABLE 26 REST OF EUROPE: OTT MARKET, BY STREAMING DEVICES, 2018–2032 (USD BILLION)
TABLE 27 REST OF EUROPE: OTT MARKET, BY MONETIZATION MODEL, 2018–2032 (USD BILLION)
TABLE 28 REST OF EUROPE: OTT MARKET, BY SERVICE VERTICALS, 2018–2032 (USD BILLION)
TABLE 29 ASIA-PACIFIC: OTT MARKET, BY TYPE, 2018–2032 (USD BILLION)
TABLE 30 ASIA-PACIFIC: OTT MARKET, BY STREAMING DEVICES, 2018–2032 (USD BILLION)
TABLE 31 ASIA-PACIFIC: OTT MARKET, BY MONETIZATION MODEL, 2018–2032 (USD BILLION)
TABLE 32 ASIA-PACIFIC: OTT MARKET, BY SERVICE VERTICALS, 2018–2032 (USD BILLION)
TABLE 33 JAPAN: OTT MARKET, BY TYPE, 2018–2032 (USD BILLION)
TABLE 34 JAPAN: OTT MARKET, BY STREAMING DEVICES, 2018–2032 (USD BILLION)
TABLE 35 JAPAN: OTT MARKET, BY MONETIZATION MODEL, 2018–2032 (USD BILLION)
TABLE 36 JAPAN: OTT MARKET, BY SERVICE VERTICALS, 2018–2032 (USD BILLION)
TABLE 37 CHINA: OTT MARKET, BY TYPE, 2018–2032 (USD BILLION)
TABLE 38 CHINA: OTT MARKET, BY STREAMING DEVICES, 2018–2032 (USD BILLION)
TABLE 39 CHINA: OTT MARKET, BY MONETIZATION MODEL, 2018–2032 (USD BILLION)
TABLE 40 CHINA: OTT MARKET, BY SERVICE VERTICALS, 2018–2032 (USD BILLION)
TABLE 41 INDIA: OTT MARKET, BY TYPE, 2018–2032 (USD BILLION)
TABLE 42 INDIA: OTT MARKET, BY STREAMING DEVICES, 2018–2032 (USD BILLION)
TABLE 43 INDIA: OTT MARKET, BY MONETIZATION MODEL, 2018–2032 (USD BILLION)
TABLE 44 INDIA: OTT MARKET, BY SERVICE VERTICALS, 2018–2032 (USD BILLION)
TABLE 45 AUSTRALIA: OTT MARKET, BY TYPE, 2018–2032 (USD BILLION)
TABLE 46 AUSTRALIA: OTT MARKET, BY STREAMING DEVICES, 2018–2032 (USD BILLION)
TABLE 47 AUSTRALIA: OTT MARKET, BY MONETIZATION MODEL, 2018–2032 (USD BILLION)
TABLE 48 AUSTRALIA: OTT MARKET, BY SERVICE VERTICALS, 2018–2032 (USD BILLION)
TABLE 49 SOUTH KOREA: OTT MARKET, BY TYPE, 2018–2032 (USD BILLION)
TABLE 50 SOUTH KOREA: OTT MARKET, BY STREAMING DEVICES, 2018–2032 (USD BILLION)
TABLE 51 SOUTH KOREA: OTT MARKET, BY MONETIZATION MODEL, 2018–2032 (USD BILLION)
TABLE 52 SOUTH KOREA: OTT MARKET, BY SERVICE VERTICALS, 2018–2032 (USD BILLION)
TABLE 53 REST OF ASIA-PACIFIC: OTT MARKET, BY TYPE, 2018–2032 (USD BILLION)
TABLE 54 REST OF ASIA-PACIFIC: OTT MARKET, BY STREAMING DEVICES, 2018–2032 (USD BILLION)
TABLE 55 REST OF ASIA-PACIFIC: OTT MARKET, BY MONETIZATION MODEL, 2018–2032 (USD BILLION)
TABLE 56 REST OF ASIA-PACIFIC: OTT MARKET, BY SERVICE VERTICALS, 2018–2032 (USD BILLION)
TABLE 57 REST OF THE WORLD: OTT MARKET, BY TYPE, 2018–2032 (USD BILLION)
TABLE 58 REST OF THE WORLD: OTT MARKET, BY STREAMING DEVICES, 2018–2032 (USD BILLION)
TABLE 59 REST OF THE WORLD: OTT MARKET, BY MONETIZATION MODEL, 2018–2032 (USD BILLION)
TABLE 60 REST OF THE WORLD: OTT MARKET, BY SERVICE VERTICALS, 2018–2032 (USD BILLION)
TABLE 61 MIDDLE EAST: OTT MARKET, BY TYPE, 2018–2032 (USD BILLION)
TABLE 62 MIDDLE EAST: OTT MARKET, BY STREAMING DEVICES, 2018–2032 (USD BILLION)
TABLE 63 MIDDLE EAST: OTT MARKET, BY MONETIZATION MODEL, 2018–2032 (USD BILLION)
TABLE 64 MIDDLE EAST: OTT MARKET, BY SERVICE VERTICALS, 2018–2032 (USD BILLION)
TABLE 65 AFRICA: OTT MARKET, BY TYPE, 2018–2032 (USD BILLION)
TABLE 66 AFRICA: OTT MARKET, BY STREAMING DEVICES, 2018–2032 (USD BILLION)
TABLE 67 AFRICA: OTT MARKET, BY MONETIZATION MODEL, 2018–2032 (USD BILLION)
TABLE 68 AFRICA: OTT MARKET, BY SERVICE VERTICALS, 2018–2032 (USD BILLION)
TABLE 69 LATIN AMERICA: OTT MARKET, BY TYPE, 2018–2032 (USD BILLION)
TABLE 70 LATIN AMERICA: OTT MARKET, BY STREAMING DEVICES, 2018–2032 (USD BILLION)
TABLE 71 LATIN AMERICA: OTT MARKET, BY MONETIZATION MODEL, 2018–2032 (USD BILLION)
TABLE 72 LATIN AMERICA: OTT MARKET, BY SERVICE VERTICALS, 2018–2032 (USD BILLION)
LIST OF FIGURES
FIGURE 1 RESEARCH PROCESS
FIGURE 2 MARKET STRUCTURE FOR THE GLOBAL OTT MARKET
FIGURE 3 MARKET DYNAMICS FOR THE GLOBAL OTT MARKET
FIGURE 4 GLOBAL OTT MARKET, SHARE (%), BY TYPE, 2022
FIGURE 5 GLOBAL OTT MARKET, SHARE (%), BY STREAMING DEVICES, 2022
FIGURE 6 GLOBAL OTT MARKET, SHARE (%), BY MONETIZATION MODEL, 2022
FIGURE 7 GLOBAL OTT MARKET, SHARE (%), BY SERVICE VERTICALS, 2022
FIGURE 8 GLOBAL OTT MARKET, SHARE (%), BY REGION, 2022
FIGURE 9 NORTH AMERICA: OTT MARKET, SHARE (%), BY REGION, 2022
FIGURE 10 EUROPE: OTT MARKET, SHARE (%), BY REGION, 2022
FIGURE 11 ASIA-PACIFIC: OTT MARKET, SHARE (%), BY REGION, 2022
FIGURE 12 REST OF THE WORLD: OTT MARKET, SHARE (%), BY REGION, 2022
FIGURE 13 GLOBAL OTT MARKET: COMPANY SHARE ANALYSIS, 2022 (%)
FIGURE 14 NETFLIX, INC.: FINANCIAL OVERVIEW SNAPSHOT
FIGURE 15 NETFLIX, INC.: SWOT ANALYSIS
FIGURE 16 AMAZON.COM INC. (PRIME VIDEO): FINANCIAL OVERVIEW SNAPSHOT
FIGURE 17 AMAZON.COM INC. (PRIME VIDEO): SWOT ANALYSIS
FIGURE 18 THE WALT DISNEY COMPANY (HULU): FINANCIAL OVERVIEW SNAPSHOT
FIGURE 19 THE WALT DISNEY COMPANY (HULU): SWOT ANALYSIS
FIGURE 20 TENCENT HOLDINGS LTD: FINANCIAL OVERVIEW SNAPSHOT
FIGURE 21 TENCENT HOLDINGS LTD: SWOT ANALYSIS
FIGURE 22 ROKU INC..: FINANCIAL OVERVIEW SNAPSHOT
FIGURE 23 ROKU INC..: SWOT ANALYSIS
FIGURE 24 GOOGLE LLC (YOUTUBE): FINANCIAL OVERVIEW SNAPSHOT
FIGURE 25 GOOGLE LLC (YOUTUBE): SWOT ANALYSIS
FIGURE 26 DAZN GROUP LIMITED: FINANCIAL OVERVIEW SNAPSHOT
FIGURE 27 DAZN GROUP LIMITED: SWOT ANALYSIS
FIGURE 28 NBC UNIVERSAL (HAYU): FINANCIAL OVERVIEW SNAPSHOT
FIGURE 29 NBC UNIVERSAL (HAYU): SWOT ANALYSIS
FIGURE 30 PCCW MEDIA GROUP (VIU): FINANCIAL OVERVIEW SNAPSHOT
FIGURE 31 PCCW MEDIA GROUP (VIU): SWOT ANALYSIS
OTT Market Segmentation
OTT Type Outlook (USD Billion, 2018-2032)
Game Streaming
Audio Streaming
Video Streaming
Communication
OTT Streaming Devices Outlook (USD Billion, 2018-2032)
Smartphones and Tablets
Desktops and Laptops
IPTV and Consoles
OTT Monetization Model Outlook (USD Billion, 2018-2032)
Subscription-Based
Advertising-based
Transaction-Based
OTT Service Verticals Outlook (USD Billion, 2018-2032)
Media and Entertainment
Education and Learning
Gaming
Service Utilities
OTT Regional Outlook (USD Billion, 2018-2032)
North America Outlook (USD Billion, 2018-2032)
North America OTT by Type
Game Streaming
Audio Streaming
Video Streaming
Communication
North America OTT by Streaming Devices
> Smartphones and Tablets
Desktops and Laptops
IPTV and Consoles
North America OTT by Monetization Model
Subscription-Based
Advertising-based
Transaction-Based
North America OTT by Service Verticals
Media and Entertainment
Education and Learning
Gaming
Service Utilities
US Outlook (USD Billion, 2018-2032)
US OTT by Type
Game Streaming
Audio Streaming
Video Streaming
Communication
US OTT by Streaming Devices
Smartphones and Tablets
Desktops and Laptops
IPTV and Consoles
US OTT by Monetization Model
Subscription-Based
Advertising-based
Transaction-Based
US OTT by Service verticals
Media and Entertainment
Education and Learning
Gaming
Service Utilities
CANADA Outlook (USD Billion, 2018-2032)
CANADA OTT by Type
Game Streaming
Audio Streaming
Video Streaming
Communication
CANADA OTT by Streaming Devices
Smartphones and Tablets
Desktops and Laptops
IPTV and Consoles
CANADA OTT by Monetization Model
Subscription-Based
Advertising-based
Transaction-Based
CANADA OTT by Service verticals
Media and Entertainment
Education and Learning
Gaming
Service Utilities
Europe Outlook (USD Billion, 2018-2032)
Europe OTT by Type
Game Streaming
Audio Streaming
Video Streaming
Communication
Europe OTT by Streaming Devices
Smartphones and Tablets
Desktops and Laptops
IPTV and Consoles
Europe OTT by Monetization Model
Subscription-Based
Advertising-based
Transaction-Based
Europe OTT by Service verticals
Media and Entertainment
Education and Learning
Gaming
Service Utilities
Germany Outlook (USD Billion, 2018-2032)
Germany OTT by Type
Game Streaming
Audio Streaming
Video Streaming
Communication
Germany OTT by Streaming Devices
Smartphones and Tablets
Desktops and Laptops
IPTV and Consoles
Germany OTT by Monetization Model
Subscription-Based
Advertising-based
Transaction-Based
Germany OTT by Service verticals
Media and Entertainment
Education and Learning
Gaming
Service Utilities
France Outlook (USD Billion, 2018-2032)
France OTT by Type
Game Streaming
Audio Streaming
Video Streaming
Communication
France OTT by Streaming Devices
Smartphones and Tablets
Desktops and Laptops
IPTV and Consoles
France OTT by Monetization Model
Subscription-Based
Advertising-based
Transaction-Based
France OTT by Service verticals
Media and Entertainment
Education and Learning
Gaming
Service Utilities
UK Outlook (USD Billion, 2018-2032)
UK OTT by Type
Game Streaming
Audio Streaming
Video Streaming
Communication
UK OTT by Streaming Devices
Smartphones and Tablets
Desktops and Laptops
IPTV and Consoles
UK OTT by Monetization Model
Subscription-Based
Advertising-based
Transaction-Based
UK OTT by Service verticals
Media and Entertainment
Education and Learning
Gaming
Service Utilities
ITALY Outlook (USD Billion, 2018-2032)
ITALY OTT by Type
Game Streaming
Audio Streaming
Video Streaming
Communication
ITALY OTT by Streaming Devices
Smartphones and Tablets
Desktops and Laptops
IPTV and Consoles
ITALY OTT by Monetization Model
Subscription-Based
Advertising-based
Transaction-Based
ITALY OTT by Service verticals
Media and Entertainment
Education and Learning
Gaming
Service Utilities
SPAIN Outlook (USD Billion, 2018-2032)
Spain OTT by Type
Game Streaming
Audio Streaming
Video Streaming
Communication
Spain OTT by Streaming Devices
Smartphones and Tablets
Desktops and Laptops
IPTV and Consoles
Spain OTT by Monetization Model
Subscription-Based
Advertising-based
Transaction-Based
Spain OTT by Service verticals
Media and Entertainment
Education and Learning
Gaming
Service Utilities
Rest Of Europe Outlook (USD Billion, 2018-2032)
Rest Of Europe OTT by Type
Game Streaming
Audio Streaming
Video Streaming
Communication
REST OF EUROPE OTT by Streaming Devices
Smartphones and Tablets
Desktops and Laptops
IPTV and Consoles
REST OF EUROPE OTT by Monetization Model
Subscription-Based
Advertising-based
Transaction-Based
REST OF EUROPE OTT by Service verticals
Media and Entertainment
Education and Learning
Gaming
Service Utilities
Asia-Pacific Outlook (USD Billion, 2018-2032)
Asia-Pacific OTT by Type
Game Streaming
Audio Streaming
Video Streaming
Communication
Asia-Pacific OTT by Streaming Devices
Smartphones and Tablets
Desktops and Laptops
IPTV and Consoles
Asia-Pacific OTT by Monetization Model
Subscription-Based
Advertising-based
Transaction-Based
Asia-Pacific OTT by Service verticals
Media and Entertainment
Education and Learning
Gaming
Service Utilities
China Outlook (USD Billion, 2018-2032)
China OTT by Type
Game Streaming
Audio Streaming
Video Streaming
Communication
China OTT by Streaming Devices
Smartphones and Tablets
Desktops and Laptops
IPTV and Consoles
China OTT by Monetization Model
Subscription-Based
Advertising-based
Transaction-Based
China OTT by Service verticals
Media and Entertainment
Education and Learning
Gaming
Service Utilities
Japan Outlook (USD Billion, 2018-2032)
Japan OTT by Type
Game Streaming
Audio Streaming
Video Streaming
Communication
Japan OTT by Streaming Devices
Smartphones and Tablets
Desktops and Laptops
IPTV and Consoles
Japan OTT by Monetization Model
Subscription-Based
Advertising-based
Transaction-Based
Japan OTT by Service verticals
Media and Entertainment
Education and Learning
Gaming
Service Utilities
India Outlook (USD Billion, 2018-2032)
India OTT by Type
Game Streaming
Audio Streaming
Video Streaming
Communication
India OTT by Streaming Devices
Smartphones and Tablets
Desktops and Laptops
IPTV and Consoles
India OTT by Monetization Model
Subscription-Based
Advertising-based
Transaction-Based
India OTT by Service verticals
Based on Service verticals:
Media and Entertainment
Education and Learning
Gaming
Service Utilities
Australia Outlook (USD Billion, 2018-2032)
Australia OTT by Type
Game Streaming
Audio Streaming
Video Streaming
Communication
Australia OTT by Streaming Devices
Smartphones and Tablets
Desktops and Laptops
IPTV and Consoles
Australia OTT by Monetization Model
Subscription-Based
Advertising-based
Transaction-Based
Australia OTT by Service verticals
Media and Entertainment
Education and Learning
Gaming
Service Utilities
Rest of Asia-Pacific Outlook (USD Billion, 2018-2032)
Rest of Asia-Pacific OTT by Type
Game Streaming
Audio Streaming
Video Streaming
Communication
Rest of Asia-Pacific OTT by Streaming Devices
Smartphones and Tablets
Desktops and Laptops
IPTV and Consoles
Rest of Asia-Pacific OTT by Monetization Model
Subscription-Based
Advertising-based
Transaction-Based
Rest of Asia-Pacific OTT by Service verticals
Media and Entertainment
Education and Learning
Gaming
Service Utilities
Rest of the World Outlook (USD Billion, 2018-2032)
Rest of the World OTT by Type
Game Streaming
Audio Streaming
Video Streaming
Communication
Rest of the World OTT by Streaming Devices
Smartphones and Tablets
Desktops and Laptops
IPTV and Consoles
Rest of the World OTT by Monetization Model
Subscription-Based
Advertising-based
Transaction-Based
Rest of the World OTT by Service verticals
Media and Entertainment
Education and Learning
Gaming
Service Utilities
Middle East Outlook (USD Billion, 2018-2032)
Middle East OTT by Type
Game Streaming
Audio Streaming
Video Streaming
Communication
Middle East OTT by Streaming Devices
Smartphones and Tablets
Desktops and Laptops
IPTV and Consoles
Middle East OTT by Monetization Model
Subscription-Based
Advertising-based
Transaction-Based
Middle East OTT by Service verticals
Media and Entertainment
Education and Learning
Gaming
Service Utilities
Billion, 2018-2032)
Africa OTT by Type
Game Streaming
Audio Streaming
Video Streaming
Communication
Africa OTT by Streaming Devices
Smartphones and Tablets
Desktops and Laptops
IPTV and Consoles
Africa OTT by Monetization Model
Subscription-Based
Advertising-based
Transaction-Based
Africa OTT by Service verticals
Media and Entertainment
Education and Learning
Gaming
Service Utilities
Latin America Outlook (USD Billion, 2018-2032)
Latin America OTT by Type
Game Streaming
Audio Streaming
Video Streaming
Communication
Latin America OTT by Streaming Devices
Smartphones and Tablets
Desktops and Laptops
IPTV and Consoles
Latin America OTT by Monetization Model
Subscription-Based
Advertising-based
Transaction-Based
Latin America OTT by Service verticals
Media and Entertainment
Education and Learning
Gaming
Service Utilities