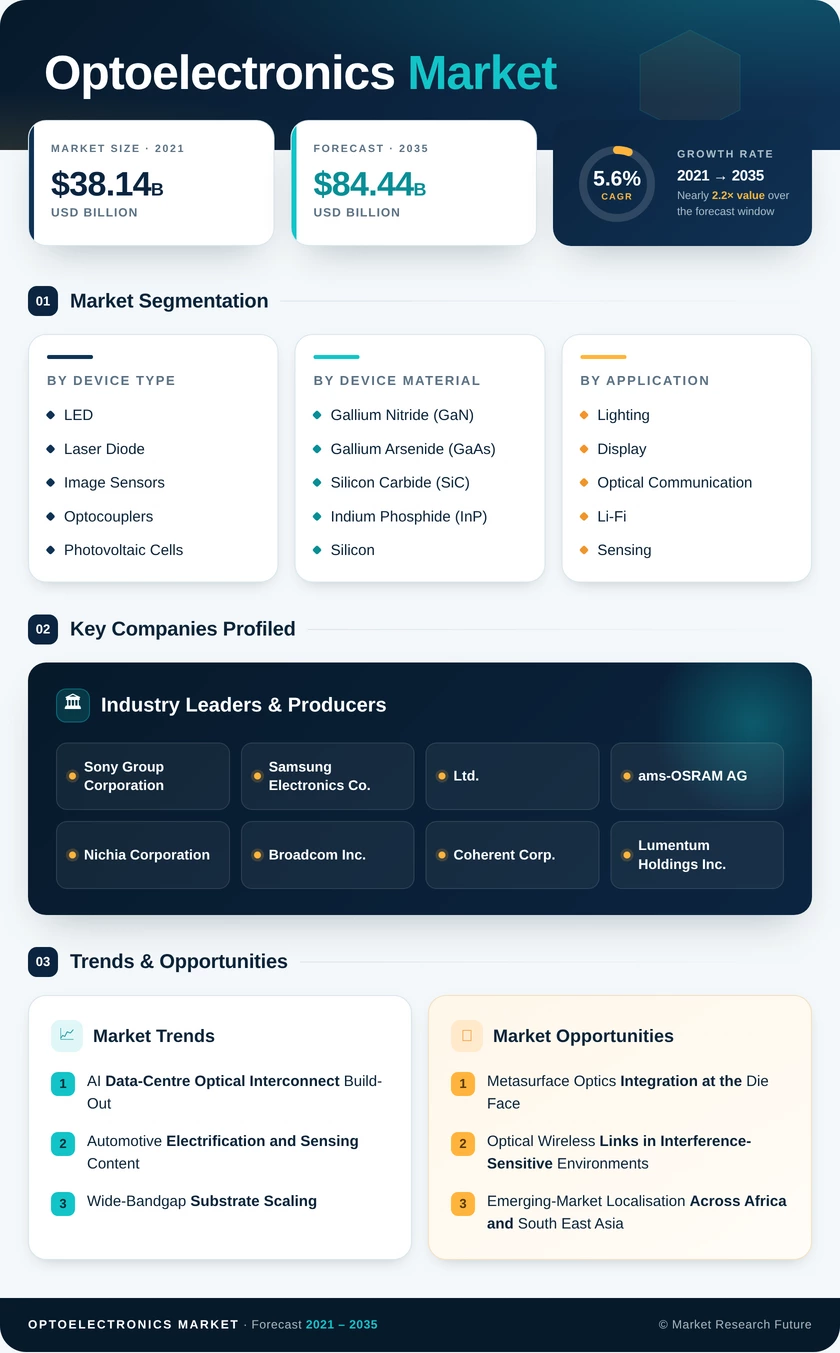
Optoelectronics Market (2026 – 2035)

ID: MRFR/SEM/4448-HCR 200 Pages Ankit Gupta Last Updated: September 15, 2026
Optoelectronics Market Size, Share and Research Report By Device Type (LED, Laser Diode, Image Sensors, Optocouplers, Photovoltaic Cells, Others), By Device Material (Gallium Nitride (GaN), Gallium Arsenide (GaAs), Silicon Carbide (SiC), Indium Phosphide (InP), Silicon and Others), By Application (Lighting and Display, Optical Communication and Li-Fi, Sensing and Imaging, Power Conversion and Photovoltaics, Defense and Security), By End-User Industry (Consumer Electronics, Automotive, Information Technology and Telecom, Healthcare and Life Sciences, Aerospace and Defense, Industrial Automation, Residential and Commercial) And By Region (North America, Europe, Asia-Pacific, And Rest Of The World) – Industry Forecast Till 2035
Optoelectronics Market
Market Size
Forecast Period2026-2035
CAGR (2026-2035)5.6%
2025 Market SizeUSD 48.96 Billion
2035 Market SizeUSD 84.44 Billion
Key Players
Sony Group Corporation
Samsung Electronics Co., Ltd.
ams-OSRAM AG
Nichia Corporation
Broadcom Inc.
Coherent Corp.
Opportunities
  • Metasurface Optics Integration at the Die Face
  • Optical Wireless Links in Interference-Sensitive Environments
  • Emerging-Market Localisation Across Africa and South East Asia
  1. 1 Market Summary | |
    1. 1.1 Study Assumptions and Market Definition | |
    2. 1.2 Scope of the Study | |
    3. 1.3 Research Methodology | |
  2. 2 Key Report Takeaways | |
    1. 2.1 By Device Type | |
    2. 2.2 By Device Material | |
    3. 2.3 By Application | |
    4. 2.4 By End-user Industry | |
    5. 2.5 By Region | |
  3. 3 Market Size and Forecast (2021–2035) | |
    1. 3.1 Historical Market Size (2021–2024) | |
    2. 3.2 Base Year Assessment (2025) | |
    3. 3.3 Forecast Market Size (2026–2035) | |
    4. 3.4 Year-over-Year Growth Analysis | |
  4. 4 Driver Impact Analysis | |
    1. 4.1 AI Data-Centre Optical Interconnect Build-Out | |
    2. 4.2 Automotive Electrification and Sensing Content | |
    3. 4.3 Wide-Bandgap Substrate Scaling | |
    4. 4.4 3D Sensing in Consumer Devices | |
    5. 4.5 Government Fabrication Incentives | |
    6. 4.6 Lighting Efficiency Regulation | |
    7. 4.7 Defence and Border Imaging Procurement | |
  5. 5 Restraints Impact Analysis | |
    1. 5.1 III-V Epitaxial Wafer Supply Constraints | |
    2. 5.2 Export Controls and Compliance Burden | |
    3. 5.3 Capital Intensity of Fab Conversion | |
    4. 5.4 Price Erosion in Commodity Emitters | |
    5. 5.5 Reliability Qualification Cycle Length | |
  6. 6 Opportunities | |
    1. 6.1 Metasurface Optics Integration at the Die Face | |
    2. 6.2 Optical Wireless Links in Interference-Sensitive Environments | |
    3. 6.3 Emerging-Market Localisation Across Africa and South East Asia | |
    4. 6.4 Sensing-as-a-Service and Recurring Revenue Models | |
    5. 6.5 Micro-LED Transition in Large-Format Display | |
  7. 7 Regional Market Share and Country-Level Analysis | |
    1. 7.1 North America | | |
      1. 7.1.1 United States | | |
      2. 7.1.2 Canada | | |
      3. 7.1.3 Mexico | |
    2. 7.2 Europe | | |
      1. 7.2.1 Germany | | |
      2. 7.2.2 United Kingdom | | |
      3. 7.2.3 France | | |
      4. 7.2.4 Italy | | |
      5. 7.2.5 Spain | | |
      6. 7.2.6 Rest of Europe | |
    3. 7.3 Asia-Pacific | | |
      1. 7.3.1 China | | |
      2. 7.3.2 Japan | | |
      3. 7.3.3 South Korea | | |
      4. 7.3.4 India | | |
      5. 7.3.5 South East Asia | | |
      6. 7.3.6 Australia | | |
      7. 7.3.7 Rest of Asia-Pacific | |
    4. 7.4 South America | | |
      1. 7.4.1 Brazil | | |
      2. 7.4.2 Rest of South America | |
    5. 7.5 Middle East and Africa | | |
      1. 7.5.1 Middle East | | |
      2. 7.5.2 United Arab Emirates | | |
      3. 7.5.3 Saudi Arabia | | |
      4. 7.5.4 Rest of Middle East | | |
      5. 7.5.5 Africa | | |
      6. 7.5.6 South Africa | | |
      7. 7.5.7 Rest of Africa | |
  8. 8 Future Outlook (2026–2035) | |
    1. 8.1 Optical Fabrics for Machine Learning Infrastructure | |
    2. 8.2 Electrification Supercycle and Vehicle Optical Content | |
    3. 8.3 Supply-Chain Localisation and Material Traceability | |
    4. 8.4 Efficiency Reporting and Product-Level Sustainability Disclosure | |
  9. 9 Segmentation Analysis | |
    1. 9.1 By Device Type | | |
      1. 9.1.1 LED | | |
      2. 9.1.2 Laser Diode | | |
      3. 9.1.3 Image Sensors | | |
      4. 9.1.4 Optocouplers | | |
      5. 9.1.5 Photovoltaic Cells | | |
      6. 9.1.6 Others | |
    2. 9.2 By Device Material | | |
      1. 9.2.1 Gallium Nitride (GaN) | | |
      2. 9.2.2 Gallium Arsenide (GaAs) | | |
      3. 9.2.3 Silicon Carbide (SiC) | | |
      4. 9.2.4 Indium Phosphide (InP) | | |
      5. 9.2.5 Silicon and Others | |
    3. 9.3 By Application | | |
      1. 9.3.1 Lighting and Display | | |
      2. 9.3.2 Optical Communication and Li-Fi | | |
      3. 9.3.3 Sensing and Imaging | | |
      4. 9.3.4 Power Conversion and Photovoltaics | | |
      5. 9.3.5 Defense and Security | |
    4. 9.4 By End-user Industry | | |
      1. 9.4.1 Consumer Electronics | | |
      2. 9.4.2 Automotive | | |
      3. 9.4.3 Information Technology and Telecom | | |
      4. 9.4.4 Healthcare and Life-Sciences | | |
      5. 9.4.5 Aerospace and Defense | | |
      6. 9.4.6 Industrial Automation | | |
      7. 9.4.7 Residential and Commercial | |
  10. 10 Competitive Landscape | |
    1. 10.1 Market Concentration Analysis (2026) | |
    2. 10.2 Competitive Benchmarking Matrix | |
    3. 10.3 Company Profiles | |
  11. 11 Recent News and Developments | |
  12. 12 Report Scope and Methodology | |
  13. 13 Detailed Sources and Citations | |
  14. 14 Frequently Asked Questions | | LIST OF TABLES | |
  15. TABLE 1 Global Optoelectronics Market Size and Forecast, by Revenue (USD Billion), 2021–2035 | |
  16. TABLE 2 Global Optoelectronics Market — Year-over-Year Growth Analysis, 2021–2035 | |
  17. TABLE 3 Driver Impact Analysis — Global Optoelectronics Market, 2026–2035 | |
  18. TABLE 4 Restraint Impact Analysis — Global Optoelectronics Market, 2026–2035 | |
  19. TABLE 5 Global Optoelectronics Market Size, by Region, 2021–2035 (USD Billion) | |
  20. TABLE 6 North America Optoelectronics Market Size, by Country, 2021–2035 (USD Billion) | |
  21. TABLE 7 Europe Optoelectronics Market Size, by Country, 2021–2035 (USD Billion) | |
  22. TABLE 8 Asia-Pacific Optoelectronics Market Size, by Country, 2021–2035 (USD Billion) | |
  23. TABLE 9 South America Optoelectronics Market Size, by Country, 2021–2035 (USD Billion) | |
  24. TABLE 10 Middle East and Africa Optoelectronics Market Size, by Country, 2021–2035 (USD Billion) | |
  25. TABLE 11 Global Optoelectronics Market Size, by Device Type, 2021–2035 (USD Billion) | |
  26. TABLE 12 Global Optoelectronics Market Size, by Device Material, 2021–2035 (USD Billion) | |
  27. TABLE 13 Global Optoelectronics Market Size, by Application, 2021–2035 (USD Billion) | |
  28. TABLE 14 Global Optoelectronics Market Size, by End-user Industry, 2021–2035 (USD Billion) | |
  29. TABLE 15 Competitive Benchmarking Matrix — Global Optoelectronics Market, 2026 | |
  30. TABLE 16 Company Profiles — Key Players, Global Optoelectronics Market | |
  31. TABLE 17 Recent Developments and Strategic Announcements, 2023–2025 | |
  32. TABLE 18 Report Scope and Methodology Summary | |
  33. TABLE 19 Detailed Sources and Citations Index | |
  34. TABLE 20 Segmentation Quick Reference — Dominant and Fastest-Growing Segments | | LIST OF FIGURES | |
  35. FIGURE 1 Global Optoelectronics Market Dynamics — Drivers, Restraints and Opportunities | |
  36. FIGURE 2 Industry Value Chain Analysis — Substrate to Module | |
  37. FIGURE 3 Porter's Five Forces Analysis — Global Optoelectronics Market | |
  38. FIGURE 4 Global Market Size Trend and Forecast, 2021–2035 (USD Billion) | |
  39. FIGURE 5 Year-over-Year Growth Rate Trend, 2022–2035 (%) | |
  40. FIGURE 6 Market Share by Device Type, 2025 (%) | |
  41. FIGURE 7 Market Share by Device Material, 2025 (%) | |
  42. FIGURE 8 Market Share by Application, 2025 (%) | |
  43. FIGURE 9 Market Share by End-user Industry, 2025 (%) | |
  44. FIGURE 10 Regional Revenue Share, 2025 (%) | |
  45. FIGURE 11 Regional CAGR Comparison, 2026–2035 (%) | |
  46. FIGURE 12 Country-Level Contribution within Asia-Pacific, 2025 (%) | |
  47. FIGURE 13 Competitive Landscape — Estimated Revenue Share Positioning, 2026 | |
  48. FIGURE 14 Fastest-Growing Segment Comparison across Dimensions, 2026–2035

Segmentation Quick Reference

DimensionSub-SegmentsDominant SegmentFastest Growing Segment
By Device TypeLED; Laser Diode; Image Sensors; Optocouplers; Photovoltaic Cells; OthersLED — 31.6% share (2025)Laser Diode — 7.3% CAGR (2026–2035)
By Device MaterialGallium Nitride (GaN); Gallium Arsenide (GaAs); Silicon Carbide (SiC); Indium Phosphide (InP); Silicon and OthersGallium Nitride (GaN) — 38.1% share (2025)Silicon Carbide (SiC) — 7.9% CAGR (2026–2035)
By ApplicationLighting and Display; Optical Communication and Li-Fi; Sensing and Imaging; Power Conversion and Photovoltaics; Defense and SecurityLighting and Display — USD 16.84 Billion (2025)Optical Communication and Li-Fi — 6.0% CAGR (2026–2035)
By End-user IndustryConsumer Electronics; Automotive; Information Technology and Telecom; Healthcare and Life-Sciences; Aerospace and Defense; Industrial Automation; Residential and CommercialConsumer Electronics — 42.8% share (2025)Automotive — 6.5% CAGR (2026–2035)


Market Segmentation Overview

By Device Type

Sub-SegmentKey Trend
LEDEfficacy gains above 150 lumens per watt sustain retrofit and horticulture demand
Laser DiodeMulti-junction vertical-cavity structures expand optical power within fixed die area
Image SensorsStacked architectures move from handset into automotive qualification
OptocouplersSteady industrial isolation demand with limited architectural change
Photovoltaic CellsUtility-scale and distributed solar drive volume, with pricing under pressure
OthersSpecialty infrared emitters and detectors serve defence and analytical niches


LED remains the revenue leader at 31.6% share because mature production lines deliver incremental efficacy improvement without capital reinvestment, and commercial retrofit specifications keep pulling volume. Laser Diode grows fastest at a 7.3% CAGR as handset makers adopt turnkey emitter packages for depth sensing and vehicle programmes qualify solid-state ranging units. Image Sensors sit second on revenue, benefiting from rising camera counts per device, while Optocouplers grow slowly against a stable industrial isolation base.

By Device Material

Sub-SegmentKey Trend
Gallium Nitride (GaN)200 mm wafer scaling cuts die cost while alloy engineering tunes emission wavelength
Gallium Arsenide (GaAs)Remains the volume workhorse for infrared emission in sensing and remote control
Silicon Carbide (SiC)8-inch substrate qualification unlocks fast-charging and inverter power devices
Indium Phosphide (InP)Direct bandgap supports high modulation speeds at low drive voltage
Silicon and OthersCMOS-compatible fabrication enables dense transceivers via hybrid laser attach


Gallium Nitride (GaN) leads at 38.1% share on electron mobility and thermal conductivity that support efficient high-frequency operation across emitters and power devices. Silicon Carbide (SiC) advances fastest at a 7.9% CAGR because government-backed pilot lines in the United States and Europe have qualified 8-inch substrates, opening electric-vehicle charging and solar inverter volumes. Indium Phosphide (InP) captures data-centre optics beyond 400G, while Gallium Arsenide (GaAs) holds steady infrared volume that neither material displaces.

By Application

Sub-SegmentKey Trend
Lighting and DisplayCommercial retrofit plus micro-scale videowall installation sustain volume
Optical Communication and Li-FiCo-packaged modules move adjacent to switch silicon, cutting power per bit
Sensing and ImagingSpectrally tuned detectors extend into medical wearables and industrial inspection
Power Conversion and PhotovoltaicsWide-bandgap inverters reduce system cost for residential and utility solar
Defense and SecurityInfrared detector procurement supports border and perimeter surveillance


Lighting and Display holds the largest revenue position at USD 16.84 Billion, sustained by efficacy-driven retrofit mandates and commercial videowall installation. Optical Communication and Li-Fi grows fastest at a 6.0% CAGR as hyperscale operators retire copper backplanes for fully optical fabrics, with co-packaged optics shrinking power budgets at throughput above 25 Tb/s. Sensing and Imaging trails closely on automotive and medical detector adoption, while Defense and Security remains the smallest but highest-margin category.

By End-user Industry

Sub-SegmentKey Trend
Consumer ElectronicsOptical content per device rises faster than unit shipments
AutomotiveElectrification and autonomy add ranging, lighting and monitoring modules
Information Technology and TelecomGenerational network upgrades drive transceiver refresh cycles
Healthcare and Life-SciencesPatient-mounted imaging extends sensing beyond clinical settings
Aerospace and DefenseInfrared targeting and navigation sustain long-cycle procurement
Industrial AutomationMachine vision and laser processing displace mechanical inspection
Residential and CommercialBuilding conversion pairs lighting upgrades with occupancy sensing


Consumer Electronics dominates at 42.8% share, driven less by unit volume than by rising optical content per device as depth-sensing and biosensing modules migrate into mid-tier handsets and wearables. Automotive grows fastest at a 6.5% CAGR because European fleet emissions rules push tier-one suppliers toward devices that reduce vehicle energy draw while autonomy programmes add ranging and cabin-monitoring hardware. Information Technology and Telecom provides steady mid-cycle demand, and Healthcare and Life-Sciences emerges as the highest-margin adjacent channel.




Download PDF ×

We do not share your information with anyone. However, we may send you emails based on your report interest from time to time. You may contact us at any time to opt-out.