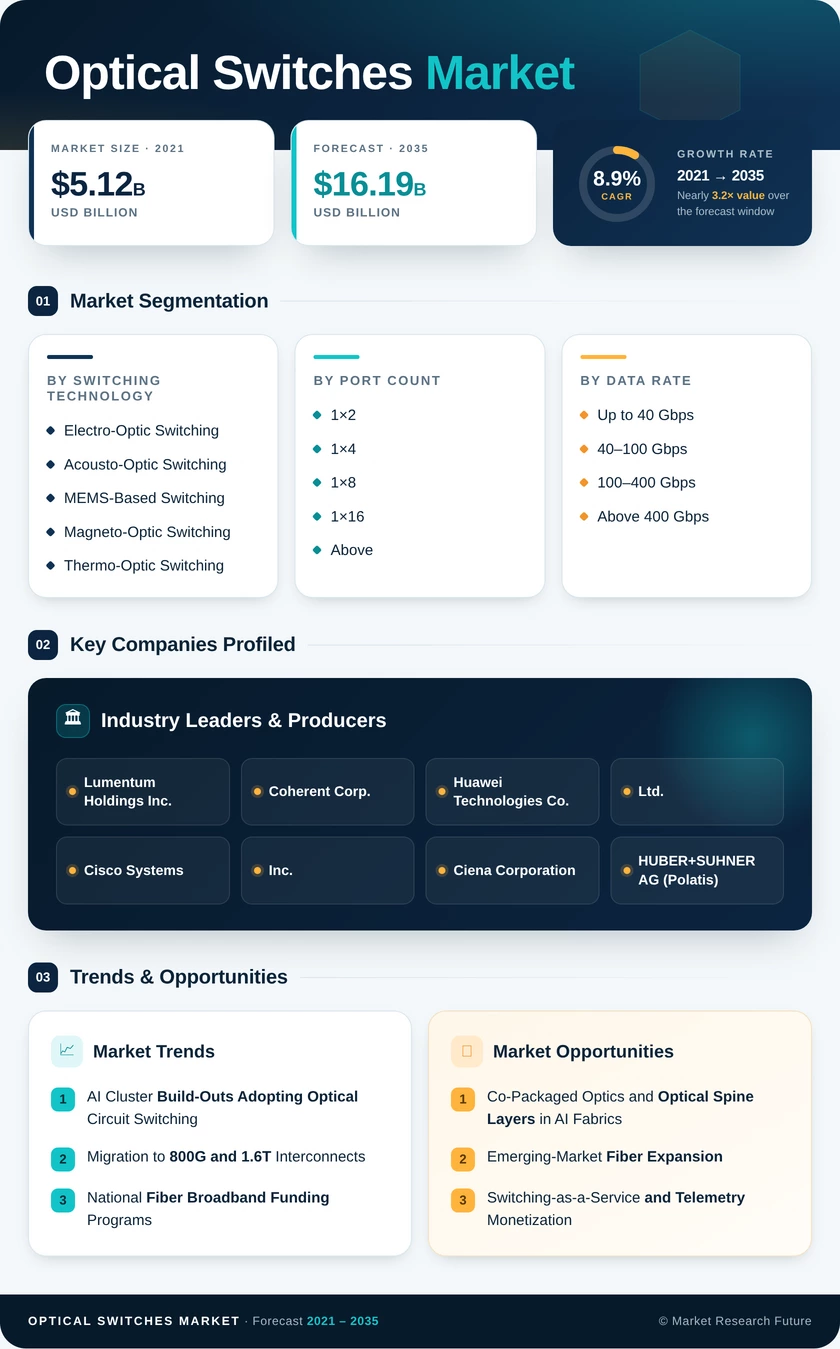
Optical Switches Market (2026 - 2035)

ID: MRFR/SEM/6200-HCR 100 Pages Nirmit Biswas Last Updated: November 04, 2026
Optical Switches Market Size, Share and Research Report By Switching Technology (Electro-Optic Switching, Acousto-Optic Switching, MEMS-Based Switching, Magneto-Optic Switching, Thermo-Optic Switching, and Other Switching Technologies), By Port Count (1×2, 1×4, 1×8, and 1×16 and Above), By Data Rate (Up to 40 Gbps, 40–100 Gbps, 100–400 Gbps, and Above 400 Gbps), By End-User Industry (IT and Telecom, Government and Defense, Banking, Financial Services, and Insurance (BFSI), Manufacturing, Healthcare and Life Sciences, and Other End-User Industries), By Application (Circuit Switching, Testing and Monitoring, Multiplexing, Cross-Connects, Signal Monitoring, and Other Applications) And By Region (North America, Europe, Asia-Pacific, And Rest Of The World) –Industry Forecast Till 2035
Optical Switches Market
Market Size
Forecast Period2026-2035
CAGR (2026-2035)8.9%
2025 Market SizeUSD 6.90 Billion
2035 Market SizeUSD 16.19 Billion
Key Players
Lumentum Holdings Inc.
Coherent Corp.
Huawei Technologies Co., Ltd.
Cisco Systems, Inc.
Ciena Corporation
HUBER+SUHNER AG
Opportunities
  • Co-Packaged Optics and Optical Spine Layers in AI Fabrics
  • Emerging-Market Fiber Expansion
  • Switching-as-a-Service and Telemetry Monetization
  1. 1 Market Summary | |
  2. 2 Key Report Takeaways | |
    1. 2.1 By Switching Technology | |
    2. 2.2 By Port Count | |
    3. 2.3 By Data Rate | |
    4. 2.4 By End-User Industry | |
    5. 2.5 By Application | |
    6. 2.6 By Region | |
  3. 3 Market Size and Forecast (2021–2035) | |
    1. 3.1 Historical Market Size (2021–2024) | |
    2. 3.2 Base Year Market Size (2025) | |
    3. 3.3 Forecast Market Size (2026–2035) | |
    4. 3.4 Year-over-Year Growth Analysis | |
  4. 4 Driver Impact Analysis | |
    1. 4.1 AI Cluster Build-Outs Adopting Optical Circuit Switching | |
    2. 4.2 Migration to 800G and
    3. 1.6T Interconnects | |
    4. 4.3 National Fiber Broadband Funding Programs | |
    5. 4.4 Data-Center Energy Efficiency Pressure | |
    6. 4.5 Low-Latency Requirements in Financial Networks | |
    7. 4.6 Sovereign AI and Computing-Power Programs | |
  5. 5 Restraints Impact Analysis | |
    1. 5.1 High Upfront Cost and Integration Complexity | |
    2. 5.2 Export Controls and Supply-Chain Concentration | |
    3. 5.3 Reliability Qualification and Insertion-Loss Limits | |
    4. 5.4 Absence of Standardized Control-Plane Interfaces | |
    5. 5.5 Shortage of Skilled Photonics Talent | |
  6. 6 Opportunities | |
    1. 6.1 Co-Packaged Optics and Optical Spine Layers in AI Fabrics | |
    2. 6.2 Emerging-Market Fiber Expansion | |
    3. 6.3 Switching-as-a-Service and Telemetry Monetization | |
    4. 6.4 Quantum-Safe and Defense Networks | |
  7. 7 Regional Market Share and Country-Level Analysis | |
    1. 7.1 North America | | |
      1. 7.1.1 United States | | |
      2. 7.1.2 Canada | | |
      3. 7.1.3 Mexico | |
    2. 7.2 Europe | | |
      1. 7.2.1 Germany | | |
      2. 7.2.2 United Kingdom | | |
      3. 7.2.3 France | | |
      4. 7.2.4 Russia | | |
      5. 7.2.5 Rest of Europe | |
    3. 7.3 Asia-Pacific | | |
      1. 7.3.1 China | | |
      2. 7.3.2 Japan | | |
      3. 7.3.3 India | | |
      4. 7.3.4 South Korea | | |
      5. 7.3.5 Australia | | |
      6. 7.3.6 Rest of Asia-Pacific | |
    4. 7.4 South America | | |
      1. 7.4.1 Brazil | | |
      2. 7.4.2 Argentina | | |
      3. 7.4.3 Rest of South America | |
    5. 7.5 Middle East and Africa | | |
      1. 7.5.1 Middle East | | |
      2. 7.5.2 Saudi Arabia | | |
      3. 7.5.3 United Arab Emirates | | |
      4. 7.5.4 Rest of Middle East | | |
      5. 7.5.5 Africa | | |
      6. 7.5.6 South Africa | | |
      7. 7.5.7 Egypt | | |
      8. 7.5.8 Rest of Africa | |
  8. 8 Future Outlook (2026–2035) | |
    1. 8.1 AI-Scale Reconfigurable Fabrics | |
    2. 8.2 Energy and Sustainability Constraints | |
    3. 8.3 Photonics-First Network Architectures | |
    4. 8.4 Supply-Chain Localization | |
  9. 9 Segmentation Analysis | |
    1. 9.1 By Switching Technology | | |
      1. 9.1.1 Electro-Optic Switching | | |
      2. 9.1.2 Acousto-Optic Switching | | |
      3. 9.1.3 MEMS-Based Switching | | |
      4. 9.1.4 Magneto-Optic Switching | | |
      5. 9.1.5 Thermo-Optic Switching | | |
      6. 9.1.6 Other Switching Technologies | |
    2. 9.2 By Port Count | | |
      1. 9.2.1 1×2 | | |
      2. 9.2.2 1×4 | | |
      3. 9.2.3 1×8 | | |
      4. 9.2.4 1×16 and Above | |
    3. 9.3 By Data Rate | | |
      1. 9.3.1 Up to 40 Gbps | | |
      2. 9.3.2 40–100 Gbps | | |
      3. 9.3.3 100–400 Gbps | | |
      4. 9.3.4 Above 400 Gbps | |
    4. 9.4 By End-User Industry | | |
      1. 9.4.1 IT and Telecom | | |
      2. 9.4.2 Government and Defense | | |
      3. 9.4.3 Banking, Financial Services, and Insurance (BFSI) | | |
      4. 9.4.4 Manufacturing | | |
      5. 9.4.5 Healthcare and Life Sciences | | |
      6. 9.4.6 Other End-User Industries | |
    5. 9.5 By Application | | |
      1. 9.5.1 Circuit Switching | | |
      2. 9.5.2 Testing and Monitoring | | |
      3. 9.5.3 Multiplexing | | |
      4. 9.5.4 Cross-Connects | | |
      5. 9.5.5 Signal Monitoring | | |
      6. 9.5.6 Other Applications | |
  10. 10 Competitive Landscape | |
    1. 10.1 Market Concentration Analysis | |
    2. 10.2 Competitive Benchmarking Matrix | |
    3. 10.3 Company Profiles | | |
      1. 10.3.1 Lumentum Holdings Inc. | | |
      2. 10.3.2 Coherent Corp. | | |
      3. 10.3.3 Huawei Technologies Co., Ltd. | | |
      4. 10.3.4 Cisco Systems, Inc. | | |
      5. 10.3.5 Ciena Corporation | | |
      6. 10.3.6 HUBER+SUHNER AG | | |
      7. 10.3.7 Calient Technologies, Inc. | | |
      8. 10.3.8 DiCon Fiberoptics, Inc. | | |
      9. 10.3.9 Agiltron Inc. | | |
      10. 10.3.10 Sercalo Microtechnology Ltd. | |
  11. 11 Recent News & Developments | |
  12. 12 Report Scope and Methodology | |
  13. 13 Detailed Sources and Citations | |
  14. 14 Frequently Asked Questions (FAQs) | | LIST OF TABLES | |
  15. TABLE 1 Global Optical Switches Market Summary Snapshot, 2025–2035 | |
  16. TABLE 2 Global Optical Switches Market Size & Forecast, by Revenue (USD Billion), 2021–2035 | |
  17. TABLE 3 Driver Impact Analysis, 2026–2035 | |
  18. TABLE 4 Restraints Impact Analysis, 2026–2035 | |
  19. TABLE 5 Global Optical Switches Market, Regional Summary, 2025 | |
  20. TABLE 6 North America Optical Switches Market, by Country, 2025 | |
  21. TABLE 7 Europe Optical Switches Market, by Country, 2025 | |
  22. TABLE 8 Asia-Pacific Optical Switches Market, by Country, 2025 | |
  23. TABLE 9 South America Optical Switches Market, by Country, 2025 | |
  24. TABLE 10 Middle East and Africa Optical Switches Market, by Country, 2025 | |
  25. TABLE 11 Global Optical Switches Market, by Switching Technology, 2025 | |
  26. TABLE 12 Global Optical Switches Market, by Port Count, 2025 | |
  27. TABLE 13 Global Optical Switches Market, by Data Rate, 2025 | |
  28. TABLE 14 Global Optical Switches Market, by End-User Industry, 2025 | |
  29. TABLE 15 Global Optical Switches Market, by Application, 2025 | |
  30. TABLE 16 Competitive Benchmarking Matrix, 2025 | |
  31. TABLE 17 Report Scope and Methodology | |
  32. TABLE 18 Detailed Sources and Citations | |
  33. TABLE 19 Segmentation Quick Reference | |
  34. TABLE 20 Sub-Segment Key Trends, by Switching Technology | |
  35. TABLE 21 Sub-Segment Key Trends, by Port Count | |
  36. TABLE 22 Sub-Segment Key Trends, by Data Rate | |
  37. TABLE 23 Sub-Segment Key Trends, by End-User Industry | |
  38. TABLE 24 Sub-Segment Key Trends, by Application | | LIST OF FIGURES | |
  39. FIGURE 1 Optical Switches Market Dynamics Overview (Drivers, Restraints, Opportunities) | |
  40. FIGURE 2 Optical Switches Industry Value Chain Analysis | |
  41. FIGURE 3 Porter's Five Forces Analysis | |
  42. FIGURE 4 Global Optical Switches Market Size Trend, 2021–2035 (USD Billion) | |
  43. FIGURE 5 Year-over-Year Growth Rate, 2022–2035 | |
  44. FIGURE 6 Market Share by Switching Technology, 2025 | |
  45. FIGURE 7 Market Share by Port Count, 2025 | |
  46. FIGURE 8 Market Share by Data Rate, 2025 | |
  47. FIGURE 9 Market Share by End-User Industry, 2025 | |
  48. FIGURE 10 Market Share by Application, 2025 | |
  49. FIGURE 11 Regional Market Share, 2025 | |
  50. FIGURE 12 Regional Growth Comparison, 2026–2035 | |
  51. FIGURE 13 Competitive Landscape Positioning Map, 2025 | |
  52. FIGURE 14 Estimated Revenue Share Ranges of Key Players, 2025

Segmentation Quick Reference

DimensionSub-SegmentsDominant SegmentFastest Growing Segment
By Switching TechnologyElectro-Optic Switching; Acousto-Optic Switching; MEMS-Based Switching; Magneto-Optic Switching; Thermo-Optic Switching; Other Switching TechnologiesMEMS-Based Switching (41.2% share)Electro-Optic Switching (9.6% CAGR)
By Port Count1×2; 1×4; 1×8; 1×16 and Above1×8 (34.4% share)1×16 and Above (9.7% CAGR)
By Data RateUp to 40 Gbps; 40–100 Gbps; 100–400 Gbps; Above 400 Gbps100–400 Gbps (37.1% share)Above 400 Gbps (9.8% CAGR)
By End-User IndustryIT and Telecom; Government and Defense; Banking, Financial Services, and Insurance (BFSI); Manufacturing; Healthcare and Life Sciences; Other End-User IndustriesIT and Telecom (44.6% share)Banking, Financial Services, and Insurance (BFSI) (9.9% CAGR)
By ApplicationCircuit Switching; Testing and Monitoring; Multiplexing; Cross-Connects; Signal Monitoring; Other ApplicationsCircuit Switching (38.5% share)Testing and Monitoring (9.8% CAGR)
By RegionNorth America; Europe; Asia-Pacific; South America; Middle East and AfricaAsia-Pacific (41.6% share)Middle East and Africa (10.7% CAGR)

Market Segmentation Overview

By Switching Technology

Sub-SegmentKey Trend
Electro-Optic SwitchingThin-film lithium niobate enabling nanosecond reconfiguration
Acousto-Optic SwitchingSteady use in laser processing and instrumentation
MEMS-Based SwitchingHigh-port micromirror arrays replacing electrical spine tiers
Magneto-Optic SwitchingLow-loss designs tested in quantum networks
Thermo-Optic SwitchingLow-cost planar devices for metro networks
Other Switching TechnologiesLiquid-crystal and hybrid architectures in wavelength routing

MEMS-Based Switching leads with a 41.2% share because micromirror arrays scale to large port counts with low loss, which hyperscale spine layers require. Electro-Optic Switching grows fastest at a 9.6% CAGR, as thin-film lithium niobate and silicon photonics cut switching times to nanoseconds for AI job scheduling. Thermo-Optic Switching holds its position in price-driven metro tenders, while Magneto-Optic devices remain tied to quantum pilots.

By Port Count

Sub-SegmentKey Trend
1×2Latching protection switches in carrier rings
1×4Compact aggregation and lab switching
1×8Workhorse configuration for test racks and metro nodes
1×16 and AboveLarge matrices for mesh data-center fabrics

The 1×8 configuration leads with a 34.4% share, reflecting its fit for test-and-measurement racks and metro aggregation. 1×16 and Above grows fastest at a 9.7% CAGR because hyperscalers need high-radix switches to offload large flows from packet silicon. 1×2 units remain essential for fiber protection, though their low unit price limits revenue contribution.

By Data Rate

Sub-SegmentKey Trend
Up to 40 GbpsPersisting in legacy enterprise networks
40–100 GbpsServing metro backbone routes
100–400 GbpsCurrent data-center mainstream
Above 400 GbpsRapid uptake with 800G and 1.6T Ethernet

The 100–400 Gbps band leads with a 37.1% share, matching the installed data-center base built over the past five years. Above 400 Gbps grows fastest at a 9.8% CAGR as IEEE 802.3dj standardizes 800G and 1.6T links for AI clusters. The 40–100 Gbps tier continues to serve metro backbones, while up to 40 Gbps ports decline slowly in legacy enterprise settings.

By End-User Industry

Sub-SegmentKey Trend
IT and TelecomFiber builds and hyperscale fabrics
Government and DefenseSecure terrestrial and satellite links.
Banking, Financial Services, and Insurance (BFSI)Microsecond-grade trading networks
ManufacturingDeterministic optics for factory automation
Healthcare and Life SciencesHigh-volume genomics and imaging data
Other End-User IndustriesMedia streaming and campus networks

IT and Telecom leads with a 44.6% share, supported by carrier fiber programs and hyperscale data-center construction. BFSI grows fastest at a 9.9% CAGR, as MiFID II timing rules and competitive trading push banks toward optical routing between colocation sites. Government and Defense and Healthcare and Life Sciences add specialized demand tied to secure communications and large data transfers.

By Application

Sub-SegmentKey Trend
Circuit SwitchingCore of reconfigurable data-center and transport fabrics
Testing and MonitoringInstrumentation for automated multi-terabit networks
MultiplexingWavelength management in metro rings
Cross-ConnectsDemand at cable landings and exchange points
Signal MonitoringTelemetry embedded in switching hardware.
Other ApplicationsQuantum and fiber-sensing use cases

Circuit Switching leads with a 38.5% share because reconfigurable optical paths sit at the heart of AI clusters and transport networks. Testing and Monitoring grows fastest at a 9.8% CAGR as operators automate network assurance and require switched access to many fibers for live testing. Cross-Connects and Multiplexing remain steady in subsea landing stations and metro rings.


Download PDF ×

We do not share your information with anyone. However, we may send you emails based on your report interest from time to time. You may contact us at any time to opt-out.