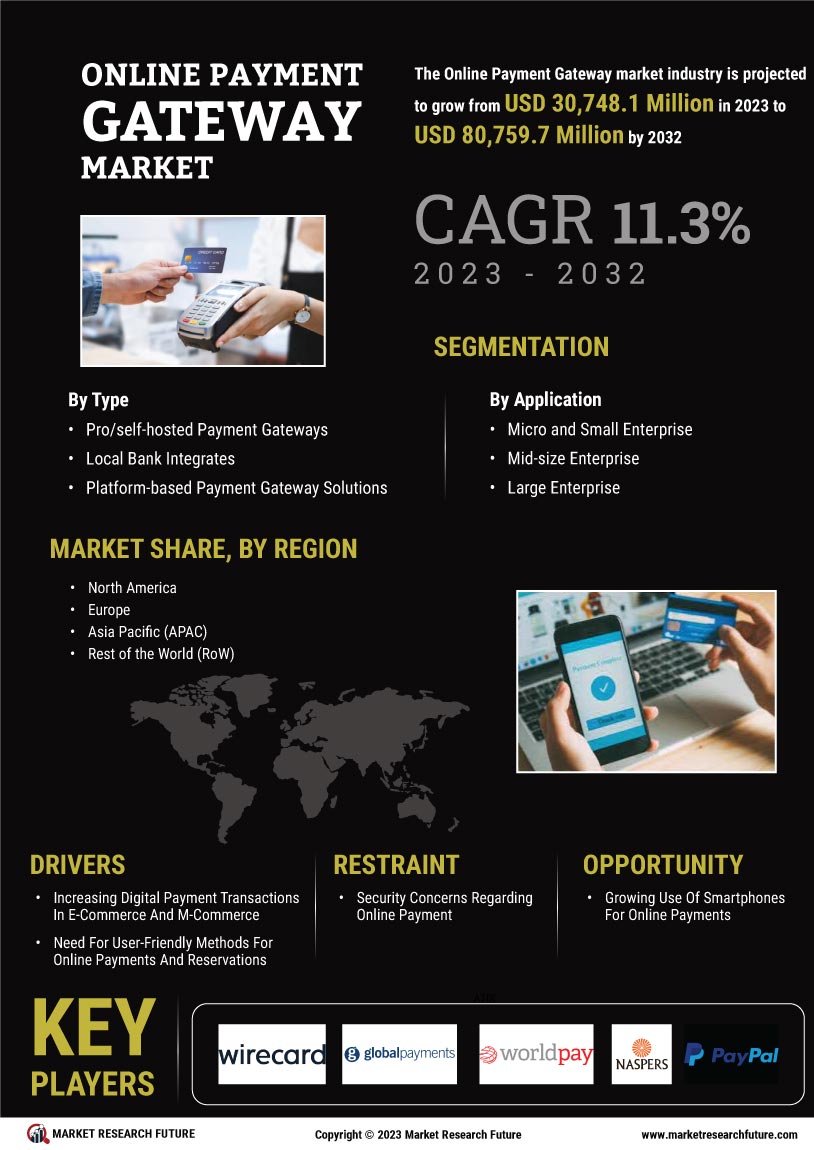
ID: MRFR/ICT/4886-CR | August, 2018 | Region : Global
1 Executive Summary
1.1 Prologue 14
2 Market Introduction
2.1 Definition 16
2.2 Scope Of The Study 16
2.3 List Of Assumptions 16
2.4 Market Structure 17
3 Research Methodology
3.1 Research Process 19
3.2 Primary Research 20
3.3 Secondary Research 21
3.4 Market Size Estimation 22
3.5 Forecast Model 22
4 Market Dynamics
4.1 Introduction 24
4.2 Drivers 25
4.2.1 Increasing Digital Payment Transactions In E-Commerce And M-Commerce 25
4.2.2 Need For User-Friendly Methods For Online Payments And Reservations 25
4.3 Restraint 25
4.3.1 Security Concerns Regarding Online Payment 25
4.4 Opportunities 27
4.4.1 Growing Use Of Smartphones For Online Payments 27
5 Market Factor Analysis
5.1 Value Chain Analysis 29
5.1.1 Payment Platform Developers 30
5.1.2 System Integrators 30
5.1.3 Service Providers 30
5.1.4 End-Users 30
5.2 Porter’s Five Forces Model 30
5.2.1 Threat Of New Entrants 31
5.2.2 Bargaining Power Of Suppliers 31
5.2.3 Bargaining Power Of Buyers 31
5.2.4 Threat Of Substitutes 31
5.2.5 Intensity Of Rivalry 31
6 Global Online Payment Gateway Market, By Type
6.1 Overview 33
6.1.1 Pro/Self-Hosted Payment Gateways 33
6.1.2 Local Bank Integrates 33
6.1.3 Platform-Based Payment Gateway Solution 33
6.1.4 Others 33
7 Global Online Payment Gateway Market, By Application
7.1 Overview 36
7.1.1 Micro And Small Enterprises 36
7.1.2 Large Enterprises 36
7.1.3 Mid-Size Enterprises 36
8 Global Online Payment Gateway Market, By Region
8.1 Introduction 39
8.1.1 North America 40
8.1.1.1 US 43
8.1.1.2 Canada 44
8.1.1.3 Mexico 45
8.1.2 Europe 46
8.1.2.1 UK 49
8.1.2.2 Germany 49
8.1.2.3 France 50
8.1.2.4 Italy 51
8.1.2.5 Rest Of Europe 52
8.1.3 Asia-Pacific 53
8.1.3.1 China 56
8.1.3.2 Japan 57
8.1.3.3 South Korea 57
8.1.3.4 India 58
8.1.3.5 Rest Of Asia-Pacific 59
8.1.4 Rest Of World 59
8.1.4.1 The Middle East & Africa 62
8.1.4.2 Latin America 63
9 Competitive Landscape
9.1 Competitive Landscape 65
10 Company Profiles
10.1 PayPal Holdings, Inc. 68
10.1.1 Company Overview 68
10.1.2 Financial Overview 68
10.1.3 Product/Solution Offerings 69
10.1.4 Key Developments 69
10.1.5 SWOT Analysis 70
10.1.6 Key Strategies 70
10.2 Stripe 71
10.2.1 Company Overview 71
10.2.2 Product/Solution Offerings 71
10.2.3 Key Developments 71
10.2.4 Key Strategy 71
10.3 Amazon.Com, Inc. 72
10.3.1 Company Overview 72
10.3.2 Financial Overview 72
10.3.3 Product/Solution Offerings 73
10.3.4 Key Developments 73
10.3.5 SWOT Analysis 73
10.3.6 Key Strategies 74
10.4 Visa, Inc. 75
10.4.1 Company Overview 75
10.4.2 Financial Overview 75
10.4.3 Product/Solution Offerings 76
10.4.4 Key Developments 76
10.4.5 SWOT Analysis 77
10.4.6 Key Strategies 77
10.5 Worldpay, Inc. 78
10.5.1 Company Overview 78
10.5.2 Product/Solution Offerings 78
10.5.3 Key Developments 78
10.5.4 SWOT Analysis 79
10.6 Adyen NV 80
10.6.1 Company Overview 80
10.6.2 Financial Overview 80
10.6.3 Product/Solution Offerings 81
10.6.4 Key Developments 81
10.6.5 SWOT Analysis 81
10.6.6 Key Strategy 81
10.7 CCBill, LLC 82
10.7.1 Company Overview 82
10.7.2 Product/Solution Offerings 82
10.8 2Checkout.Com, Inc. 83
10.8.1 Company Overview 83
10.8.2 Product/Solution Offerings 83
10.8.3 Key Developments 83
10.8.4 Key Strategy 84
10.9 First Data Corp. 85
10.9.1 Company Overview 85
10.9.2 Financial Overview 85
10.9.3 Product/Solution Offerings 86
10.9.4 Key Developments 86
10.9.5 SWOT Analysis 87
10.9.6 Key Strategy 87
10.10 SecurePay Pty Ltd. 88
10.10.1 Company Overview 88
10.10.2 Product/Solution Offerings 88
10.11 Naspers Ltd. 89
10.11.1 Company Overview 89
10.11.2 Financial Overview 90
10.11.3 Product/Solution Offerings 90
10.11.4 Key Developments 90
10.11.5 SWOT Analysis 91
10.11.6 Key Strategies 91
10.12 Verizon Communications, Inc. 92
10.12.1 Company Overview 92
10.12.2 Financial Overview 92
10.12.3 Product/Solution Offerings 93
10.12.4 SWOT Analysis 93
10.12.5 Key Strategy 93
10.13 GMO Payment Gateway, Inc. 94
10.13.1 Company Overview 94
10.13.2 Financial Overview 94
10.13.3 Product/Solution Offerings 95
10.14 Alibaba Group Holding Ltd. 96
10.14.1 Company Overview 96
10.14.2 Financial Overview 97
10.14.3 Product/Solution Offerings 97
10.14.4 Key Developments 98
10.14.5 SWOT Analysis 99
10.14.6 Key Strategies 99
10.15 Tencent Holdings Ltd. 100
10.15.1 Company Overview 100
10.15.2 Financial Overview 100
10.15.3 Product/Solution Offerings 101
10.15.4 SWOT Analysis 101
10.16 PagBrasil 102
10.16.1 Company Overview 102
10.16.2 Product/Solution Offerings 102
10.17 CASHU 103
10.17.1 Company Overview 103
10.17.2 Product/Solution Offerings 103
10.18 Wirecard AG 104
10.18.1 Company Overview 104
10.18.2 Financial Overview 104
10.18.3 Product/Solution Offerings 105
10.18.4 Key Developments 105
10.18.5 SWOT Analysis 105
10.18.6 Key Strategy 106
10.19 Global Payments, Inc. 107
10.19.1 Company Overview 107
10.19.2 Financial Overview 107
10.19.3 Product/Solution Offerings 108
10.19.4 Key Developments 108
10.19.5 SWOT Analysis 108
10.19.6 Key Strategy 108
11 List Of Tables
TABLE 1 LIST OF ASSUMPTIONS 16
TABLE 2 GLOBAL ONLINE PAYMENT GATEWAY MARKET, BY TYPE, 2020-2027 (USD MILLION) 34
TABLE 3 GLOBAL ONLINE PAYMENT GATEWAY MARKET, BY APPLICATION, 2020-2027 (USD MILLION) 37
TABLE 4 GLOBAL ONLINE PAYMENT GATEWAY MARKET, BY REGION, 2020-2027 (USD BILLION) 39
TABLE 5 GLOBAL ONLINE PAYMENT GATEWAY MARKET Y-O-Y GROWTH, BY REGION, 2020- 2027 (%) 39
TABLE 6 NORTH AMERICA: ONLINE PAYMENT GATEWAY MARKET, BY COUNTRY, 2020- 2027 (USD BILLION) 41
TABLE 7 NORTH AMERICA: ONLINE PAYMENT GATEWAY MARKET Y-O-Y GROWTH, BY COUNTRY, 2020-2027 (%) 41
TABLE 8 NORTH AMERICA: ONLINE PAYMENT GATEWAY MARKET, BY TYPE, 2020-2027 (USD MILLION) 42
TABLE 9 NORTH AMERICA: ONLINE PAYMENT GATEWAY MARKET, BY APPLICATION, 2020-2027 (USD MILLION) 43
TABLE 10 US: ONLINE PAYMENT GATEWAY MARKET, BY TYPE, 2020-2027 (USD MILLION) 43
TABLE 11 US: ONLINE PAYMENT GATEWAY MARKET, BY APPLICATION, 2020-2027 (USD MILLION) 44
TABLE 12 CANADA: ONLINE PAYMENT GATEWAY MARKET, BY TYPE, 2020-2027 (USD MILLION) 44
TABLE 13 CANADA: ONLINE PAYMENT GATEWAY MARKET, BY APPLICATION, 2020-2027 (USD MILLION) 44
TABLE 14 MEXICO: ONLINE PAYMENT GATEWAY MARKET, BY TYPE, 2020-2027 (USD MILLION) 45
TABLE 15 MEXICO: ONLINE PAYMENT GATEWAY MARKET, BY APPLICATION, 2020-2027 (USD MILLION) 45
TABLE 16 EUROPE: ONLINE PAYMENT GATEWAY MARKET, BY COUNTRY, 2020- 2027 (USD BILLION) 46
TABLE 17 EUROPE: ONLINE PAYMENT GATEWAY MARKET Y-O-Y GROWTH, BY COUNTRY, 2020-2027 (%) 47
TABLE 18 EUROPE: ONLINE PAYMENT GATEWAY MARKET, BY TYPE, 2020-2027 (USD MILLION) 48
TABLE 19 EUROPE ONLINE PAYMENT GATEWAY MARKET, BY APPLICATION, 2020-2027 (USD MILLION) 48
TABLE 20 UK: ONLINE PAYMENT GATEWAY MARKET, BY TYPE, 2020-2027 (USD MILLION) 49
TABLE 21 UK: ONLINE PAYMENT GATEWAY MARKET, BY APPLICATION, 2020-2027 (USD MILLION) 49
TABLE 22 GERMANY: ONLINE PAYMENT GATEWAY MARKET, BY TYPE, 2020-2027 (USD MILLION) 49
TABLE 23 GERMANY: ONLINE PAYMENT GATEWAY MARKET, BY APPLICATION, 2020-2027 (USD MILLION) 50
TABLE 24 FRANCE: ONLINE PAYMENT GATEWAY MARKET, BY TYPE, 2020-2027 (USD MILLION) 50
TABLE 25 FRANCE: ONLINE PAYMENT GATEWAY MARKET, BY APPLICATION, 2020-2027 (USD MILLION) 50
TABLE 26 ITALY: ONLINE PAYMENT GATEWAY MARKET, BY TYPE, 2020-2027 (USD MILLION) 51
TABLE 27 ITALY: ONLINE PAYMENT GATEWAY MARKET, BY APPLICATION, 2020-2027 (USD MILLION) 51
TABLE 28 REST OF EUROPE: ONLINE PAYMENT GATEWAY MARKET, BY TYPE, 2020-2027 (USD MILLION) 52
TABLE 29 REST OF EUROPE: ONLINE PAYMENT GATEWAY MARKET, BY APPLICATION, 2020-2027 (USD MILLION) 52
TABLE 30 ASIA-PACIFIC: ONLINE PAYMENT GATEWAY MARKET, BY COUNTRY, 2020- 2027 (USD BILLION) 53
TABLE 31 ASIA-PACIFIC: ONLINE PAYMENT GATEWAY MARKET Y-O-Y GROWTH, BY COUNTRY, 2020-2027 (%) 54
TABLE 32 ASIA-PACIFIC: ONLINE PAYMENT GATEWAY MARKET, BY TYPE, 2020-2027 (USD MILLION) 55
TABLE 33 ASIA-PACIFIC: ONLINE PAYMENT GATEWAY MARKET, BY APPLICATION, 2020-2027 (USD MILLION) 55
TABLE 34 CHINA: ONLINE PAYMENT GATEWAY MARKET, BY TYPE, 2020-2027 (USD MILLION) 56
TABLE 35 CHINA: ONLINE PAYMENT GATEWAY MARKET, BY APPLICATION, 2020-2027 (USD MILLION) 56
TABLE 36 JAPAN: ONLINE PAYMENT GATEWAY MARKET, BY TYPE, 2020-2027 (USD MILLION) 57
TABLE 37 JAPAN: ONLINE PAYMENT GATEWAY MARKET, BY APPLICATION, 2020-2027 (USD MILLION) 57
TABLE 38 SOUTH KOREA: ONLINE PAYMENT GATEWAY MARKET, BY TYPE, 2020-2027 (USD MILLION) 57
TABLE 39 SOUTH KOREA: ONLINE PAYMENT GATEWAY MARKET, BY APPLICATION, 2020-2027 (USD MILLION) 58
TABLE 40 INDIA: ONLINE PAYMENT GATEWAY MARKET, BY TYPE, 2020-2027 (USD MILLION) 58
TABLE 41 INDIA: ONLINE PAYMENT GATEWAY MARKET, BY APPLICATION, 2020-2027 (USD MILLION) 58
TABLE 42 REST OF ASIA-PACIFIC: ONLINE PAYMENT GATEWAY MARKET, BY TYPE, 2020-2027 (USD MILLION) 59
TABLE 43 REST OF ASIA-PACIFIC: ONLINE PAYMENT GATEWAY MARKET, BY APPLICATION, 2020-2027 (USD MILLION) 59
TABLE 44 REST OF WORLD: ONLINE PAYMENT GATEWAY MARKET, BY REGION, 2020- 2027 (USD BILLION) 60
TABLE 45 REST OF WORLD: ONLINE PAYMENT GATEWAY MARKET Y-O-Y GROWTH, BY REGION, 2020-2027 (%) 60
TABLE 46 REST OF WORLD: ONLINE PAYMENT GATEWAY MARKET, BY TYPE, 2020-2027 (USD MILLION) 61
TABLE 47 REST OF WORLD: ONLINE PAYMENT GATEWAY MARKET, BY APPLICATION, 2020-2027 (USD MILLION) 62
TABLE 48 THE MIDDLE EAST & AFRICA: ONLINE PAYMENT GATEWAY MARKET, BY TYPE, 2020-2027 (USD MILLION) 62
TABLE 49 THE MIDDLE EAST & AFRICA: ONLINE PAYMENT GATEWAY MARKET, BY APPLICATION, 2020-2027 (USD MILLION) 62
TABLE 50 LATIN AMERICA: ONLINE PAYMENT GATEWAY MARKET, BY TYPE, 2020-2027 (USD MILLION) 63
TABLE 51 LATIN AMERICA: ONLINE PAYMENT GATEWAY MARKET, BY APPLICATION, 2020-2027 (USD MILLION) 63
 
12 List Of Figures
TABLE 1 LIST OF ASSUMPTIONS 16
TABLE 2 GLOBAL ONLINE PAYMENT GATEWAY MARKET, BY TYPE, 2020-2027 (USD MILLION) 34
TABLE 3 GLOBAL ONLINE PAYMENT GATEWAY MARKET, BY APPLICATION, 2020-2027 (USD MILLION) 37
TABLE 4 GLOBAL ONLINE PAYMENT GATEWAY MARKET, BY REGION, 2020-2027 (USD BILLION) 39
TABLE 5 GLOBAL ONLINE PAYMENT GATEWAY MARKET Y-O-Y GROWTH, BY REGION, 2020- 2027 (%) 39
TABLE 6 NORTH AMERICA: ONLINE PAYMENT GATEWAY MARKET, BY COUNTRY, 2020- 2027 (USD BILLION) 41
TABLE 7 NORTH AMERICA: ONLINE PAYMENT GATEWAY MARKET Y-O-Y GROWTH, BY COUNTRY, 2020-2027 (%) 41
TABLE 8 NORTH AMERICA: ONLINE PAYMENT GATEWAY MARKET, BY TYPE, 2020-2027 (USD MILLION) 42
TABLE 9 NORTH AMERICA: ONLINE PAYMENT GATEWAY MARKET, BY APPLICATION, 2020-2027 (USD MILLION) 43
TABLE 10 US: ONLINE PAYMENT GATEWAY MARKET, BY TYPE, 2020-2027 (USD MILLION) 43
TABLE 11 US: ONLINE PAYMENT GATEWAY MARKET, BY APPLICATION, 2020-2027 (USD MILLION) 44
TABLE 12 CANADA: ONLINE PAYMENT GATEWAY MARKET, BY TYPE, 2020-2027 (USD MILLION) 44
TABLE 13 CANADA: ONLINE PAYMENT GATEWAY MARKET, BY APPLICATION, 2020-2027 (USD MILLION) 44
TABLE 14 MEXICO: ONLINE PAYMENT GATEWAY MARKET, BY TYPE, 2020-2027 (USD MILLION) 45
TABLE 15 MEXICO: ONLINE PAYMENT GATEWAY MARKET, BY APPLICATION, 2020-2027 (USD MILLION) 45
TABLE 16 EUROPE: ONLINE PAYMENT GATEWAY MARKET, BY COUNTRY, 2020- 2027 (USD BILLION) 46
TABLE 17 EUROPE: ONLINE PAYMENT GATEWAY MARKET Y-O-Y GROWTH, BY COUNTRY, 2020-2027 (%) 47
TABLE 18 EUROPE: ONLINE PAYMENT GATEWAY MARKET, BY TYPE, 2020-2027 (USD MILLION) 48
TABLE 19 EUROPE ONLINE PAYMENT GATEWAY MARKET, BY APPLICATION, 2020-2027 (USD MILLION) 48
TABLE 20 UK: ONLINE PAYMENT GATEWAY MARKET, BY TYPE, 2020-2027 (USD MILLION) 49
TABLE 21 UK: ONLINE PAYMENT GATEWAY MARKET, BY APPLICATION, 2020-2027 (USD MILLION) 49
TABLE 22 GERMANY: ONLINE PAYMENT GATEWAY MARKET, BY TYPE, 2020-2027 (USD MILLION) 49
TABLE 23 GERMANY: ONLINE PAYMENT GATEWAY MARKET, BY APPLICATION, 2020-2027 (USD MILLION) 50
TABLE 24 FRANCE: ONLINE PAYMENT GATEWAY MARKET, BY TYPE, 2020-2027 (USD MILLION) 50
TABLE 25 FRANCE: ONLINE PAYMENT GATEWAY MARKET, BY APPLICATION, 2020-2027 (USD MILLION) 50
TABLE 26 ITALY: ONLINE PAYMENT GATEWAY MARKET, BY TYPE, 2020-2027 (USD MILLION) 51
TABLE 27 ITALY: ONLINE PAYMENT GATEWAY MARKET, BY APPLICATION, 2020-2027 (USD MILLION) 51
TABLE 28 REST OF EUROPE: ONLINE PAYMENT GATEWAY MARKET, BY TYPE, 2020-2027 (USD MILLION) 52
TABLE 29 REST OF EUROPE: ONLINE PAYMENT GATEWAY MARKET, BY APPLICATION, 2020-2027 (USD MILLION) 52
TABLE 30 ASIA-PACIFIC: ONLINE PAYMENT GATEWAY MARKET, BY COUNTRY, 2020- 2027 (USD BILLION) 53
TABLE 31 ASIA-PACIFIC: ONLINE PAYMENT GATEWAY MARKET Y-O-Y GROWTH, BY COUNTRY, 2020-2027 (%) 54
TABLE 32 ASIA-PACIFIC: ONLINE PAYMENT GATEWAY MARKET, BY TYPE, 2020-2027 (USD MILLION) 55
TABLE 33 ASIA-PACIFIC: ONLINE PAYMENT GATEWAY MARKET, BY APPLICATION, 2020-2027 (USD MILLION) 55
TABLE 34 CHINA: ONLINE PAYMENT GATEWAY MARKET, BY TYPE, 2020-2027 (USD MILLION) 56
TABLE 35 CHINA: ONLINE PAYMENT GATEWAY MARKET, BY APPLICATION, 2020-2027 (USD MILLION) 56
TABLE 36 JAPAN: ONLINE PAYMENT GATEWAY MARKET, BY TYPE, 2020-2027 (USD MILLION) 57
TABLE 37 JAPAN: ONLINE PAYMENT GATEWAY MARKET, BY APPLICATION, 2020-2027 (USD MILLION) 57
TABLE 38 SOUTH KOREA: ONLINE PAYMENT GATEWAY MARKET, BY TYPE, 2020-2027 (USD MILLION) 57
TABLE 39 SOUTH KOREA: ONLINE PAYMENT GATEWAY MARKET, BY APPLICATION, 2020-2027 (USD MILLION) 58
TABLE 40 INDIA: ONLINE PAYMENT GATEWAY MARKET, BY TYPE, 2020-2027 (USD MILLION) 58
TABLE 41 INDIA: ONLINE PAYMENT GATEWAY MARKET, BY APPLICATION, 2020-2027 (USD MILLION) 58
TABLE 42 REST OF ASIA-PACIFIC: ONLINE PAYMENT GATEWAY MARKET, BY TYPE, 2020-2027 (USD MILLION) 59
TABLE 43 REST OF ASIA-PACIFIC: ONLINE PAYMENT GATEWAY MARKET, BY APPLICATION, 2020-2027 (USD MILLION) 59
TABLE 44 REST OF WORLD: ONLINE PAYMENT GATEWAY MARKET, BY REGION, 2020- 2027 (USD BILLION) 60
TABLE 45 REST OF WORLD: ONLINE PAYMENT GATEWAY MARKET Y-O-Y GROWTH, BY REGION, 2020-2027 (%) 60
TABLE 46 REST OF WORLD: ONLINE PAYMENT GATEWAY MARKET, BY TYPE, 2020-2027 (USD MILLION) 61
TABLE 47 REST OF WORLD: ONLINE PAYMENT GATEWAY MARKET, BY APPLICATION, 2020-2027 (USD MILLION) 62
TABLE 48 THE MIDDLE EAST & AFRICA: ONLINE PAYMENT GATEWAY MARKET, BY TYPE, 2020-2027 (USD MILLION) 62
TABLE 49 THE MIDDLE EAST & AFRICA: ONLINE PAYMENT GATEWAY MARKET, BY APPLICATION, 2020-2027 (USD MILLION) 62
TABLE 50 LATIN AMERICA: ONLINE PAYMENT GATEWAY MARKET, BY TYPE, 2020-2027 (USD MILLION) 63
TABLE 51 LATIN AMERICA: ONLINE PAYMENT GATEWAY MARKET, BY APPLICATION, 2020-2027 (USD MILLION) 63
$193.27 Billion
10.18%
North America
2020-2030
Growing use of smartphones for online payments is driving the online payment gateway market creating a highly competitive landscape.
The global online payment gateway ecosystem consists of various global, regional, and local service providers that are continuously evolving to enhance their market position. Intense competition and rapid advances in technology to cope with the security concerns are key factors that aid the market growth. The service providers compete based on cost, efficiency, security, and reliability of the services to sustain in the market. It is important for the service providers to provide a cost-efficient and secure online payment gateway, to maintain their market position and gain a competitive advantage.
Vendors in the online payment gateway market are focusing towards improving their services and expanding geographically into the under-developed and developing economies. PayPal Holdings, Inc., Visa, Inc., First Data Corp., Naspers Ltd., and Global Payments, Inc. are the major companies in the market, competing in terms of customization, reliability, price, and technology. Their primary focus is on the development of improved online payment gateways for faster and secure transaction processes. Although international players are dominating the market, regional and foreign players such as PagBrasil and CASHU with small market shares also have a prominent presence here. The major players may strengthen their presence worldwide through the acquisition of local and regional players for expanding their services in those regions during the forecast period. The improvement of the global economic scenario combined with technological advancement in the emerging economies like Brazil, Argentina, and other under-developed countries, is likely to fuel the market growth, thereby making it an ideal time to expand online payment gateway market geographically and increase the global market share.
PayPal Holdings, Inc. is one of the prominent players in the online payment gateway market, holding 9.57% share. PayPal provides businesses with a platform enabling various payment methods for transactions. This has enabled PayPal to gain a competitive advantage in the online payment market in terms of service and user accessibility, and hence, is leading the online payment gateway market. Moreover, PayPal focuses on expanding its market reach by partnering with local banks and attracting customers to use their services. PayPal has also started offering customers with attractive offers such as cashback, using advertisements on different media platforms.
Visa, Inc. held a share of 8.66% in 2017. Visa is completely into commerce and has a huge network of consumers, merchants, financial institutions, businesses, strategic partners, and government entities. To provide its customers with an efficient online payment platform, the company has acquired Authorize.Net, a payment gateway that allows e-commerce providers to accept payments through credit cards and electronic checks directly on their site.
First Data Corp. held a share of 7.44% in 2017. First Data’s strategic acquisitions have enabled the expansion of its market reach to the countries of the Asia-Pacific region. Moreover, partnerships with e-commerce companies have provided First Data with a network full of retailers and financial institutions, enabling it to penetrate the online payment gateway market.
Naspers Ltd. held a share of 5.5% in 2017. Naspers acquired PayU to provide its users with a secure, anti-fraud payment platform. Recently, PayU launched a new platform, PayUnow, for small and medium businesses (SMBs). This new platform is expected to enable offline businesses to create an online identity with their own business page, where they can accept digital payments directly into their bank accounts.
Global Payments, Inc. held a share of 5.09% in 2017, providing its services across a variety of channels to merchants and partners in countries across the Americas, Europe, and Asia-Pacific. Acquisition of Realex Payments, one of Europe's largest and fastest growing payment gateways, has enabled Global Payments to provide omnichannel solutions that combine gateway services, payment service provisioning, and merchant acquiring across Europe.
The service providers with better technical and financial resources focus on innovation to develop highly secure payment platforms that enable users with easy-to-understand interface to stay competitive in the market. Therefore, service providers must innovate and make use of new technologies to stay abreast of the emerging technologies that could affect the continuing competitiveness of their services in the market.