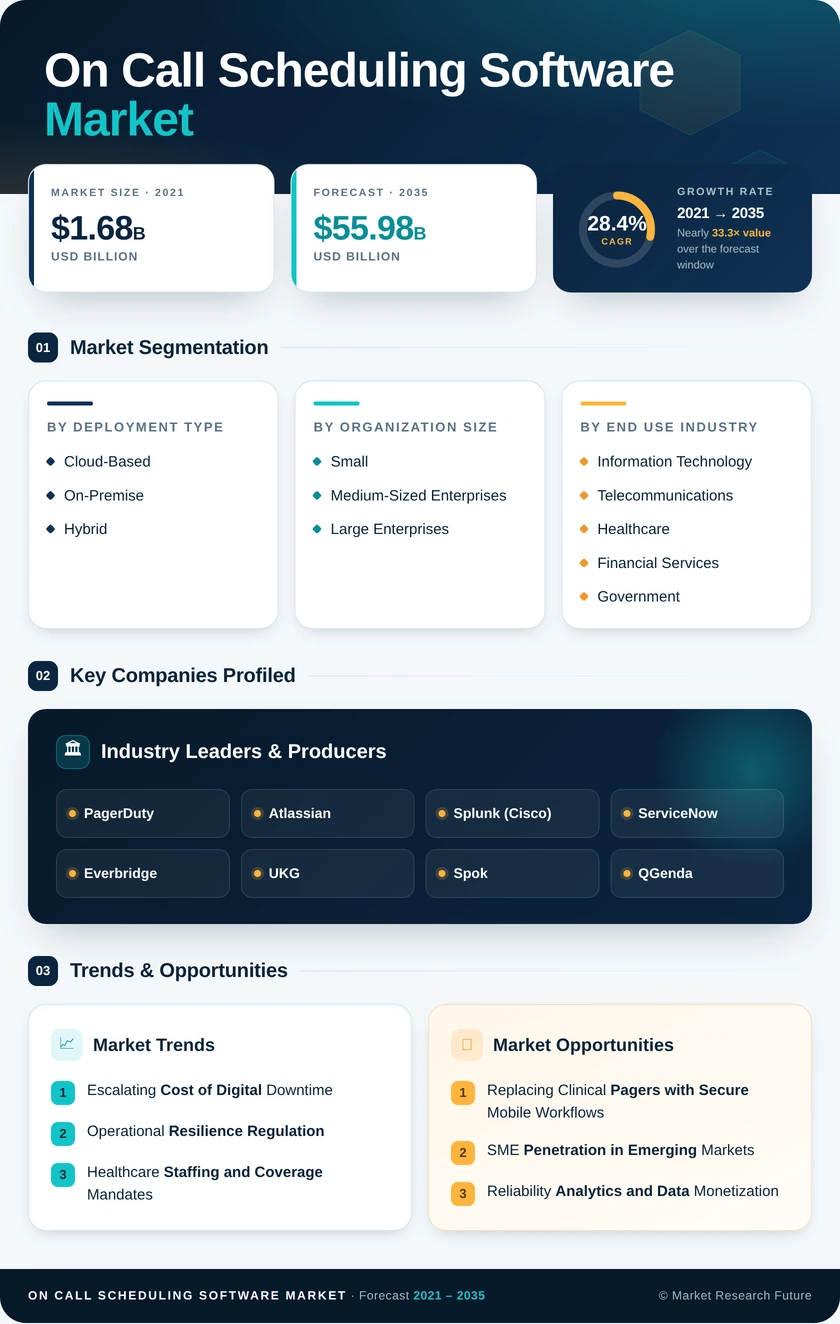
On Call Scheduling Software Market (2026 - 2035)

ID: MRFR/ICT/39406-HCR 100 Pages Nirmit Biswas Last Updated: October 21, 2026
On Call Scheduling Software Market Size, Share and Research Report: By Deployment Model (Cloud-based, On-premises), By Functionality (Scheduling, Time Tracking, Employee Management, Communication, Reporting), By Industry Vertical (Healthcare, Retail, Hospitality, Manufacturing, IT), By Company Size (Small and Medium-Sized Enterprises (SMEs), Large Enterprises), By Pricing Model (Subscription, Per-user, Tiered) and By Regional (North America, Europe, South America, Asia Pacific, Middle East and Africa) - Industry Forecast to 2035
On Call Scheduling Software Market
Market Size
Forecast Period2026-2035
CAGR (2026-2035)28.4%
2025 Market SizeUSD 4.52 Billion
2035 Market SizeUSD 55.98 Billion
Key Players
PagerDuty
Atlassian
Splunk
ServiceNow
Everbridge
UKG
Opportunities
  • Replacing Clinical Pagers with Secure Mobile Workflows
  • SME Penetration in Emerging Markets
  • Reliability Analytics and Data Monetization
  1. 1 Market Summary | |
  2. 2 Key Report Takeaways | |
    1. 2.1 By Deployment Type | |
    2. 2.2 By Organization Size | |
    3. 2.3 By End Use Industry | |
    4. 2.4 By Application | |
    5. 2.5 By Region | |
  3. 3 Market Size and Forecast (2021–2035) | |
    1. 3.1 Historical Market Size (2021–2025) | |
    2. 3.2 Forecast Market Size (2026–2035) | |
    3. 3.3 Year-over-Year Growth Analysis | |
  4. 4 Driver Impact Analysis | |
    1. 4.1 Escalating Cost of Digital Downtime | |
    2. 4.2 Operational Resilience Regulation | |
    3. 4.3 Healthcare Staffing and Coverage Mandates | |
    4. 4.4 AI-Driven Triage and Automated Escalation | |
    5. 4.5 Cloud-Native and Multicloud Complexity | |
    6. 4.6 SME Adoption via Subscription Pricing | |
  5. 5 Restraints Impact Analysis | |
    1. 5.1 Alert Fatigue and Responder Burnout | |
    2. 5.2 Data Residency and Security Concerns | |
    3. 5.3 Integration Complexity with Legacy Systems | |
    4. 5.4 Platform Bundling and Price Compression | |
    5. 5.5 Labor Rules on Standby Time | |
  6. 6 Opportunities | |
    1. 6.1 Replacing Clinical Pagers with Secure Mobile Workflows | |
    2. 6.2 SME Penetration in Emerging Markets | |
    3. 6.3 Reliability Analytics and Data Monetization | |
    4. 6.4 Field Service and Operational Technology Convergence | |
  7. 7 Regional Market Share and Country-Level Analysis | |
    1. 7.1 North America | | |
      1. 7.1.1 US | | |
      2. 7.1.2 Canada | | |
      3. 7.1.3 Mexico | |
    2. 7.2 Europe | | |
      1. 7.2.1 Germany | | |
      2. 7.2.2 UK | | |
      3. 7.2.3 France | | |
      4. 7.2.4 Italy | | |
      5. 7.2.5 Spain | | |
      6. 7.2.6 Nordic Countries | | |
      7. 7.2.7 Russia | | |
      8. 7.2.8 Rest of Europe | |
    3. 7.3 Asia-Pacific | | |
      1. 7.3.1 China | | |
      2. 7.3.2 India | | |
      3. 7.3.3 Japan | | |
      4. 7.3.4 South Korea | | |
      5. 7.3.5 ASEAN | | |
      6. 7.3.6 Rest of Asia-Pacific | |
    4. 7.4 South America | | |
      1. 7.4.1 Brazil | | |
      2. 7.4.2 Argentina | | |
      3. 7.4.3 Rest of South America | |
    5. 7.5 Middle East & Africa | | |
      1. 7.5.1 Saudi Arabia | | |
      2. 7.5.2 UAE | | |
      3. 7.5.3 South Africa | | |
      4. 7.5.4 Egypt | | |
      5. 7.5.5 Rest of MEA | |
  8. 8 Future Outlook (2026–2035) | |
    1. 8.1 Agentic Incident Operations | |
    2. 8.2 Platform Consolidation and Suite Economics | |
    3. 8.3 Resilience Regulation as a Permanent Baseline | |
    4. 8.4 Responder Wellbeing and Social Disclosure | |
  9. 9 Segmentation Analysis | |
    1. 9.1 By Deployment Type | | |
      1. 9.1.1 Cloud-Based | | |
      2. 9.1.2 On-Premise | | |
      3. 9.1.3 Hybrid | |
    2. 9.2 By Organization Size | | |
      1. 9.2.1 Small and Medium-Sized Enterprises | | |
      2. 9.2.2 Large Enterprises | |
    3. 9.3 By End Use Industry | | |
      1. 9.3.1 Information Technology and Telecommunications | | |
      2. 9.3.2 Healthcare | | |
      3. 9.3.3 Financial Services | | |
      4. 9.3.4 Government and Public Sector | | |
      5. 9.3.5 Manufacturing | | |
      6. 9.3.6 Public Safety and Emergency Services | | |
      7. 9.3.7 Energy and Utilities | | |
      8. 9.3.8 Others | |
    4. 9.4 By Application | | |
      1. 9.4.1 Incident Response Management | | |
      2. 9.4.2 Employee Scheduling | | |
      3. 9.4.3 Shift Planning and Rostering | | |
      4. 9.4.4 DevOps and Continuous Delivery | | |
      5. 9.4.5 Field Service Management | | |
      6. 9.4.6 Others | |
  10. 10 Competitive Landscape | |
    1. 10.1 Market Concentration Analysis | |
    2. 10.2 Competitive Benchmarking Matrix | |
    3. 10.3 Company Profiles | | |
      1. 10.3.1 PagerDuty | | |
      2. 10.3.2 Atlassian | | |
      3. 10.3.3 Splunk (Cisco) | | |
      4. 10.3.4 ServiceNow | | |
      5. 10.3.5 Everbridge | | |
      6. 10.3.6 UKG | | |
      7. 10.3.7 Spok | | |
      8. 10.3.8 QGenda | | |
      9. 10.3.9 PerfectServe | | |
      10. 10.3.10 incident.io | |
  11. 11 Recent News & Developments | |
  12. 12 Report Scope and Methodology | |
  13. 13 Detailed Sources and Citations | |
  14. 14 Frequently Asked Questions (FAQs) | | LIST OF TABLES | |
  15. TABLE 1 Global Market Snapshot, 2025–2035 | |
  16. TABLE 2 Global Market Size & Forecast, by Revenue (USD Billion), 2021–2035 | |
  17. TABLE 3 Driver Impact Analysis | |
  18. TABLE 4 Restraints Impact Analysis | |
  19. TABLE 5 Regional Summary, 2025 | |
  20. TABLE 6 North America Market, by Country, 2025 | |
  21. TABLE 7 Europe Market, by Country, 2025 | |
  22. TABLE 8 Asia-Pacific Market, by Country, 2025 | |
  23. TABLE 9 South America Market, by Country, 2025 | |
  24. TABLE 10 Middle East & Africa Market, by Country, 2025 | |
  25. TABLE 11 Global Market, by Deployment Type, 2025 | |
  26. TABLE 12 Global Market, by Organization Size, 2025 | |
  27. TABLE 13 Global Market, by End Use Industry, 2025 | |
  28. TABLE 14 Global Market, by Application, 2025 | |
  29. TABLE 15 Competitive Benchmarking Matrix | |
  30. TABLE 16 Report Scope and Methodology | |
  31. TABLE 17 Detailed Sources and Citations | |
  32. TABLE 18 Segmentation Quick Reference | |
  33. TABLE 19 Deployment Type Sub-Segment Trends | |
  34. TABLE 20 Organization Size Sub-Segment Trends | |
  35. TABLE 21 End Use Industry Sub-Segment Trends | |
  36. TABLE 22 Application Sub-Segment Trends | | LIST OF FIGURES | |
  37. FIGURE 1 Market Dynamics Overview (Drivers, Restraints, Opportunities) | |
  38. FIGURE 2 Industry Value Chain Analysis | |
  39. FIGURE 3 Porter's Five Forces Analysis | |
  40. FIGURE 4 Global Market Size Trend, 2021–2035 (USD Billion) | |
  41. FIGURE 5 Year-over-Year Growth Rate, 2022–2035 | |
  42. FIGURE 6 Market Share by Deployment Type, 2025 | |
  43. FIGURE 7 Market Share by Organization Size, 2025 | |
  44. FIGURE 8 Market Share by End Use Industry, 2025 | |
  45. FIGURE 9 Market Share by Application, 2025 | |
  46. FIGURE 10 Regional Market Share, 2025 | |
  47. FIGURE 11 Regional Growth Comparison, 2026–2035 | |
  48. FIGURE 12 Country-Level Opportunity Map | |
  49. FIGURE 13 Competitive Landscape Positioning Matrix | |
  50. FIGURE 14 Estimated Vendor Revenue Share Ranges

Segmentation Quick Reference

Dimension Sub-Segments Dominant Segment Fastest Growing Segment
By Deployment Type Cloud-Based; On-Premise; Hybrid Cloud-Based (64.6% share) Hybrid (33.1% CAGR)
By Organization Size Small and Medium-Sized Enterprises; Large Enterprises Large Enterprises (57.9% share) Small and Medium-Sized Enterprises (32.9% CAGR)
By End Use Industry Information Technology and Telecommunications; Healthcare; Financial Services; Government and Public Sector; Manufacturing; Others Information Technology and Telecommunications (34.1% share) Healthcare (34.0% CAGR)
By Application Incident Response Management; Employee Scheduling; Shift Planning and Rostering; DevOps and Continuous Delivery; Field Service Management; Others Incident Response Management (40.3% share) DevOps and Continuous Delivery (32.7% CAGR)
By Region North America; Europe; Asia-Pacific; South America; Middle East & Africa North America (39.8% share) Asia-Pacific (32.6% CAGR)


Market Segmentation Overview

By Deployment Type

Sub-Segment Key Trend
Cloud-Based Rolling AI module releases and instant onboarding
On-Premise Retained by defense and air-gapped industrial sites
Hybrid Split-plane architectures for data-localization compliance


Cloud-Based deployments lead because SaaS removes infrastructure upkeep and delivers new triage features continuously. Hybrid grows fastest as banks and cross-border firms keep incident logs on-premises to satisfy residency rules while running analytics in the cloud. On-Premise remains a niche for environments that block outbound connections entirely.

By Organization Size

Sub-Segment Key Trend
Small and Medium-Sized Enterprises Pay-as-you-grow tiers and chat-based setup
Large Enterprises Skill-based routing and deep ITSM integration


Large Enterprises dominate spending because their rotations span hundreds of services and require integration with many monitoring and ticketing tools. Small and Medium-Sized Enterprises grow faster as templated escalation policies and low per-user pricing let small operations teams adopt formal rotations without administrators.

By End Use Industry

Sub-Segment Key Trend
Information Technology and Telecommunications Pipeline-linked incident queues
Healthcare Clinical paging replacement and staffing compliance
Financial Services DORA and SEC-driven audit trails
Government and Public Sector National cyber control adoption
Manufacturing OT alerting tied to maintenance crews
Others Retail and energy uptime programs


Information Technology and Telecommunications leads because every software release is an implicit reliability test that needs a named responder. Healthcare grows fastest as staffing laws and proposed HIPAA restoration deadlines force hospitals to document coverage. Financial Services adds high-value demand where regulators treat response logs as supervisory evidence.

By Application

Sub-Segment Key Trend
Incident Response Management Multi-channel alerting and escalation loops
Employee Scheduling Automated rota creation across teams
Shift Planning and Rostering Fair rotation and rest-period enforcement
DevOps and Continuous Delivery CI/CD-triggered owner assignment and rollbacks
Field Service Management Mobile crews acting on digital triage data
Others Security operations and facilities coverage


Incident Response Management remains the largest application, built on alerting, escalation and post-incident reporting. DevOps and Continuous Delivery grows fastest because rotation triggers now sit inside deployment pipelines, assigning hotfix owners automatically. Field Service Management is widening the category as physical repair work links to the same incident consoles.


Download PDF ×

We do not share your information with anyone. However, we may send you emails based on your report interest from time to time. You may contact us at any time to opt-out.