ID: MRFR/F-B & N/6479-HCR | February 2021 | Region: Global | 90 pages
Market Scenario
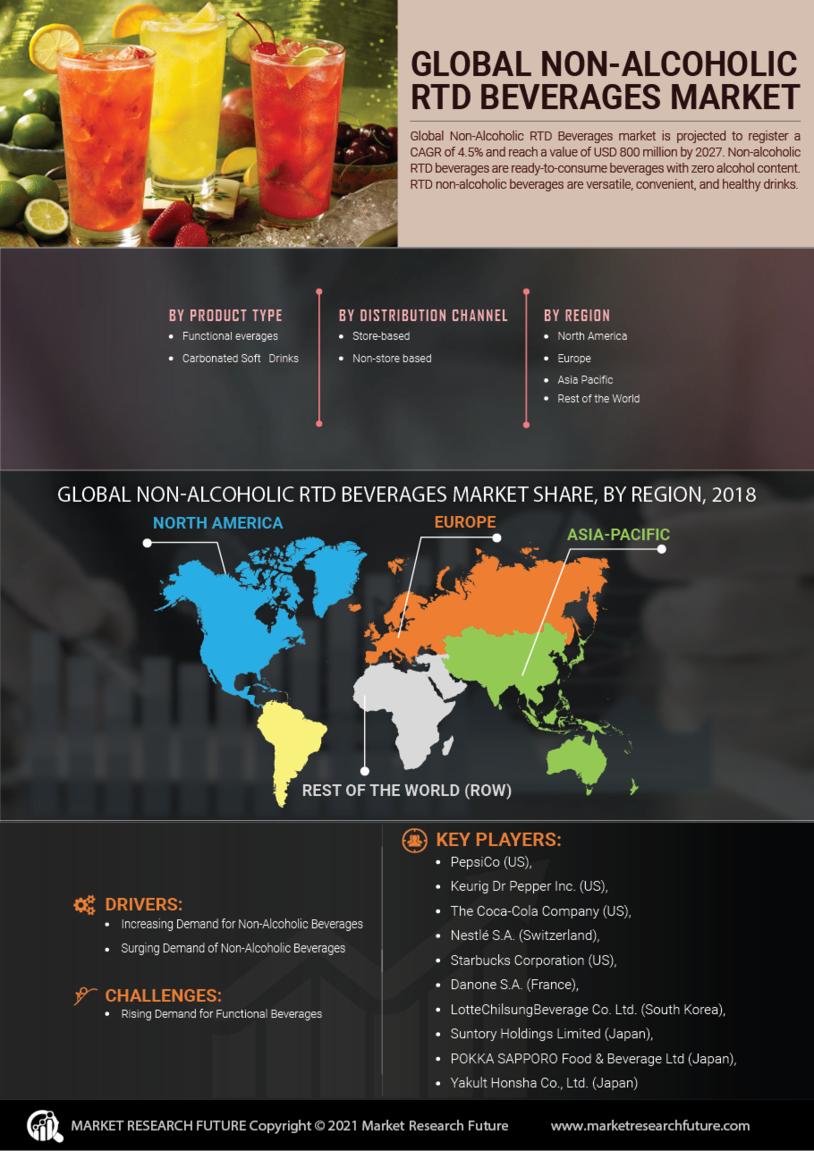
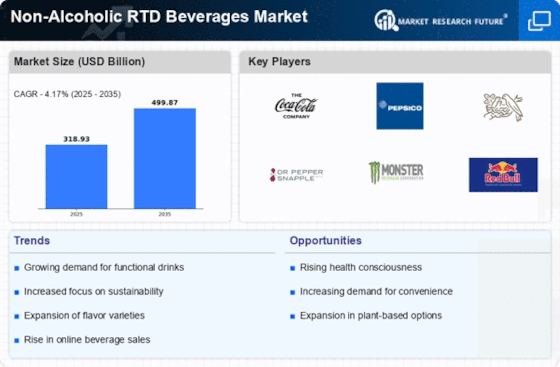
Non-alcoholic RTD beverages are ready-to-consume beverages with zero alcohol content. Global Non-Alcoholic RTD Beverages Market is expected to register a growth rate of 4.5% during the forecast period. The market is expected to garner a value of approximately USD 800 Billion by the end of 2024. RTD non-alcoholic beverages are versatile, convenient and healthy drinks. The increasing demand for ready to drink mixed beverages, ready to drink protein beverages, and ready to drink mocktails is driving the growth of the global non-alcoholic RTD beverages market. Additionally, certain market players are positioning non-alcoholic RTD beverages as healthy drinks, owing to which these beverages are gaining acceptance.
Fluctuating prices of raw materials such as fruits, vegetables, milk, and grains are creating hurdles to the growth of several vendors active in the market. Though the overall non-alcoholic RTD beverages market is witnessing significant growth, the market segments are experiencing a decline. For instance, consumers are shifting toward natural and healthy plant-based juices, which is hampering the growth of the carbonated soft drinks market. However, the launch of innovative and exotic flavors is expected to pave the way for lucrative opportunities in the market.
Segmentation
The global non-alcoholic RTD beverages market has been segmented based on type, packaging type, distribution channel, and region.
By type, the global market has been classified as functional beverages, carbonated soft drinks, tea and coffee, fruit and vegetable juices, flavored and fortified water, dairy-based beverages, and others. The functional beverages segment has further been classified into sports/energy drinks, probiotic and prebiotic drinks, and others. The carbonated soft drinks segment is expected to dominate the global market during the review period. However, the fruit and vegetable juices segment is expected to register the highest CAGR during the forecast period.
The global non-alcoholic RTD beverages market has been segregated, on the basis of packaging type, into bottles, cans, cartons, and others. In 2018, the bottles segment accounted for the largest revenue share of the global market. However, the cans segment is expected to register the highest growth rate during the forecast period.
Based on distribution channel, the global non-alcoholic RTD beverages market has been categorized as store-based and non-store-based. The store-based segment has further been divided into supermarkets and hypermarkets, convenience stores, and others. The store-based segment is expected to account for the larger revenue share of the market while the non-store-based segment is expected to exhibit the higher growth rate from 2019 to 2024.
The global non-alcoholic RTD beverages market has been studied with regard to four key regions—North America, Europe, Asia-Pacific, and the rest of the world.
The North American non-alcoholic RTD beverages industry has further been segmented into the US, Canada, and Mexico. The European non-alcoholic RTD beverages industry has been classified as the UK, Germany, France, Italy, Spain, and the rest of Europe. The non-alcoholic RTD beverages industry in Asia-Pacific has been divided into China, India, Japan, Australia and New Zealand, and the rest of Asia-Pacific. The non-alcoholic RTD beverages industry in the rest of the world has been segmented into South America, the Middle East, and Africa.
Key Players
PepsiCo (US), Lotte Chilsung Beverage Co. Ltd (South Korea), Keurig Dr Pepper Inc. (US), The Republic of Tea (US), The Coca-Cola Company (US), Ting Hsin International Group (Taiwan), Nestlé S.A. (Switzerland), Suntory Holdings Limited (Japan), POKKA SAPPORO Food & Beverage Ltd. (Japan), Starbucks Corporation (US), Monster Energy (US), DRY Soda Company (US), Yakult Honsha Co., Ltd. (Japan), Danone S.A. (France), and Big Easy Blends, LLC (US) are some of the key players in the global non-alcoholic RTD beverages market.
Regional Market Summary
Global Non-Alcoholic RTD Beverages Market Share (%), by Region, 2018
Source: Secondary Sources and MRFR Analysis
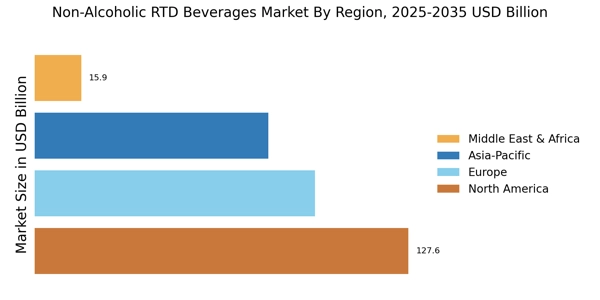
North America is expected to account for the largest revenue share of the global non-alcoholic RTD beverages market during the research period due to continuous product innovation and increasing investments by players in the region. However, the Asia-Pacific non-alcoholic RTD beverages market is expected to register the highest CAGR during the forecast period due to the changing lifestyle and increasing disposable incomes of consumers. Moreover, the launch of innovative flavors in the regional market is boosting the regional market growth.
Global Non-Alcoholic RTD Beverages Market, by Type
Global Non-Alcoholic RTD Beverages Market, by Packaging Type
Global Non-Alcoholic RTD Beverages Market, by Distribution Channel
Global Non-Alcoholic RTD Beverages Market, by Region
Intended Audience
Table of Contents
1 Executive Summary
2 Scope of the Report
2.1 Market Definition
2.2 Scope of the Study
2.2.1 Research Objectives
2.2.2 Assumptions & Limitations
2.3 Market Structure
3 Market Research Methodology
3.1 Research Process
3.2 Secondary Research
3.3 Primary Research
3.4 Forecast Model
4 Market Landscape
4.1 Supply Chain Analysis
4.1.1 Raw Material Suppliers
4.1.2 Manufacturers/Producers
4.1.3 Distributors/Retailers/Wholesalers/E-Commerce
4.1.4 End Users
4.2 Porter’s Five Forces Analysis
4.2.1 Threat of New Entrants
4.2.2 Bargaining Power of Buyers
4.2.3 Bargaining Power of Suppliers
4.2.4 Threat of Substitutes
4.2.5 Rivalry
5 Market Dynamics of the Global Non-Alcoholic RTD Beverages Market
5.1 Introduction
5.2 Drivers
5.3 Restraints
5.4 Opportunities
5.5 Challenges
6. Global Non-Alcoholic RTD Beverages Market, by Type
6.1 Introduction
6.2 Functional Beverages
6.2.1 Market Estimates & Forecast, 2019–2024
6.2.2 Market Estimates & Forecast, by Region, 2019–2024
6.2.3 Sports/Energy Drinks
6.2.3.1 Market Estimates & Forecast, 2019–2024
6.2.3.2 Market Estimates & Forecast, by Region, 2019–2024
6.2.4 Probiotic & Prebiotic Drinks
6.2.4.1 Market Estimates & Forecast, 2019–2024
6.2.4.2 Market Estimates & Forecast, by Region, 2019–2024
6.2.5 Others
6.2.5.1 Market Estimates & Forecast, 2019–2024
6.2.5.2 Market Estimates & Forecast, by Region, 2019–2024
6.3 Carbonated Soft Drinks
6.3.1 Market Estimates & Forecast, 2019–2024
6.3.2 Market Estimates & Forecast, by Region, 2019–2024
6.4 Tea & Coffee
6.4.1 Market Estimates & Forecast, 2019–2024
6.4.2 Market Estimates & Forecast, by Region, 2019–2024
6.5 Fruit & Vegetable Juices
6.5.1 Market Estimates & Forecast, 2019–2024
6.5.2 Market Estimates & Forecast, by Region, 2019–2024
6.6 Flavored & Fortified Water
6.6.1 Market Estimates & Forecast, 2019–2024
6.6.2 Market Estimates & Forecast, by Region, 2019–2024
6.7 Dairy-Based Products
6.7.1 Market Estimates & Forecast, 2019–2024
6.7.2 Market Estimates & Forecast, by Region, 2019–2024
6.8 Others
6.8.1 Market Estimates & Forecast, 2019–2024
6.8.2 Market Estimates & Forecast, by Region, 2019–2024
7. Global Non-Alcoholic RTD Beverages Market, by Packaging Type
7.1 Introduction
7.2 Bottles
7.2.1 Market Estimates & Forecast, 2019–2024
7.2.2 Market Estimates & Forecast, by Region, 2019–2024
7.3 Cans
7.3.1 Market Estimates & Forecast, 2019–2024
7.3.2 Market Estimates & Forecast, by Region, 2019–2024
7.4 Cartons
7.4.1 Market Estimates & Forecast, 2019–2024
7.4.2 Market Estimates & Forecast, by Region, 2019–2024
7.5 Others
7.5.1 Market Estimates & Forecast, 2019–2024
7.5.2 Market Estimates & Forecast, by Region, 2019–2024
8. Global Non-Alcoholic RTD Beverages Market, by Distribution Channel
8.1 Introduction
8.2 Store-Based
8.2.1 Market Estimates & Forecast, 2019–2024
8.2.2 Market Estimates & Forecast, by Region, 2019–2024
8.2.3 Supermarkets & Hypermarkets
8.2.3.1 Market Estimates & Forecast, by Region, 2019–2024
8.2.4 Convenience Stores
8.2.4.1 Market Estimates & Forecast, by Region, 2019–2024
8.2.5 Others
8.2.5.1 Market Estimates & Forecast, by Region, 2019–2024
8.3 Non-Store-Based
8.3.1 Market Estimates & Forecast, 2019–2024
8.3.2 Market Estimates & Forecast, by Region, 2019–2024
9. Global Non-Alcoholic RTD Beverages Market, by Region
9.1 Introduction
9.2 North America
9.2.1 Market Estimates & Forecast, 2019–2024
9.2.2 Market Estimates & Forecast, by Type, 2019–2024
9.2.3 Market Estimates & Forecast, by Packaging Type, 2019–2024
9.2.4 Market Estimates & Forecast, by Distribution Channel, 2019–2024
9.2.5 US
9.2.5.1 Market Estimates & Forecast, 2019–2024
9.2.5.2 Market Estimates & Forecast, by Type, 2019–2024
9.2.5.3 Market Estimates & Forecast, by Packaging Type, 2019–2024
9.2.5.4 Market Estimates & Forecast, by Distribution Channel, 2019–2024
9.2.6 Canada
9.2.6.1 Market Estimates & Forecast, 2019–2024
9.2.6.2 Market Estimates & Forecast, by Type, 2019–2024
9.2.6.3 Market Estimates & Forecast, by Packaging Type, 2019–2024
9.2.6.4 Market Estimates & Forecast, by Distribution Channel, 2019–2024
9.2.7 Mexico
9.2.7.1 Market Estimates & Forecast, 2019–2024
9.2.7.2 Market Estimates & Forecast, by Type, 2019–2024
9.2.7.3 Market Estimates & Forecast, by Packaging Type, 2019–2024
9.2.7.4 Market Estimates & Forecast, by Distribution Channel, 2019–2024
9.3 Europe
9.3.1 Market Estimates & Forecast, 2019–2024
9.3.2 Market Estimates & Forecast, by Type, 2019–2024
9.3.3 Market Estimates & Forecast, by Packaging Type, 2019–2024
9.3.4 Market Estimates & Forecast, by Distribution Channel, 2019–2024
9.3.5 Germany
9.3.5.1 Market Estimates & Forecast, 2019–2024
9.3.5.2 Market Estimates & Forecast, by Type, 2019–2024
9.3.5.3 Market Estimates & Forecast, by Packaging Type, 2019–2024
9.2.5.4 Market Estimates & Forecast, by Distribution Channel, 2019–2024
9.3.6 France
9.3.6.1 Market Estimates & Forecast, 2019–2024
9.3.6.2 Market Estimates & Forecast, by Type, 2019–2024
9.3.6.3 Market Estimates & Forecast, by Packaging Type, 2019–2024
9.3.6.4 Market Estimates & Forecast, by Distribution Channel, 2019–2024
9.3.7 Italy
9.3.7.1 Market Estimates & Forecast, 2019–2024
9.3.7.2 Market Estimates & Forecast, by Type, 2019–2024
9.3.7.3 Market Estimates & Forecast, by Packaging Type, 2019–2024
9.3.7.4 Market Estimates & Forecast, by Distribution Channel, 2019–2024
9.3.8 Spain
9.3.8.1 Market Estimates & Forecast, 2019–2024
9.3.8.2 Market Estimates & Forecast, by Type, 2019–2024
9.3.8.3 Market Estimates & Forecast, by Packaging Type, 2019–2024
9.3.8.4 Market Estimates & Forecast, by Distribution Channel, 2019–2024
9.3.9 UK
9.3.9.1 Market Estimates & Forecast, 2019–2024
9.3.9.2 Market Estimates & Forecast, by Type, 2019–2024
9.3.9.3 Market Estimates & Forecast, by Packaging Type, 2019–2024
9.3.9.4 Market Estimates & Forecast, by Distribution Channel, 2019–2024
9.3.10 Rest of Europe
9.3.10.1 Market Estimates & Forecast, 2019–2024
9.3.10.2 Market Estimates & Forecast, by Type, 2019–2024
9.3.10.3 Market Estimates & Forecast, by Packaging Type, 2019–2024
9.3.10.4 Market Estimates & Forecast, by Distribution Channel, 2019–2024
9.4 Asia-Pacific
9.4.1 Market Estimates & Forecast, 2019–2024
9.4.2 Market Estimates & Forecast, by Type, 2019–2024
9.4.3 Market Estimates & Forecast, by Packaging Type, 2019–2024
9.4.4 Market Estimates & Forecast, by Distribution Channel, 2019–2024
9.4.5 China
9.4.5.1 Market Estimates & Forecast, 2019–2024
9.4.5.2 Market Estimates & Forecast, by Type, 2019–2024
9.4.5.3 Market Estimates & Forecast, by Packaging Type, 2019–2024
9.4.5.4 Market Estimates & Forecast, by Distribution Channel, 2019–2024
9.4.6 India
9.4.6.1 Market Estimates & Forecast, 2019–2024
9.4.6.2 Market Estimates & Forecast, by Type, 2019–2024
9.4.6.3 Market Estimates & Forecast, by Packaging Type, 2019–2024
9.4.6.4 Market Estimates & Forecast, by Distribution Channel, 2019–2024
9.4.7 Japan
9.4.7.1 Market Estimates & Forecast, 2019–2024
9.4.7.2 Market Estimates & Forecast, by Type, 2019–2024
9.4.7.3 Market Estimates & Forecast, by Packaging Type, 2019–2024
9.4.7.4 Market Estimates & Forecast, by Distribution Channel, 2019–2024
9.4.8 Australia & New Zealand
9.4.8.1 Market Estimates & Forecast, 2019–2024
9.4.8.2 Market Estimates & Forecast, by Type, 2019–2024
9.4.8.3 Market Estimates & Forecast, by Packaging Type, 2019–2024
9.4.8.4 Market Estimates & Forecast, by Distribution Channel, 2019–2024
9.4.9 Rest of Asia-Pacific
9.4.9.1 Market Estimates & Forecast, 2019–2024
9.4.9.2 Market Estimates & Forecast, by Type, 2019–2024
9.4.9.3 Market Estimates & Forecast, by Packaging Type, 2019–2024
9.4.9.4 Market Estimates & Forecast, by Distribution Channel, 2019–2024
9.5 Rest of the World
9.5.1 Market Estimates & Forecast, 2019–2024
9.5.2 Market Estimates & Forecast, by Type, 2019–2024
9.5.3 Market Estimates & Forecast, by Packaging Type, 2019–2024
9.5.4 Market Estimates & Forecast, by Distribution Channel, 2019–2024
9.5.5 South America
9.5.5.1 Market Estimates & Forecast, 2019–2024
9.5.5.2 Market Estimates & Forecast, by Type, 2019–2024
9.5.5.3 Market Estimates & Forecast, by Packaging Type, 2019–2024
9.5.5.4 Market Estimates & Forecast, by Distribution Channel, 2019–2024
9.5.6 Middle East
9.5.6.1 Market Estimates & Forecast, 2019–2024
9.5.6.2 Market Estimates & Forecast, by Type, 2019–2024
9.5.6.3 Market Estimates & Forecast, by Packaging Type, 2019–2024
9.5.6.4 Market Estimates & Forecast, by Distribution Channel, 2019–2024
9.5.7 Africa
9.5.7.1 Market Estimates & Forecast, 2019–2024
9.5.7.2 Market Estimates & Forecast, by Type, 2019–2024
9.5.7.3 Market Estimates & Forecast, by Packaging Type, 2019–2024
9.5.7.4 Market Estimates & Forecast, by Distribution Channel, 2019–2024
10. Company Landscape
10.1 Introduction
10.2 Market Strategy
10.3 Key Development Analysis
(Expansions/Mergers & Acquisitions/Joint Ventures/New Product Developments/Agreements/Investments)
11. Company Profiles
11.1 Nestlé S.A.
11.1.1 Company Overview
11.1.2 Financial Updates
11.1.3 Product/Business Segment Overview
11.1.4 Strategy
11.1.5 Key Developments
11.1.6 SWOT Analysis
11.2 Keurig Dr Pepper Inc.
11.2.1 Company Overview
11.2.2 Financial Updates
11.2.3 Product/Business Segment Overview
11.2.4 Strategy
11.2.5 Key Developments
11.2.6 SWOT Analysis
11.3 The Coca-Cola Company
11.3.1 Company Overview
11.3.2 Financial Updates
11.3.3 Product/Business Segment Overview
11.3.4 Strategy
11.3.5 Key Developments
11.3.6 SWOT Analysis
11.4 Ting Hsin International Group
11.4.1 Company Overview
11.4.2 Financial Updates
11.4.3 Product/Business Segment Overview
11.4.4 Strategy
11.4.5 Key Developments
11.4.6 SWOT Analysis
11.5 Yakult Honsha Co., Ltd.
11.5.1 Company Overview
11.5.2 Financial Updates
11.5.3 Product/Business Segment Overview
11.5.4 Strategy
11.5.5 Key Developments
11.5.6 SWOT Analysis
11.6 Suntory Holdings Limited
11.6.1 Company Overview
11.6.2 Financial Updates
11.6.3 Product/Business Segment Overview
11.6.4 Strategy
11.6.5 Key Developments
11.6.6 SWOT Analysis
11.7 PepsiCo
11.7.1 Company Overview
11.7.2 Financial Updates
11.7.3 Product/Business Segment Overview
11.7.4 Strategy
11.7.5 Key Developments
11.7.6 SWOT Analysis
11.8 POKKA SAPPORO Food & Beverage Ltd.
11.8.1 Company Overview
11.8.2 Financial Updates
11.8.3 Product/Business Segment Overview
11.8.4 Strategy
11.8.5 Key Developments
11.8.6 SWOT Analysis
11.9 Lotte Chilsung Beverage Co. Ltd
11.9.1 Company Overview
11.9.2 Financial Updates
11.9.3 Product/Business Segment Overview
11.9.4 Strategy
11.9.5 Key Developments
11.9.6 SWOT Analysis
11.10 Starbucks Corporation
11.10.1 Company Overview
11.10.2 Financial Updates
11.10.3 Product/Business Segment Overview
11.10.4 Strategy
11.10.5 Key Developments
11.10.6 SWOT Analysis
11.11 The Republic of Tea
11.11.1 Company Overview
11.11.2 Financial Updates
11.11.3 Product/Business Segment Overview
11.11.4 Strategy
11.11.5 Key Developments
11.11.6 SWOT Analysis
11.12 Big Easy Blends, LLC
11.12.1 Company Overview
11.12.2 Financial Updates
11.12.3 Product/Business Segment Overview
11.12.4 Strategy
11.12.5 Key Developments
11.12.6 SWOT Analysis
11.13 Monster Energy
11.13.1 Company Overview
11.13.2 Financial Updates
11.13.3 Product/Business Segment Overview
11.13.4 Strategy
11.13.5 Key Developments
11.13.6 SWOT Analysis
11.14 DRY Soda Company
11.14.1 Company Overview
11.14.2 Financial Updates
11.14.3 Product/Business Segment Overview
11.14.4 Strategy
11.14.5 Key Developments
11.14.6 SWOT Analysis
11.15 Danone S.A.
11.15.1 Company Overview
11.15.2 Financial Updates
11.15.3 Product/Business Segment Overview
11.15.4 Strategy
11.15.5 Key Developments
11.15.6 SWOT Analysis
12. Conclusion
LIST OF TABLES
Table 1 Global Non-Alcoholic RTD Beverages Market, by Region, 2019–2024 (USD Million)
Table 2 Global Non-Alcoholic RTD Beverages Market, by Type, 2019–2024 (USD Million)
Table 3 Global Non-Alcoholic RTD Beverages Market, by Packaging Type, 2019–2024 (USD Million)
Table 4 Global Non-Alcoholic RTD Beverages Market, by Distribution Channel, 2019–2024 (USD Million)
Table 5 North America: Non-Alcoholic RTD Beverages Market, by Country, 2019–2024 (USD Million)
Table 6 North America: Non-Alcoholic RTD Beverages Market, by Type, 2019–2024 (USD Million)
Table 7 North America: Non-Alcoholic RTD Beverages Market, by Packaging Type, 2019–2024 (USD Million)
Table 8 North America: Non-Alcoholic RTD Beverages Market, by Distribution Channel, 2019–2024 (USD Million)
Table 9 US: Non-Alcoholic RTD Beverages Market, by Type, 2019–2024 (USD Million)
Table 10 US: Non-Alcoholic RTD Beverages Market, by Packaging Type, 2019–2024 (USD Million)
Table 11 US: Non-Alcoholic RTD Beverages Market, by Distribution Channel, 2019–2024 (USD Million)
Table 12 Canada: Non-Alcoholic RTD Beverages Market, by Type, 2019–2024 (USD Million)
Table 13 Canada: Non-Alcoholic RTD Beverages Market, by Packaging Type, 2019–2024 (USD Million)
Table 14 Canada: Non-Alcoholic RTD Beverages Market, by Distribution Channel, 2019–2024 (USD Million)
Table 15 Mexico: Non-Alcoholic RTD Beverages Market, by Type, 2019–2024 (USD Million)
Table 16 Mexico: Non-Alcoholic RTD Beverages Market, by Packaging Type, 2019–2024 (USD Million)
Table 17 Mexico: Non-Alcoholic RTD Beverages Market, by Distribution Channel, 2019–2024 (USD Million)
Table 18 Europe: Non-Alcoholic RTD Beverages Market, by Country, 2019–2024 (USD Million)
Table 19 Europe: Non-Alcoholic RTD Beverages Market, by Type, 2019–2024 (USD Million)
Table 20 Europe: Non-Alcoholic RTD Beverages Market, by Packaging Type, 2019–2024 (USD Million)
Table 21 Europe: Non-Alcoholic RTD Beverages Market, by Distribution Channel, 2019–2024 (USD Million)
Table 22 Germany: Non-Alcoholic RTD Beverages Market, by Type, 2019–2024 (USD Million)
Table 23 Germany: Non-Alcoholic RTD Beverages Market, by Packaging Type, 2019–2024 (USD Million)
Table 24 Germany: Non-Alcoholic RTD Beverages Market, by Distribution Channel, 2019–2024 (USD Million)
Table 25 France: Non-Alcoholic RTD Beverages Market, by Type, 2019–2024 (USD Million)
Table 26 France: Non-Alcoholic RTD Beverages Market, by Packaging Type, 2019–2024 (USD Million)
Table 27 France: Non-Alcoholic RTD Beverages Market, by Distribution Channel, 2019–2024 (USD Million)
Table 28 Italy: Non-Alcoholic RTD Beverages Market, by Type, 2019–2024 (USD Million)
Table 29 Italy: Non-Alcoholic RTD Beverages Market, by Packaging Type, 2019–2024 (USD Million)
Table 30 Italy: Non-Alcoholic RTD Beverages Market, by Distribution Channel, 2019–2024 (USD Million)
Table 31 Spain: Non-Alcoholic RTD Beverages Market, by Type, 2019–2024 (USD Million)
Table 32 Spain: Non-Alcoholic RTD Beverages Market, by Packaging Type, 2019–2024 (USD Million)
Table 33 Spain: Non-Alcoholic RTD Beverages Market, by Distribution Channel, 2019–2024 (USD Million)
Table 34 UK: Non-Alcoholic RTD Beverages Market, by Type, 2019–2024 (USD Million)
Table 35 UK: Non-Alcoholic RTD Beverages Market, by Packaging Type, 2019–2024 (USD Million)
Table 36 UK: Non-Alcoholic RTD Beverages Market, by Distribution Channel, 2019–2024 (USD Million)
Table 37 Rest of Europe: Non-Alcoholic RTD Beverages Market, by Type, 2019–2024 (USD Million)
Table 38 Rest of Europe: Non-Alcoholic RTD Beverages Market, by Packaging Type, 2019–2024 (USD Million)
Table 39 Rest of Europe: Non-Alcoholic RTD Beverages Market, by Distribution Channel, 2019–2024 (USD Million)
Table 40 Asia-Pacific: Non-Alcoholic RTD Beverages Market, by Country, 2019–2024 (USD Million)
Table 41 Asia-Pacific: Non-Alcoholic RTD Beverages Market, by Type, 2019–2024 (USD Million)
Table 42 Asia-Pacific: Non-Alcoholic RTD Beverages Market, by Packaging Type, 2019–2024 (USD Million)
Table 43 Asia-Pacific: Non-Alcoholic RTD Beverages Market, by Distribution Channel, 2019–2024 (USD Million)
Table 44 China: Non-Alcoholic RTD Beverages Market, by Type, 2019–2024 (USD Million)
Table 45 China: Non-Alcoholic RTD Beverages Market, by Packaging Type, 2019–2024 (USD Million)
Table 46 China: Non-Alcoholic RTD Beverages Market, by Distribution Channel, 2019–2024 (USD Million)
Table 47 India: Non-Alcoholic RTD Beverages Market, by Type, 2019–2024 (USD Million)
Table 48 India: Non-Alcoholic RTD Beverages Market, by Packaging Type, 2019–2024 (USD Million)
Table 49 India: Non-Alcoholic RTD Beverages Market, by Distribution Channel, 2019–2024 (USD Million)
Table 50 Japan: Non-Alcoholic RTD Beverages Market, by Type, 2019–2024 (USD Million)
Table 51 Japan: Non-Alcoholic RTD Beverages Market, by Packaging Type, 2019–2024 (USD Million)
Table 52 Japan: Non-Alcoholic RTD Beverages Market, by Distribution Channel, 2019–2024 (USD Million)
Table 53 Rest of Asia-Pacific: Non-Alcoholic RTD Beverages Market, by Type, 2019–2024 (USD Million)
Table 54 Rest of Asia-Pacific: Non-Alcoholic RTD Beverages Market, by Packaging Type, 2019–2024 (USD Million)
Table 55 Rest of Asia-Pacific: Non-Alcoholic RTD Beverages Market, by Distribution Channel, 2019–2024 (USD Million)
Table 56 Rest of the World (RoW): Non-Alcoholic RTD Beverages Market, by Country, 2019–2024 (USD Million)
Table 57 Rest of the World (RoW): Non-Alcoholic RTD Beverages Market, by Type, 2019–2024 (USD Million)
Table 58 Rest of the World (RoW): Non-Alcoholic RTD Beverages Market, by Packaging Type, 2019–2024 (USD Million)
Table 59 Rest of the World (RoW): Non-Alcoholic RTD Beverages Market, by Distribution Channel, 2019–2024 (USD Million)
Table 60 South America: Non-Alcoholic RTD Beverages Market, by Type, 2019–2024 (USD Million)
Table 61 South America: Non-Alcoholic RTD Beverages Market, by Packaging Type, 2019–2024 (USD Million)
Table 62 South America: Non-Alcoholic RTD Beverages Market, by Distribution Channel, 2019–2024 (USD Million)
Table 63 Middle East: Non-Alcoholic RTD Beverages Market, by Type, 2019–2024 (USD Million)
Table 64 Middle East: Non-Alcoholic RTD Beverages Market, by Packaging Type, 2019–2024 (USD Million)
Table 65 Middle East: Non-Alcoholic RTD Beverages Market, by Distribution Channel, 2019–2024 (USD Million)
Table 66 Africa: Non-Alcoholic RTD Beverages Market, by Type, 2019–2024 (USD Million)
Table 67 Africa: Non-Alcoholic RTD Beverages Market, by Packaging Type, 2019–2024 (USD Million)
Table 68 Africa: Non-Alcoholic RTD Beverages Market, by Distribution Channel, 2019–2024 (USD Million)
LIST OF FIGURES
FIGURE 1 Global Non-Alcoholic RTD Beverages Market Segmentation
FIGURE 2 Forecast Research Methodology
FIGURE 3 Five Forces Analysis of the Global Non-Alcoholic RTD Beverages Market
FIGURE 4 Value Chain of the Global Non-Alcoholic RTD Beverages Market
FIGURE 5 Share of the Global Non-Alcoholic RTD Beverages Market in 2018, by Country (%)
FIGURE 6 Global Non-Alcoholic RTD Beverages Market, by Region, 2019–2024,
FIGURE 7 Global Non-Alcoholic RTD Beverages Market Size, by Type, 2018
FIGURE 8 Share of the Global Non-Alcoholic RTD Beverages Market, by Type, 2019–2024 (%)
FIGURE 9 Global Non-Alcoholic RTD Beverages Market Size, by Packaging Type, 2018
FIGURE 10 Share of the Global Non-Alcoholic RTD Beverages Market, by Packaging Type, 2019–2024 (%)
FIGURE 11 Global Non-Alcoholic RTD Beverages Market Size, by Distribution Channel, 2018
FIGURE 12 Share of the Global Non-Alcoholic RTD Beverages Market, by Distribution Channel, 2019–2024 (%)