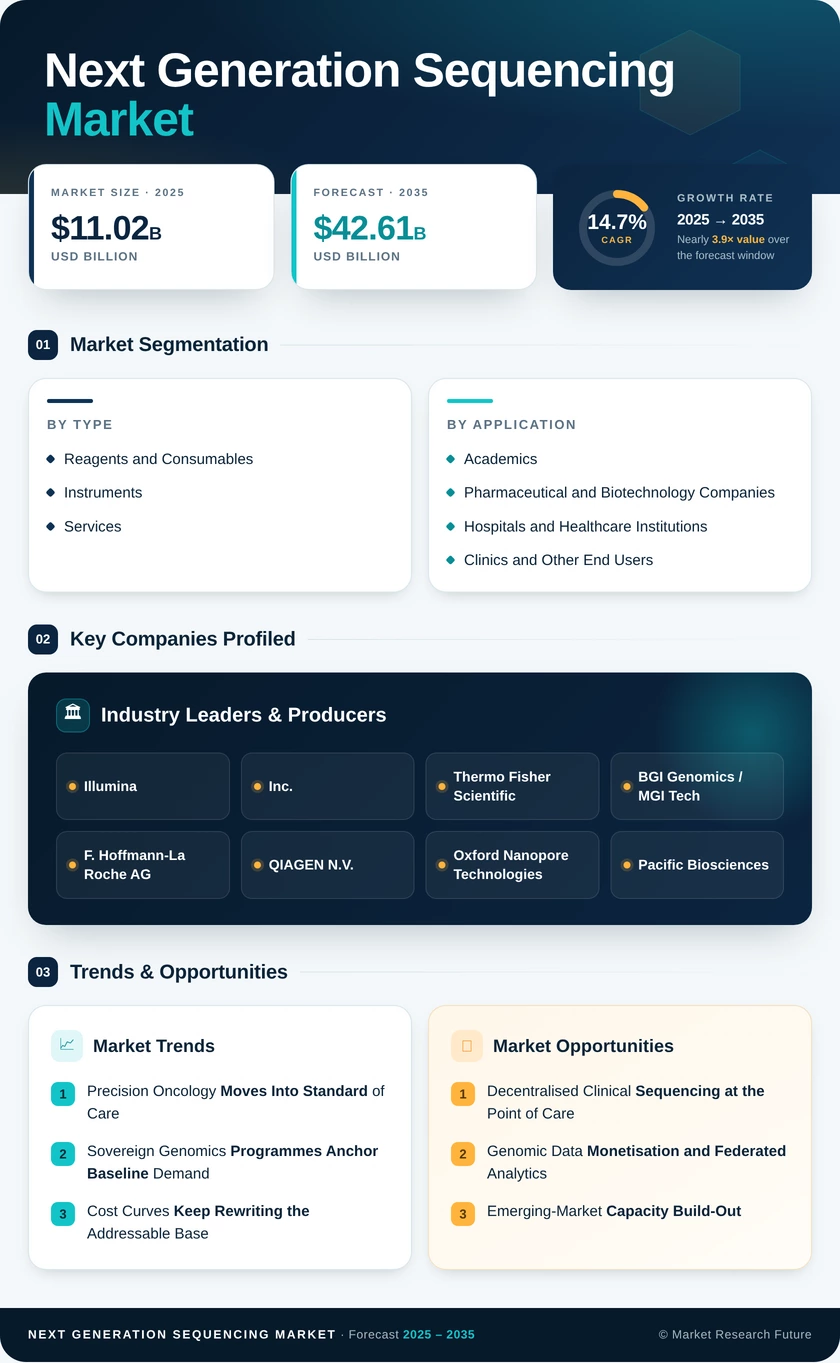
Segmentation Quick Reference
| Dimension | Sub-Segments | Dominant Segment | Fastest Growing Segment |
| Type of Sequencing | Whole Genome Sequencing; Whole Exome Sequencing; Targeted Resequencing; RNA Sequencing; ChIP Sequencing; Methyl Sequencing | Targeted Resequencing | Whole Exome Sequencing |
| Product Type | Instruments; Reagents and Consumables; Services | Reagents and Consumables | Instruments |
| Application | Drug Discovery and Personalized Medicine; Diagnostics; Genetic Screening; Agriculture and Animal Research; Reproductive Health and Other Applications | Drug Discovery and Personalized Medicine | Genetic Screening |
| End User | Academics; Pharmaceutical and Biotechnology Companies; Hospitals and Healthcare Institutions; Clinics and Other End Users | Academics | Hospitals and Healthcare Institutions |
| Geography | North America; Europe; Asia-Pacific; South America; Middle East & Africa | North America | Asia-Pacific |
Market Segmentation Overview
By Type of Sequencing
| Sub-Segment | Key Trend |
| Whole Genome Sequencing | Population cohort programmes shift volume from research to standing clinical services |
| Whole Exome Sequencing | First-line adoption in undiagnosed rare disease pathways drives the steepest growth curve |
| Targeted Resequencing | Oncology panel standardisation sustains the largest revenue base |
| RNA Sequencing | Single-cell and spatial workflows expand reagent consumption per run |
| ChIP Sequencing | Steady academic demand tied to epigenetic regulation research funding |
| Methyl Sequencing | Methylation signatures underpin the next wave of early cancer detection assays |
Sequencing type selection increasingly reflects reimbursement reality rather than scientific preference. Panels win on cost and turnaround where payers set the ceiling; broader approaches win where diagnostic yield justifies the spend.
By Product Type
| Sub-Segment | Key Trend |
| Instruments | Fleet replacement cycles and sub-USD 50,000 benchtop systems accelerate placement |
| Reagents and Consumables | Open-chemistry competition compresses margins in the mid-throughput tier |
| Services | Outsourced sequencing grows where capital budgets constrain in-house capacity |
Product mix is where the industry's business model transition is most visible. Recurring consumable revenue still dominates the top line, but the terms on which it is captured are being renegotiated across every buyer segment.
By Application
| Sub-Segment | Key Trend |
| Drug Discovery and Personalized Medicine | Multiomics pipelines raise sequencing intensity per pharma programme |
| Diagnostics | Reimbursed oncology and infectious disease testing anchor predictable volume |
| Genetic Screening | Newborn and carrier programmes move from pilot to standing service |
| Agriculture and Animal Research | Trait selection and breeding programmes adopt genotyping at scale |
| Reproductive Health and Other Applications | Non-invasive prenatal testing expands into mid-income health systems |
Application growth is diverging by funding source. Clinically reimbursed uses compound steadily, while research-funded applications track grant cycles and remain more volatile year to year.
By End User
| Sub-Segment | Key Trend |
| Academics | Core facilities retain the largest share but face capital budget compression |
| Pharmaceutical and Biotechnology Companies | Translational research and companion diagnostic development sustain demand |
| Hospitals and Healthcare Institutions | In-house clinical sequencing displaces send-out reference testing |
| Clinics and Other End Users | Specialty and consumer-facing testing channels expand selectively |
End-user composition is the clearest signal of market maturation. As hospitals absorb testing internally, demand becomes tied to patient volumes rather than research funding, improving revenue predictability for suppliers positioned in clinical workflows.
By Geography
| Sub-Segment | Key Trend |
| North America | Payer coverage depth keeps clinical volume ahead of every other region |
| Europe | IVDR compliance concentrates spend on conformity-assessed platforms |
| Asia-Pacific | Domestic instrument manufacturing and national cohorts drive fastest growth |
| South America | Managed-service and reagent-rental models offset currency volatility |
| Middle East & Africa | Sovereign genome programmes fund end-to-end capacity in a single procurement cycle |
Geographic performance tracks institutional capability more than economic size. Regions that pair funding with regulatory clarity and trained workforce convert investment into sustained volume; those missing any one element stall at pilot scale.
just now
Opus 5 High


 Noah Malgeri
Co-Founder
Noah Malgeri
Co-Founder

 Peter Groot koerkamp
Account and Business Manager
Peter Groot koerkamp
Account and Business Manager

 Younghwan Choi
Senior Retail Manager
Younghwan Choi
Senior Retail Manager

 Mark Irwin
Management Consultant
Mark Irwin
Management Consultant

 Akif Moroglu
Strategy & Business Development Director
Akif Moroglu
Strategy & Business Development Director

 Guilherme Gomes Martins
Product Management Director
Guilherme Gomes Martins
Product Management Director

 Joseph Aguayo
Sales Operations & Pricing Manager
Joseph Aguayo
Sales Operations & Pricing Manager

 La Terria Dodd
Program Support Specialist
La Terria Dodd
Program Support Specialist

 Rob Kooiker
Group Product Manager HVAC & Fire Protection GMA
Rob Kooiker
Group Product Manager HVAC & Fire Protection GMA