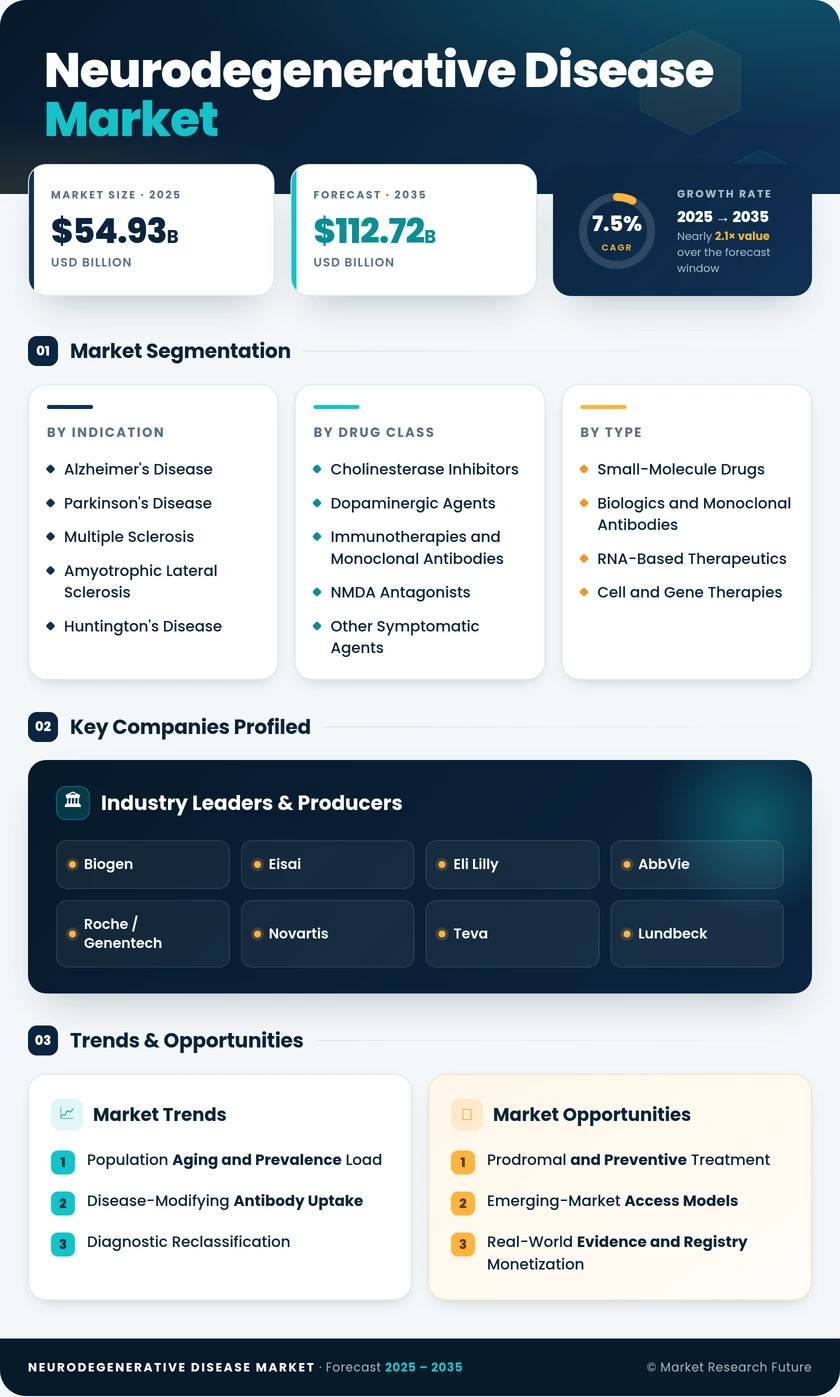
Neurodegenerative Disease Market (2025 - 2035)

Neurodegenerative Disease Market Research Report By Disease Type (Alzheimer's Disease, Parkinson's Disease, Multiple Sclerosis, Amyotrophic Lateral Sclerosis, Huntington's Disease), By Diagnosis Method (Neurological Examination, Imaging Techniques, Cerebrospinal Fluid Analysis, Electrophysiological Tests), By Treatment Type (Medication, Therapy, Rehabilitation, Surgical Interventions), By Route of Administration (Oral, Injectable, Intravenous, Transdermal) and By Regional (North America, Europe, South America, Asia Pacific, Middle East and Africa) - Growth & Industry Forecast 2025 To 2035

Forecast Period
2025-2035
CAGR
7.5%
2025 Market Size
USD 54.93 Billion
2035 Market Size
USD 112.72 Billion
Life Sciences ● Updated August 2026 Report ID: MRFR/LS/17671-HCR | Pages: 200 | Author: Vikita Thakur, Rahul Gotadki
  1. 1 Market Overview |
    1. 1.1 Study Assumptions & Market Definition |
    2. 1.2 Scope of the Study |
    3. 1.3 Research Methodology
  2. 2 Market Summary & Key Takeaways
  3. 3 Market Dynamics |
    1. 3.1 Market Drivers Analysis | |
      1. 3.1.1 Population Aging and Prevalence Load | |
      2. 3.1.2 Disease-Modifying Antibody Uptake | |
      3. 3.1.3 Blood-Based Diagnostic Reclassification | |
      4. 3.1.4 Public Funding and National Dementia Plans | |
      5. 3.1.5 Advanced-Stage Parkinson's Delivery Innovation | |
      6. 3.1.6 Genetically Defined Subtype Targeting | |
      7. 3.1.7 Asia-Pacific Screening Mandates |
    2. 3.2 Market Restraints Analysis | |
      1. 3.2.1 Generic Erosion in Symptomatic Classes | |
      2. 3.2.2 Payer Restriction and Divergent HTA Outcomes | |
      3. 3.2.3 Infusion and MRI Infrastructure Limits | |
      4. 3.2.4 Clinical Trial Attrition | |
      5. 3.2.5 Diagnostic Delay in Low-Resource Settings |
    3. 3.3 Market Opportunity Analysis | |
      1. 3.3.1 Prodromal and Preventive Treatment | |
      2. 3.3.2 Emerging-Market Access Models | |
      3. 3.3.3 Real-World Evidence and Registry Monetization | |
      4. 3.3.4 Genetically Defined Subtypes | |
      5. 3.3.5 Home-Delivered Maintenance |
    4. 3.4 Industry Value Chain Analysis |
    5. 3.5 Porter's Five Forces Analysis
  4. 4 Global Neurodegenerative Disease Market Size & Forecast (2021–2035) |
    1. 4.1 Historical Market Size (2021–2025) |
    2. 4.2 Current & Forecast Market Size (2026–2035) |
    3. 4.3 Market Size by Revenue (USD billion) |
    4. 4.4 Year-over-Year Growth Analysis
  5. 5 Segmentation Analysis |
    1. 5.1 By Indication | |
      1. 5.1.1 Alzheimer's Disease | |
      2. 5.1.2 Parkinson's Disease | |
      3. 5.1.3 Multiple Sclerosis | |
      4. 5.1.4 Amyotrophic Lateral Sclerosis | |
      5. 5.1.5 Huntington's Disease | |
      6. 5.1.6 Other Indications |
    2. 5.2 By Drug Class | |
      1. 5.2.1 Cholinesterase Inhibitors | |
      2. 5.2.2 NMDA Antagonists | |
      3. 5.2.3 Dopaminergic Agents | |
      4. 5.2.4 Immunotherapies and Monoclonal Antibodies | |
      5. 5.2.5 Gene and Cell Therapies | |
      6. 5.2.6 Other Symptomatic Agents |
    3. 5.3 By Molecule Type | |
      1. 5.3.1 Small-Molecule Drugs | |
      2. 5.3.2 Biologics and Monoclonal Antibodies | |
      3. 5.3.3 RNA-Based Therapeutics | |
      4. 5.3.4 Cell and Gene Therapies |
    4. 5.4 By Route of Administration | |
      1. 5.4.1 Oral | |
      2. 5.4.2 Injectable / Parenteral | |
      3. 5.4.3 Transdermal / Intranasal |
    5. 5.5 By Distribution Channel | |
      1. 5.5.1 Hospital Pharmacies | |
      2. 5.5.2 Retail Pharmacies | |
      3. 5.5.3 Online Pharmacies
  6. 6 Regional Analysis |
    1. 6.1 North America | |
      1. 6.1.1 United States | |
      2. 6.1.2 Canada | |
      3. 6.1.3 Mexico |
    2. 6.2 Europe | |
      1. 6.2.1 Germany | |
      2. 6.2.2 United Kingdom | |
      3. 6.2.3 France | |
      4. 6.2.4 Italy | |
      5. 6.2.5 Spain | |
      6. 6.2.6 Nordic Countries | |
      7. 6.2.7 Russia | |
      8. 6.2.8 Rest of Europe |
    3. 6.3 Asia-Pacific | |
      1. 6.3.1 China | |
      2. 6.3.2 India | |
      3. 6.3.3 Japan | |
      4. 6.3.4 South Korea | |
      5. 6.3.5 ASEAN | |
      6. 6.3.6 Rest of Asia-Pacific |
    4. 6.4 South America | |
      1. 6.4.1 Brazil | |
      2. 6.4.2 Argentina | |
      3. 6.4.3 Rest of South America |
    5. 6.5 Middle East & Africa | |
      1. 6.5.1 Saudi Arabia | |
      2. 6.5.2 UAE | |
      3. 6.5.3 South Africa | |
      4. 6.5.4 Egypt | |
      5. 6.5.5 Rest of Middle East & Africa
  7. 7 Competitive Landscape |
    1. 7.1 Market Share Analysis (2026) |
    2. 7.2 Competitive Benchmarking Matrix |
    3. 7.3 Company Profiles | |
      1. 7.3.1 Biogen | |
      2. 7.3.2 Eisai | |
      3. 7.3.3 Eli Lilly | |
      4. 7.3.4 AbbVie | |
      5. 7.3.5 Roche / Genentech | |
      6. 7.3.6 Novartis | |
      7. 7.3.7 Teva | |
      8. 7.3.8 Lundbeck | |
      9. 7.3.9 UCB | |
      10. 7.3.10 Supernus Pharmaceuticals | |
      11. 7.3.11 Denali Therapeutics | |
      12. 7.3.12 uniQure
  8. 8 Future Outlook & Strategic Recommendations (2026–2035) |
    1. 8.1 Near-Term Outlook (2026–2028) |
    2. 8.2 Medium-Term Outlook (2029–2031) |
    3. 8.3 Long-Term Outlook (2032–2035)
  9. 9 Recent Developments & News
  10. 10 Frequently Asked Questions (FAQs)
  11. 11 Report Scope & Methodology |
    1. 11.1 Study Period & Base Year |
    2. 11.2 Data Sources & Citations |
    3. 11.3 Abbreviations
  12. 12 LIST OF TABLES |
  13. TABLE 1 Global Neurodegenerative Disease Market Size & Forecast, by Revenue (USD billion), 2021–2035 |
  14. TABLE 2 Global Neurodegenerative Disease Market – Year-over-Year Growth Analysis, 2021–2035 |
  15. TABLE 3 Driver Impact Analysis Matrix, 2026–2035 |
  16. TABLE 4 Restraint Impact Analysis Matrix, 2026–2035 |
  17. TABLE 5 Global Neurodegenerative Disease Market Size, by Indication, 2021–2035 (USD billion) |
  18. TABLE 6 Global Neurodegenerative Disease Market Size, by Drug Class, 2021–2035 (USD billion) |
  19. TABLE 7 Global Neurodegenerative Disease Market Size, by Molecule Type, 2021–2035 (USD billion) |
  20. TABLE 8 Global Neurodegenerative Disease Market Size, by Route of Administration, 2021–2035 (USD billion) |
  21. TABLE 9 Global Neurodegenerative Disease Market Size, by Distribution Channel, 2021–2035 (USD billion) |
  22. TABLE 10 Global Neurodegenerative Disease Market Size, by Region, 2021–2035 (USD billion) |
  23. TABLE 11 North America Neurodegenerative Disease Market Size, by Country, 2021–2035 (USD billion) |
  24. TABLE 12 Europe Neurodegenerative Disease Market Size, by Country, 2021–2035 (USD billion) |
  25. TABLE 13 Asia-Pacific Neurodegenerative Disease Market Size, by Country, 2021–2035 (USD billion) |
  26. TABLE 14 South America Neurodegenerative Disease Market Size, by Country, 2021–2035 (USD billion) |
  27. TABLE 15 Middle East & Africa Neurodegenerative Disease Market Size, by Country, 2021–2035 (USD billion) |
  28. TABLE 16 North America Neurodegenerative Disease Market Size, by Indication, 2021–2035 (USD billion) |
  29. TABLE 17 North America Neurodegenerative Disease Market Size, by Drug Class, 2021–2035 (USD billion) |
  30. TABLE 18 North America Neurodegenerative Disease Market Size, by Route of Administration, 2021–2035 (USD billion) |
  31. TABLE 19 Europe Neurodegenerative Disease Market Size, by Indication, 2021–2035 (USD billion) |
  32. TABLE 20 Europe Neurodegenerative Disease Market Size, by Drug Class, 2021–2035 (USD billion) |
  33. TABLE 21 Europe Neurodegenerative Disease Market Size, by Distribution Channel, 2021–2035 (USD billion) |
  34. TABLE 22 Asia-Pacific Neurodegenerative Disease Market Size, by Indication, 2021–2035 (USD billion) |
  35. TABLE 23 Asia-Pacific Neurodegenerative Disease Market Size, by Molecule Type, 2021–2035 (USD billion) |
  36. TABLE 24 Asia-Pacific Neurodegenerative Disease Market Size, by Distribution Channel, 2021–2035 (USD billion) |
  37. TABLE 25 South America Neurodegenerative Disease Market Size, by Indication, 2021–2035 (USD billion) |
  38. TABLE 26 South America Neurodegenerative Disease Market Size, by Drug Class, 2021–2035 (USD billion) |
  39. TABLE 27 Middle East & Africa Neurodegenerative Disease Market Size, by Indication, 2021–2035 (USD billion) |
  40. TABLE 28 Middle East & Africa Neurodegenerative Disease Market Size, by Drug Class, 2021–2035 (USD billion) |
  41. TABLE 29 United States Neurodegenerative Disease Market Size, by Indication, 2021–2035 (USD billion) |
  42. TABLE 30 United States Neurodegenerative Disease Market Size, by Route of Administration, 2021–2035 (USD billion) |
  43. TABLE 31 Germany Neurodegenerative Disease Market Size, by Indication, 2021–2035 (USD billion) |
  44. TABLE 32 United Kingdom Neurodegenerative Disease Market Size, by Indication, 2021–2035 (USD billion) |
  45. TABLE 33 Japan Neurodegenerative Disease Market Size, by Indication, 2021–2035 (USD billion) |
  46. TABLE 34 China Neurodegenerative Disease Market Size, by Indication, 2021–2035 (USD billion) |
  47. TABLE 35 India Neurodegenerative Disease Market Size, by Drug Class, 2021–2035 (USD billion) |
  48. TABLE 36 Brazil Neurodegenerative Disease Market Size, by Drug Class, 2021–2035 (USD billion) |
  49. TABLE 37 Saudi Arabia Neurodegenerative Disease Market Size, by Indication, 2021–2035 (USD billion) |
  50. TABLE 38 Competitive Benchmarking Matrix – Global Neurodegenerative Disease Market, 2026 |
  51. TABLE 39 Company Profiles – Key Players, Global Neurodegenerative Disease Market |
  52. TABLE 40 Recent Developments & Strategic Announcements, 2023–2025 |
  53. TABLE 41 Report Scope & Methodology Summary |
  54. TABLE 42 Detailed Sources and Citations Index
  55. 13 LIST OF FIGURES |
  56. FIGURE 1 Global Neurodegenerative Disease Market Dynamics – Drivers, Restraints, Opportunities |
  57. FIGURE 2 Industry Value Chain Analysis – Discovery to Patient Administration |
  58. FIGURE 3 Porter's Five Forces Analysis |
  59. FIGURE 4 Global Market Size Trend and Forecast, 2021–2035 (USD billion) |
  60. FIGURE 5 Year-over-Year Growth Rate Trend, 2022–2035 (%) |
  61. FIGURE 6 Market Share by Indication, 2025 vs 2035 (%) |
  62. FIGURE 7 Market Share by Drug Class, 2025 (%) |
  63. FIGURE 8 Market Share by Molecule Type, 2025 (%) |
  64. FIGURE 9 Market Share by Route of Administration, 2025 (%) |
  65. FIGURE 10 Market Share by Distribution Channel, 2025 (%) |
  66. FIGURE 11 Regional Market Share, 2025 (%) |
  67. FIGURE 12 Regional CAGR Comparison, 2026–2035 (%) |
  68. FIGURE 13 North America Country-Level Share, 2025 (%) |
  69. FIGURE 14 Europe Country-Level Share, 2025 (%) |
  70. FIGURE 15 Asia-Pacific Country-Level Share, 2025 (%) |
  71. FIGURE 16 Competitive Landscape – Estimated Revenue Share Bands, 2026 |
  72. FIGURE 17 Competitive Positioning Matrix – Pipeline Depth vs Commercial Reach |
  73. FIGURE 18 Regulatory Milestone Timeline, 2021–2026
Share::
Request Free Sample

Segmentation Quick Reference

DimensionSub-SegmentsDominant SegmentFastest Growing Segment
By IndicationAlzheimer's Disease; Parkinson's Disease; Multiple Sclerosis; Amyotrophic Lateral Sclerosis; Huntington's Disease; Other IndicationsAlzheimer's DiseaseAmyotrophic Lateral Sclerosis
By Drug ClassCholinesterase Inhibitors; NMDA Antagonists; Dopaminergic Agents; Immunotherapies and Monoclonal Antibodies; Gene and Cell Therapies; Other Symptomatic AgentsCholinesterase InhibitorsGene and Cell Therapies
By Molecule TypeSmall-Molecule Drugs; Biologics and Monoclonal Antibodies; RNA-Based Therapeutics; Cell and Gene TherapiesSmall-Molecule DrugsRNA-Based Therapeutics
By Route of AdministrationOral; Injectable / Parenteral; Transdermal / IntranasalOralTransdermal / Intranasal
By Distribution ChannelHospital Pharmacies; Retail Pharmacies; Online PharmaciesHospital PharmaciesOnline Pharmacies
By GeographyNorth America; Europe; Asia-Pacific; South America; Middle East & AfricaNorth AmericaAsia-Pacific


Market Segmentation Overview

By Indication

Sub-SegmentKey Trend
Alzheimer's DiseaseAmyloid-directed antibodies establish a premium price tier above a generic symptomatic base.
Parkinson's DiseaseContinuous infusion and wearable pumps convert generic molecules into device-drug premiums.
Multiple SclerosisMature high-efficacy therapy market facing biosimilar entry on legacy agents.
Amyotrophic Lateral SclerosisAntisense success in SOD1 subtype drives genetically stratified development.
Huntington's DiseaseGene therapy filings face evolving evidentiary standards for external control arms.
Other IndicationsRare ataxias and atypical parkinsonism attract orphan-designation development.


Indication mix determines pricing power more than volume. Alzheimer's supplies the largest patient pool but the most contested value proposition, while smaller genetically defined indications command premium pricing on far lower unit volumes.

By Drug Class

Sub-SegmentKey Trend
Cholinesterase InhibitorsVolume-stable, value-eroding generic backbone of dementia care
NMDA AntagonistsSteady use in moderate-to-severe dementia with limited pricing upside
Dopaminergic AgentsReformulation and delivery innovation extend commercial life of levodopa.
Immunotherapies and Monoclonal AntibodiesFastest revenue accretion in absolute dollars through 2030
Gene and Cell TherapiesHighest growth rate from a small base; regulatory pathway still forming
Other Symptomatic AgentsAgitation and sleep comorbidity products fill unmet supportive-care gaps.


Class economics diverge sharply. Two classes supply most volume, two supply most growth, and almost none supply both.

By Molecule Type

Sub-SegmentKey Trend
Small-Molecule DrugsOral convenience sustains share despite minimal pricing power
Biologics and Monoclonal AntibodiesDelivery format increasingly differentiates otherwise similar agents.
RNA-Based TherapeuticsIntrathecal antisense expands into additional monogenic targets.
Cell and Gene TherapiesOne-time dosing challenges conventional annual-cost reimbursement models


Molecule type increasingly predicts the payer conversation. Small molecules negotiate on price; biologics and gene therapies negotiate on outcome guarantees.

By Route of Administration

Sub-SegmentKey Trend
OralDefault for symptomatic maintenance across all severity stages
Injectable / ParenteralRequired for antibody induction and intrathecal antisense dosing
Transdermal / IntranasalFastest growth as swallowing difficulty rises in advanced disease.


Route decisions now carry commercial weight equal to efficacy data, because they determine site of care and therefore who holds the budget.

By Distribution Channel

Sub-SegmentKey Trend
Hospital PharmaciesAnchored by infusion administration and imaging surveillance requirements
Retail PharmaciesChronic oral refill volume with thin margins
Online PharmaciesCaregiver-driven home delivery expands fastest across all channels.


Channel share will shift as subcutaneous maintenance formats scale, moving value from hospital pharmacy toward specialty distribution and direct-to-home fulfilment.




Share::
Request Free Sample
Download PDF ×

We do not share your information with anyone. However, we may send you emails based on your report interest from time to time. You may contact us at any time to opt-out.