ID: MRFR/ICT/8969-HCR | March 2021 | Region: Global | 100 Pages
Table of Contents
1. EXECUTIVE SUMMARY
1.1. Market Attractiveness Analysis
1.1.1. Global Network Transformation Market, by Component
1.1.2. Global Network Transformation Market, by Organization Size
1.1.3. Global Network Transformation Market, by Vertical
1.1.4. Global Network Transformation Market, by Region
2. MARKET INTRODUCTION
2.1. Definition
2.2. Scope of the Study
2.3. Market Structure
3. RESEARCH METHODOLOGY
3.1. Research Process
3.2. Primary Research
3.3. Secondary Research
3.4. Market Size Estimation
3.5. List of Assumptions
4. MARKET DYNAMICS
4.1. Introduction
4.2. Drivers
4.2.1. Rising demand for IT as a service
4.2.2. Increasing trend of bring your own device by organizations
4.2.3. Adoption of network virtualization
4.3. Restraint
4.3.1. Lack of skilled workforce
4.4. Opportunity
4.4.1. Rapid advancements in technology
4.5. Challenges
4.5.1. Assurance of business readiness
4.6. Impact of COVID-19
4.6.1. Impact on business intelligence
4.6.2. Impact on healthcare industry
4.6.3. Impact on IT industry
5. MARKET FACTOR ANALYSIS
5.1. Value Chain Analysis/Supply Chain Analysis
5.2. Porterβs Five Forces Model
5.2.1. Bargaining Power of Suppliers
5.2.2. Bargaining Power of Buyers
5.2.3. Threat of New Entrants
5.2.4. Threat of Substitutes
5.2.5. Intensity of Rivalry
6. GLOBAL NETWORK TRANSFORMATION MARKET, BY COMPONENT
6.1. Introduction
6.2. Solution
6.2.1. 5G Networks
6.2.2. C-RAN
6.2.3. Network Automation
6.2.4. SDN & NFV
6.3. Services
6.3.1. Professional Services
6.3.2. Managed Services
7. GLOBAL NETWORK TRANSFORMATION MARKET, BY ORGANIZATION SIZE
7.1. Introduction
7.2. Small & Medium Enterprise
7.3. Large Enterprise
8. GLOBAL NETWORK TRANSFORMATION MARKET, BY VERTICAL
8.1. Introduction
8.2. BFSI
8.3. Energy & Utility
8.4. Government
8.5. Healthcare
8.6. IT & Telecom
8.7. Manufacturing
8.8. Retail
8.9. Others
9. GLOBAL NETWORK TRANSFORMATION MARKET, BY REGION
9.1. Overview
9.2. North America
9.2.1. Market Size & Estimates, by Country, 2020β2027
9.2.2. Market Size & Estimates, by Component, 2020β2027
9.2.3. Market Size & Estimates, by Organization Size, 2020β2027
9.2.4. Market Size & Estimates, by Vertical, 2020β2027
9.2.5. US
9.2.5.1. Market Size & Estimates, by Component, 2020β2027
9.2.5.2. Market Size & Estimates, by Organization Size, 2020β2027
9.2.5.3. Market Size & Estimates, by Vertical, 2020β2027
9.2.6. Canada
9.2.6.1. Market Size & Estimates, by Component, 2020β2027
9.2.6.2. Market Size & Estimates, by Organization Size, 2020β2027
9.2.6.3. Market Size & Estimates, by Vertical, 2020β2027
9.2.7. Mexico
9.2.7.1. Market Size & Estimates, by Component, 2020β2027
9.2.7.2. Market Size & Estimates, by Organization Size, 2020β2027
9.2.7.3. Market Size & Estimates, by Vertical, 2020β2027
9.3. Europe
9.3.1. Market Size & Estimates, by Country, 2020β2027
9.3.2. Market Size & Estimates, by Component, 2020β2027
9.3.3. Market Size & Estimates, by Organization Size, 2020β2027
9.3.4. Market Size & Estimates, by Vertical, 2020β2027
9.3.5. Germany
9.3.5.1. Market Size & Estimates, by Component, 2020β2027
9.3.5.2. Market Size & Estimates, by Organization Size, 2020β2027
9.3.5.3. Market Size & Estimates, by Vertical, 2020β2027
9.3.6. UK
9.3.6.1. Market Size & Estimates, by Component, 2020β2027
9.3.6.2. Market Size & Estimates, by Organization Size, 2020β2027
9.3.6.3. Market Size & Estimates, by Vertical, 2020β2027
9.3.7. France
9.3.7.1. Market Size & Estimates, by Component, 2020β2027
9.3.7.2. Market Size & Estimates, by Organization Size, 2020β2027
9.3.7.3. Market Size & Estimates, by Vertical, 2020β2027
9.3.8. Rest of Europe
9.3.8.1. Market Size & Estimates, by Component, 2020β2027
9.3.8.2. Market Size & Estimates, by Organization Size, 2020β2027
9.3.8.3. Market Size & Estimates, by Vertical, 2020β2027
9.4. Asia Pacific
9.4.1. Market Size & Estimates, by Country, 2020β2027
9.4.2. Market Size & Estimates, by Component, 2020β2027
9.4.3. Market Size & Estimates, by Organization Size, 2020β2027
9.4.4. Market Size & Estimates, by Vertical, 2020β2027
9.4.5. China
9.4.5.1. Market Size & Estimates, by Component, 2020β2027
9.4.5.2. Market Size & Estimates, by Organization Size, 2020β2027
9.4.5.3. Market Size & Estimates, by Vertical, 2020β2027
9.4.6. Japan
9.4.6.1. Market Size & Estimates, by Component, 2020β2027
9.4.6.2. Market Size & Estimates, by Organization Size, 2020β2027
9.4.6.3. Market Size & Estimates, by Vertical, 2020β2027
9.4.7. India
9.4.7.1. Market Size & Estimates, by Component, 2020β2027
9.4.7.2. Market Size & Estimates, by Organization Size, 2020β2027
9.4.7.3. Market Size & Estimates, by Vertical, 2020β2027
9.4.8. Rest of Asia-Pacific
9.4.8.1. Market Size & Estimates, by Component, 2020β2027
9.4.8.2. Market Size & Estimates, by Organization Size, 2020β2027
9.4.8.3. Market Size & Estimates, by Vertical, 2020β2027
9.5. Middle East & Africa
9.5.1.1. Market Size & Estimates, by Component, 2020β2027
9.5.1.2. Market Size & Estimates, by Organization Size, 2020β2027
9.5.1.3. Market Size & Estimates, by Vertical, 2020β2027
9.6. South America
9.6.1.1. Market Size & Estimates, by Component, 2020β2027
9.6.1.2. Market Size & Estimates, by Organization Size, 2020β2027
9.6.1.3. Market Size & Estimates, by Vertical, 2020β2027
10. COMPETITIVE LANDSCAPE
10.1. Introduction
10.2. Key Players Market Share Analysis, 2020 (%)
10.3. Competitive Benchmarking
10.4. Competitor Dashboard
10.5. Major Growth Strategy in the market
10.6. Key Developments & Growth Strategies
10.6.1. New Product Development
10.6.2. Mergers & Acquisitions
10.6.3. Contracts & Agreements
11. COMPANY PROFILES
11.1. Ciena Corporation
11.1.1. Company Overview
11.1.2. Financial Overview
11.1.3. Products/Components/Solutions Offered
11.1.4. Key Developments
11.1.5. SWOT Analysis
11.1.6. Key Strategies
11.2. Cisco Systems, Inc.
11.2.1. Company Overview
11.2.2. Financial Overview
11.2.3. Products/Components/Solutions Offered
11.2.4. Key Developments
11.2.5. SWOT Analysis
11.2.6. Key Strategies
11.3. Telefonaktiebolaget LM Ericsson
11.3.1. Company Overview
11.3.2. Financial Overview
11.3.3. Products/Components/Solutions Offered
11.3.4. Key Developments
11.3.5. SWOT Analysis
11.3.6. Key Strategies
11.4. Dell Inc.
11.4.1. Company Overview
11.4.2. Financial Overview
11.4.3. Products/Components/Solutions Offered
11.4.4. Key Developments
11.4.5. SWOT Analysis
11.4.6. Key Strategies
11.5. FUJITSU
11.5.1. Company Overview
11.5.2. Financial Overview
11.5.3. Products/Components/Solutions Offered
11.5.4. Key Developments
11.5.5. SWOT Analysis
11.5.6. Key Strategies
11.6. Juniper Networks, Inc.
11.6.1. Company Overview
11.6.2. Financial Overview
11.6.3. Products/Components/Solutions Offered
11.6.4. Key Developments
11.6.5. SWOT Analysis
11.6.6. Key Strategies
11.7. Hewlett Packard Enterprise Development LP
11.7.1. Company Overview
11.7.2. Financial Overview
11.7.3. Products/Components/Solutions Offered
11.7.4. Key Developments
11.7.5. SWOT Analysis
11.7.6. Key Strategies
11.8. Intel Corporation
11.8.1. Company Overview
11.8.2. Financial Overview
11.8.3. Products/Components/Solutions Offered
11.8.4. Key Developments
11.8.5. SWOT Analysis
11.8.6. Key Strategies
11.9. IBM Corporation
11.9.1. Company Overview
11.9.2. Financial Overview
11.9.3. Products/Components/Solutions Offered
11.9.4. Key Developments
11.9.5. SWOT Analysis
11.9.6. Key Strategies
11.10. NEC Corporation
11.10.1. Company Overview
11.10.2. Financial Overview
11.10.3. Products/Components/Solutions Offered
11.10.4. Key Developments
11.10.5. SWOT Analysis
11.10.6. Key Strategies
11.11. Ribbon Communications Operating Company, Inc.
11.11.1. Company Overview
11.11.2. Financial Overview
11.11.3. Products/Components/Solutions Offered
11.11.4. Key Developments
11.11.5. SWOT Analysis
11.11.6. Key Strategies
11.12. Wipro Limited
11.12.1. Company Overview
11.12.2. Financial Overview
11.12.3. Products/Components/Solutions Offered
11.12.4. Key Developments
11.12.5. SWOT Analysis
11.12.6. Key Strategies
11.13. TATA Communications
11.13.1. Company Overview
11.13.2. Financial Overview
11.13.3. Products/Components/Solutions Offered
11.13.4. Key Developments
11.13.5. SWOT Analysis
11.13.6. Key Strategies
11.14. Sakon
11.14.1. Company Overview
11.14.2. Financial Overview
11.14.3. Products/Components/Solutions Offered
11.14.4. Key Developments
11.14.5. SWOT Analysis
11.14.6. Key Strategies
11.15. Curvature
11.15.1. Company Overview
11.15.2. Financial Overview
11.15.3. Products/Components/Solutions Offered
11.15.4. Key Developments
11.15.5. SWOT Analysis
11.15.6. Key Strategies
LIST OF TABLES
TABLE 1 LIST OF ASSUMPTIONS
TABLE 2 GLOBAL NETWORK TRANSFORMATION MARKET, BY COMPONENT, 2020β2027 (USD MILLION)
TABLE 3 GLOBAL NETWORK TRANSFORMATION MARKET, BY ORGANIZATION SIZE, 2020β2027 (USD MILLION)
TABLE 4 GLOBAL NETWORK TRANSFORMATION MARKET, BY VERTICAL, 2020β2027 (USD MILLION)
TABLE 5 GLOBAL NETWORK TRANSFORMATION MARKET, BY REGION, 2020β2027 (USD MILLION)
TABLE 6 NORTH AMERICA: NETWORK TRANSFORMATION MARKET, BY COUNTRY, 2020β2027 (USD MILLION)
TABLE 7 NORTH AMERICA: NETWORK TRANSFORMATION MARKET, BY COMPONENT, 2020β2027 (USD MILLION)
TABLE 8 NORTH AMERICA: NETWORK TRANSFORMATION MARKET, BY ORGANIZATION SIZE, 2020β2027 (USD MILLION)
TABLE 9 NORTH AMERICA: NETWORK TRANSFORMATION MARKET, BY VERTICAL, 2020β2027 (USD MILLION)
TABLE 10 US: NETWORK TRANSFORMATION MARKET, BY COMPONENT, 2020β2027 (USD MILLION)
TABLE 11 US: NETWORK TRANSFORMATION MARKET, BY ORGANIZATION SIZE, 2020β2027 (USD MILLION)
TABLE 12 US: NETWORK TRANSFORMATION MARKET, BY VERTICAL, 2020β2027 (USD MILLION)
TABLE 13 CANADA: NETWORK TRANSFORMATION MARKET, BY COMPONENT, 2020β2027 (USD MILLION)
TABLE 14 CANADA: NETWORK TRANSFORMATION MARKET, BY ORGANIZATION SIZE, 2020β2027 (USD MILLION)
TABLE 15 CANADA: NETWORK TRANSFORMATION MARKET, BY VERTICAL, 2020β2027 (USD MILLION)
TABLE 16 MEXICO: NETWORK TRANSFORMATION MARKET, BY COMPONENT, 2020β2027 (USD MILLION)
TABLE 17 MEXICO: NETWORK TRANSFORMATION MARKET, BY ORGANIZATION SIZE, 2020β2027 (USD MILLION)
TABLE 18 MEXICO: NETWORK TRANSFORMATION MARKET, BY VERTICAL, 2020β2027 (USD MILLION)
TABLE 19 EUROPE: NETWORK TRANSFORMATION MARKET, BY COUNTRY, 2020β2027 (USD MILLION)
TABLE 20 EUROPE: NETWORK TRANSFORMATION MARKET, BY COMPONENT, 2020β2027 (USD MILLION)
TABLE 21 EUROPE: NETWORK TRANSFORMATION MARKET, BY ORGANIZATION SIZE, 2020β2027 (USD MILLION)
TABLE 22 EUROPE: NETWORK TRANSFORMATION MARKET, BY VERTICAL, 2020β2027 (USD MILLION)
TABLE 23 UK: NETWORK TRANSFORMATION MARKET, BY COMPONENT, 2020β2027 (USD MILLION)
TABLE 24 UK: NETWORK TRANSFORMATION MARKET, BY ORGANIZATION SIZE, 2020β2027 (USD MILLION)
TABLE 25 UK: NETWORK TRANSFORMATION MARKET, BY VERTICAL, 2020β2027 (USD MILLION)
TABLE 26 GERMANY: NETWORK TRANSFORMATION MARKET, BY COMPONENT, 2020β2027 (USD MILLION)
TABLE 27 GERMANY: NETWORK TRANSFORMATION MARKET, BY ORGANIZATION SIZE, 2020β2027 (USD MILLION)
TABLE 28 GERMANY: NETWORK TRANSFORMATION MARKET, BY VERTICAL, 2020β2027 (USD MILLION)
TABLE 29 FRANCE: NETWORK TRANSFORMATION MARKET, BY COMPONENT, 2020β2027 (USD MILLION)
TABLE 30 FRANCE: NETWORK TRANSFORMATION MARKET, BY ORGANIZATION SIZE, 2020β2027 (USD MILLION)
TABLE 31 FRANCE: NETWORK TRANSFORMATION MARKET, BY VERTICAL, 2020β2027 (USD MILLION)
TABLE 32 REST OF EUROPE: NETWORK TRANSFORMATION MARKET, BY COMPONENT, 2020β2027 (USD MILLION)
TABLE 33 REST OF EUROPE: NETWORK TRANSFORMATION MARKET, BY ORGANIZATION SIZE, 2020β2027 (USD MILLION)
TABLE 34 REST OF EUROPE: NETWORK TRANSFORMATION MARKET, BY VERTICAL, 2020β2027 (USD MILLION)
TABLE 35 ASIA-PACIFIC: NETWORK TRANSFORMATION MARKET, BY COUNTRY, 2020β2027 (USD MILLION)
TABLE 36 ASIA-PACIFIC: NETWORK TRANSFORMATION MARKET, BY COMPONENT, 2020β2027 (USD MILLION)
TABLE 37 ASIA-PACIFIC: NETWORK TRANSFORMATION MARKET, BY ORGANIZATION SIZE, 2020β2027 (USD MILLION)
TABLE 38 ASIA-PACIFIC: NETWORK TRANSFORMATION MARKET, BY VERTICAL, 2020β2027 (USD MILLION)
TABLE 39 CHINA: NETWORK TRANSFORMATION MARKET, BY COMPONENT, 2020β2027 (USD MILLION)
TABLE 40 CHINA: NETWORK TRANSFORMATION MARKET, BY ORGANIZATION SIZE, 2020β2027 (USD MILLION)
TABLE 41 CHINA: NETWORK TRANSFORMATION MARKET, BY VERTICAL, 2020β2027 (USD MILLION)
TABLE 42 INDIA: NETWORK TRANSFORMATION MARKET, BY COMPONENT, 2020β2027 (USD MILLION)
TABLE 43 INDIA: NETWORK TRANSFORMATION MARKET, BY ORGANIZATION SIZE, 2020β2027 (USD MILLION)
TABLE 44 INDIA: NETWORK TRANSFORMATION MARKET, BY VERTICAL, 2020β2027 (USD MILLION)
TABLE 45 JAPAN: NETWORK TRANSFORMATION MARKET, BY COMPONENT, 2020β2027 (USD MILLION)
TABLE 46 JAPAN: NETWORK TRANSFORMATION MARKET, BY ORGANIZATION SIZE, 2020β2027 (USD MILLION)
TABLE 47 JAPAN: NETWORK TRANSFORMATION MARKET, BY VERTICAL, 2020β2027 (USD MILLION)
TABLE 48 REST OF ASIA-PACIFIC: NETWORK TRANSFORMATION MARKET, BY COMPONENT, 2020β2027 (USD MILLION)
TABLE 49 REST OF ASIA-PACIFIC: NETWORK TRANSFORMATION MARKET, BY ORGANIZATION SIZE, 2020β2027 (USD MILLION)
TABLE 50 REST OF ASIA-PACIFIC: NETWORK TRANSFORMATION MARKET, BY VERTICAL, 2020β2027 (USD MILLION)
TABLE 51 MIDDLE EAST AND AFRICA: NETWORK TRANSFORMATION MARKET, BY COMPONENT, 2020β2027 (USD MILLION)
TABLE 52 MIDDLE EAST AND AFRICA: NETWORK TRANSFORMATION MARKET, BY ORGANIZATION SIZE, 2020β2027 (USD MILLION)
TABLE 53 MIDDLE EAST AND AFRICA: NETWORK TRANSFORMATION MARKET, BY VERTICAL, 2020β2027 (USD MILLION)
TABLE 54 SOUTH AMERICA: NETWORK TRANSFORMATION MARKET, BY COMPONENT, 2020β2027 (USD MILLION)
TABLE 55 SOUTH AMERICA: NETWORK TRANSFORMATION MARKET, BY ORGANIZATION SIZE, 2020β2027 (USD MILLION)
TABLE 56 SOUTH AMERICA: NETWORK TRANSFORMATION MARKET, BY VERTICAL, 2020β2027 (USD MILLION)
β
β
LIST OF FIGURES
FIGURE 1 MARKET SYNOPSIS
FIGURE 2 RESEARCH PROCESS OF MRFR
FIGURE 3 TOP DOWN & BOTTOM-UP APPROACH
FIGURE 4 GLOBAL NETWORK TRANSFORMATION MARKET, BY COMPONENT, 2020β2027 (USD MILLION)
FIGURE 5 GLOBAL NETWORK TRANSFORMATION MARKET, BY ORGANIZATION SIZE, 2020β2027 (USD MILLION)
FIGURE 6 GLOBAL NETWORK TRANSFORMATION MARKET, BY VERTICAL, 2020β2027 (USD MILLION)
FIGURE 7 GLOBAL NETWORK TRANSFORMATION MARKET, BY REGION, 2020 & 2027 (USD MILLION)
FIGURE 8 NORTH AMERICA: NETWORK TRANSFORMATION MARKET, BY COUNTRY, 2020β2027 (USD MILLION)
FIGURE 9 NORTH AMERICA: NETWORK TRANSFORMATION MARKET, BY COMPONENT, 2020β2027 (USD MILLION)
FIGURE 10 NORTH AMERICA: NETWORK TRANSFORMATION MARKET, BY ORGANIZATION SIZE, 2020β2027 (USD MILLION)
FIGURE 11 NORTH AMERICA: NETWORK TRANSFORMATION MARKET, BY VERTICAL, 2020β2027 (USD MILLION)
FIGURE 12 EUROPE: NETWORK TRANSFORMATION MARKET, BY COUNTRY, 2020β2027 (USD MILLION)
FIGURE 13 EUROPE: NETWORK TRANSFORMATION MARKET, BY COMPONENT, 2020β2027 (USD MILLION)
FIGURE 14 EUROPE: NETWORK TRANSFORMATION MARKET, BY ORGANIZATION SIZE, 2020β2027 (USD MILLION)
FIGURE 15 EUROPE: NETWORK TRANSFORMATION MARKET, BY VERTICAL, 2020β2027 (USD MILLION)
FIGURE 16 ASIA-PACIFIC: NETWORK TRANSFORMATION MARKET, BY COUNTRY, 2020β2027 (USD MILLION)
FIGURE 17 ASIA-PACIFIC: NETWORK TRANSFORMATION MARKET, BY COMPONENT, 2020β2027 (USD MILLION)
FIGURE 18 ASIA-PACIFIC: NETWORK TRANSFORMATION MARKET, BY ORGANIZATION SIZE, 2020β2027 (USD MILLION)
FIGURE 19 ASIA-PACIFIC: NETWORK TRANSFORMATION MARKET, BY VERTICAL, 2020β2027 (USD MILLION)
FIGURE 20 MIDDLE EAST AND AFRICA: NETWORK TRANSFORMATION MARKET, BY COMPONENT, 2020β2027 (USD MILLION)
FIGURE 21 MIDDLE EAST AND AFRICA: NETWORK TRANSFORMATION MARKET, BY ORGANIZATION SIZE, 2020β2027 (USD MILLION)
FIGURE 22 MIDDLE EAST AND AFRICA: NETWORK TRANSFORMATION MARKET, BY VERTICAL, 2020β2027 (USD MILLION)
FIGURE 23 SOUTH AMERICA: NETWORK TRANSFORMATION MARKET, BY COMPONENT, 2020β2027 (USD MILLION)
FIGURE 24 SOUTH AMERICA: NETWORK TRANSFORMATION MARKET, BY ORGANIZATION SIZE, 2020β2027 (USD MILLION)
FIGURE 25 SOUTH AMERICA: NETWORK TRANSFORMATION MARKET, BY VERTICAL, 2020β2027 (USD MILLION)
$122.73 Billion
39%
North America
2020-2027
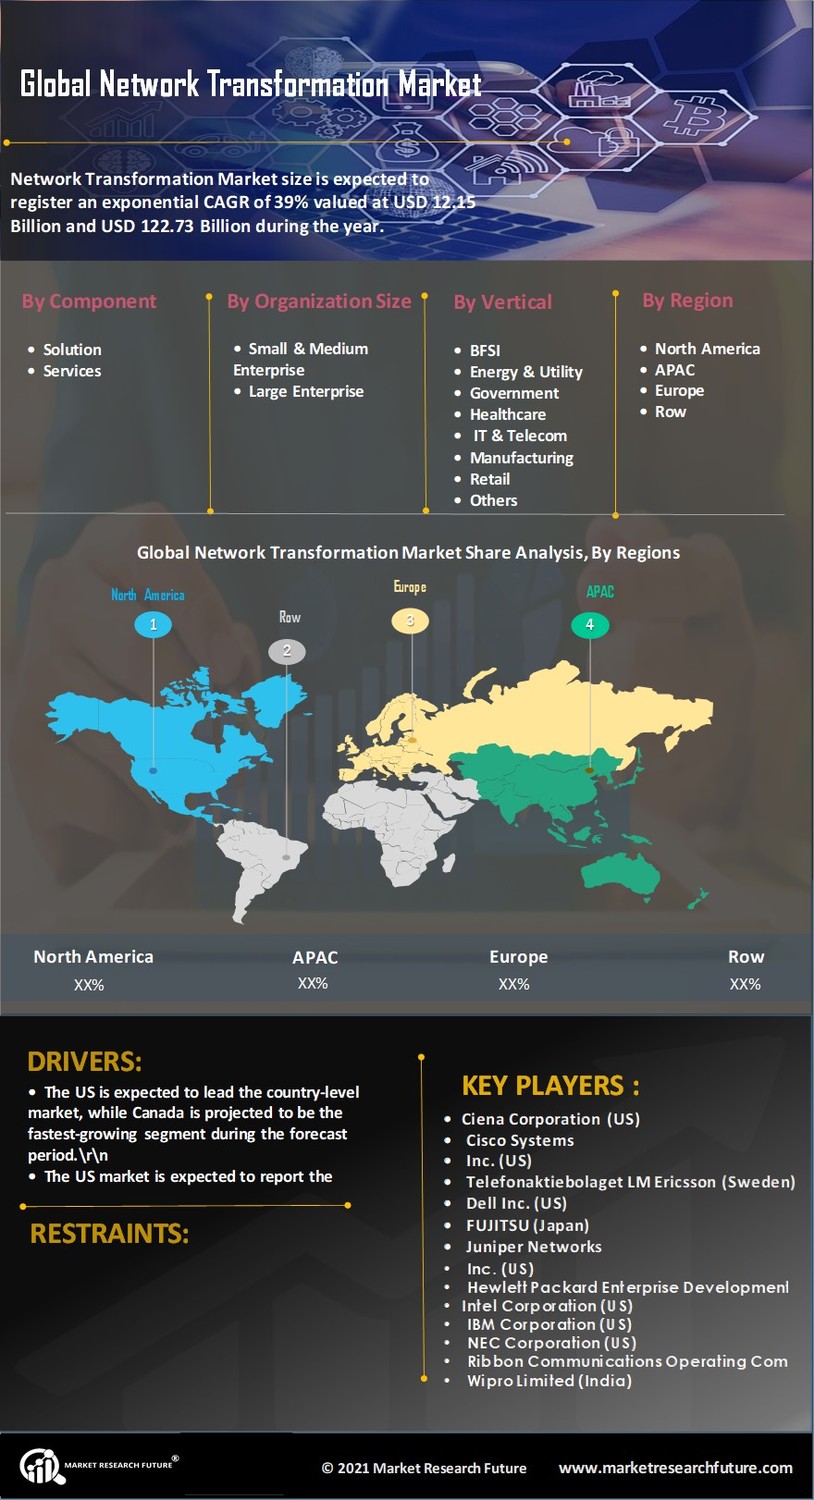
Network transformation enables organization to automate their networks to provide new advanced services with speed and cater their customers with excellent usage experience. This is achieved through connected devices, new applications, automation technologies, enhanced security controls, adoption of cloud-based services, among others. Some of the benefits offered by the network transformation include enhanced transperency and control, standardizied services, short deployment cycles, faster site connectivity that enables agile business of digital services, provide customer-oriented product offerings for superior user satisfaction, increase productivity in day-to-day business operations, greater network security to meet regulatory compliances, boost adoption of cloud through via cloud exchanges and direct SaaS connectivity, among others.
Several factors including rising demand for IT as a service platform, increasing trend of bring your own device by organizations, and adoption of network virtualization are some of the factors that are driving the network transformation market. Additionally, the new application architectures (for instance, microservices and containers) to help automate networks are also contributing to the market growth.
However, this market growth is hampered by lack of skilled workforce required for the development and integration to the existing infrastructure. Although, rapid advancements in technology is creating opportunities that can further boost the growth of the network transformation market. For instance, software-defined wide area network (SD-WAN), AI/ML and policy driven network architectures, rise of container-based virtualization, light-weight & portable applications are being launched as discrete microservices, etc. are some of the technological advancements evolving in the industry.
Network Transformation Market Regional Analysis:
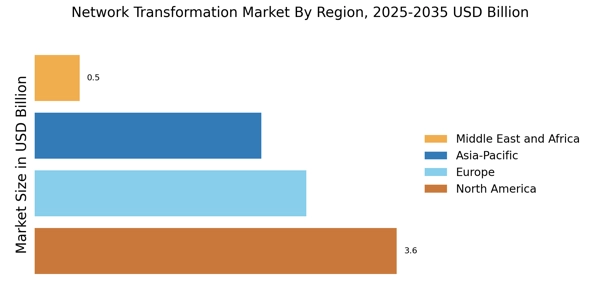
Global Network Transformation Market is estimated to register an robust CAGR over the forecast period. The geographic analysis of the global network transformation market has been conducted for North America, Europe, Asia-Pacific, the Middle East & Africa, and South America.
North America is expected to be the dominating region in terms of the adoption of network transformation solutions & services. North American market has been segmented into the US, Canada, and Mexico. The US is expected to lead the country-level market, while Canada is projected to be the fastest-growing segment during the forecast period. The US market is expected to report the highest market share, owing to the factors such as faster adoption of advanced technologies to enhance customer experience across all types of devices. Additionally, the North American market for network transformation solutions and services is expected to grow further due to presence of key players in the region such as Ciena Corporation (US), Cisco Systems, Inc. (US), Dell Inc. (US), Juniper Networks, Inc. (US), Hewlett Packard Enterprise Development LP (US), Intel Corporation (US), IBM Corporation (US), NEC Corporation (US), Ribbon Communications Operating Company, Inc. (US), Sakon (US), and Curvature (US). These players are competing to deliver network transformation solutions and services that supports, secures, and delivers containerized applications that need to keep up with this new trend of building once and running-anywhere.
Asia-Pacific region is projected to grow at the fastest rate over the forecast period, with the regional market being segmented into China, Japan, India, and the rest of Asia-Pacific. This growth is attributed to the rapid economic developments, increasing internet users, rise in OTT platforms and digital innovation in major countries including China, Japan, India, Singapore, Malaysia, Australia, among others. Furthermore, IT & telecom companies in the region are developing their digital skills and capabilities to ensure they stay one-step ahead of their competitors across the globe.
Network Transformation Market Competitive Analysis:
Global Network Transformation Market is witnessing a exponential growth due to the rising demand for IT as a service platform, increasing trend of bring your own device by organizations, and adoption of network virtualization technology. Major players have opted for partnerships, acquisitions, and product developments as their key organic growth strategies to enhance their positions in the market and cater to the rapidly changing network demands. Additionally, the companies are focusing on providing proactive, predictive optimization model, ensuring efficiency, speed, and the best customer experience. These are expected to boost the demand for network transformation solutions and services across the globe.
Impact of COVID19:
The outbreak of COVID-19 has resulted into several disruptions in the day to day business operations across industry verticals globally. Following to this outbreak, enforcement of lockdown and other movement restrictions for several months to prevent the spread of deadly virus impacted the rapid transformation in the working culture. The demand for network-based services reached its peak during lockdowns and movement restrictions imposed. The adoption of network transformation solutions and services helped organizations across industry verticals to cope up with the consumer demands during the pandemic. The increased dependency over the networks to operate in the flexible working hours, work from home environment, BYOD trend, uneven operating infrastructures, rapid digital transformation across end-use verticals (for instance education sector), among others impacted network capabilities.
Network Transformation Market Key Players:
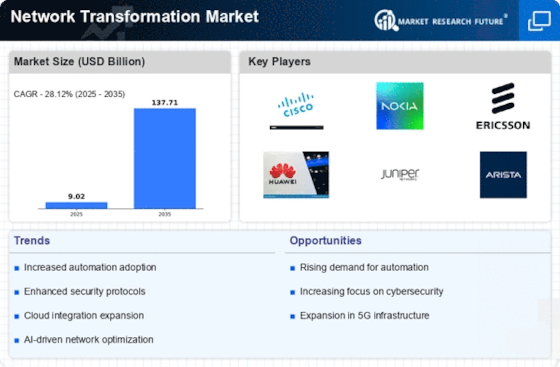
The Key Players in the Global Network Transformation Market are identified based on their country of origin, presence across different regions, recent key developments, product diversification, and industry expertise. These include Ciena Corporation (US), Cisco Systems, Inc. (US), Telefonaktiebolaget LM Ericsson (Sweden), Dell Inc. (US), FUJITSU (Japan), Juniper Networks, Inc. (US), Hewlett Packard Enterprise Development LP (US), Intel Corporation (US), IBM Corporation (US), NEC Corporation (US), Ribbon Communications Operating Company, Inc. (US), Wipro Limited (India), TATA Communications (India), Sakon (US), and Curvature (US). The key strategies adopted by most of the players are partnerships, acquisitions, agreements, and collaborations.
Global Network Transformation Market, 2018–2026 (USD Billion):
Source: MRFR Analysis
Intended Audience:
Key Questions Addressed by the Report
Report Attribute/Metric | Details |
---|---|
Market Size | USD 122.73 Billion (2027) |
CAGR | 39% (2021-2027) |
Base Year | 2019 |
Forecast Period | 2020-2027 |
Historical Data | 2018 |
Forecast Units | Value (USD Billion) |
Report Coverage | Revenue Forecast, Competitive Landscape, Growth Factors, and Trends |
Segments Covered | By Component, By Organization Size, By Vertical |
Geographies Covered | North America, Europe, Asia-Pacific, and Rest of the World (RoW) |
Key Vendors | Ciena Corporation (US), Cisco Systems, Inc. (US), Telefonaktiebolaget LM Ericsson (Sweden), Dell Inc. (US), FUJITSU (Japan), Juniper Networks, Inc. (US), Hewlett Packard Enterprise Development LP (US), Intel Corporation (US), IBM Corporation (US), NEC Corporation (US), Ribbon Communications Operating Company, Inc. (US), Wipro Limited (India), TATA Communications (India), Sakon (US), and Curvature (US). The key strategies adopted by most of the players are partnerships, acquisitions, agreements, and collaborations. |
Key Market Opportunities |
|
Key Market Drivers |
|
Frequently Asked Questions (FAQ) :
The global network transformation market is predicted to grow at a 39.7% CAGR between 2020- 2027.
The network transformation market is predicted to reach USD 122.73 billion by 2027.
North America will lead the global network transformation market.
The demand for IT as a service platform and growing trend of BYOD by organizations are the key factors driving the global network transformation market growth.
Key contenders profiled in the global network transformation market include Ciena Corporation (US), Cisco Systems, Inc. (US), Telefonaktiebolaget LM Ericsson (Sweden), Dell Inc. (US), FUJITSU (Japan), Juniper Networks, Inc. (US), Hewlett Packard Enterprise Development LP (US), Intel Corporation (US), IBM Corporation (US), NEC Corporation (US), Ribbon Communications Operating Company, Inc. (US), Wipro Limited (India), TATA Communications (India), Sakon (US), and Curvature (US).