Network Analytics Market (2026 - 2035)

ID: MRFR/ICT/1762-HCR
100 Pages
Ankit Gupta
Last Updated: June 22, 2026
Network Analytics Market Size, Share and Research Report By Deployment Model (On-Premise, Cloud, Hybrid), By Component (Solutions, Services), By Application (Performance Management, Fault Management, Security & Anomaly Detection, Others (Billing Verification, Customer Experience)), By End User (Communication Service Providers, Cloud Service Providers, Enterprises, Government) and By Regional (North America, Europe, South America, Asia Pacific, Middle East and Africa) - Industry Forecast to 2035
Download PDF ×

We do not share your information with anyone. However, we may send you emails based on your report interest from time to time. You may contact us at any time to opt-out.

Network Analytics Market

Market Size

Forecast Period2026-2035
CAGR (2026-2035)19.5%
2025 Market SizeUSD 4.42 Billion
2035 Market SizeUSD 26.24 Billion

Key Players

Cisco Systems
IBM Corporation
Juniper Networks
Nokia Corporation
SolarWinds
NetScout Systems
Opportunities
  • AI-Native Network Observability Platforms
  • SASE and Converged Security-Analytics Stacks
  • Emerging-Market Broadband Buildouts
  1. 1 Market Overview |
    1. 1.1 Study Assumptions & Market Definition |
    2. 1.2 Scope of the Study |
    3. 1.3 Research Methodology
  2. 2 Market Summary & Key Takeaways
  3. 3 Market Dynamics |
    1. 3.1 Market Drivers Analysis | |
      1. 3.1.1 5G Network Densification and Monetization | |
      2. 3.1.2 AI/ML-Driven Autonomous Network Operations | |
      3. 3.1.3 IoT Endpoint Proliferation | |
      4. 3.1.4 Cloud and Hybrid Migration | |
      5. 3.1.5 Rising Cybersecurity Threat Landscape | |
      6. 3.1.6 Regulatory Data-Compliance Mandates | |
      7. 3.1.7 Network Slicing and Programmable Infrastructure |
    2. 3.2 Market Restraints Analysis | |
      1. 3.2.1 High Upfront Deployment Costs | |
      2. 3.2.2 Specialized Talent Shortage | |
      3. 3.2.3 Data Privacy Regulations | |
      4. 3.2.4 Vendor Lock-In and Interoperability Challenges | |
      5. 3.2.5 Legacy Infrastructure Inertia in Regulated Sectors |
    3. 3.3 Market Opportunity Analysis | |
      1. 3.3.1 AI-Native Network Observability Platforms | |
      2. 3.3.2 SASE and Converged Security-Analytics Stacks | |
      3. 3.3.3 Emerging-Market Broadband Buildouts | |
      4. 3.3.4 Network Data Monetization and API-Led Services | |
      5. 3.3.5 Private 5G and Edge Computing Convergence |
    4. 3.4 Industry Value Chain Analysis |
    5. 3.5 Porter's Five Forces Analysis
  4. 4 Global Network Analytics Market Size & Forecast (2021–2035) |
    1. 4.1 Historical Market Size (2021–2025) |
    2. 4.2 Current & Forecast Market Size (2026–2035) |
    3. 4.3 Market Size by Revenue (USD Billion) |
    4. 4.4 Year-over-Year Growth Analysis
  5. 5 Segmentation Analysis |
    1. 5.1 By Deployment Model | |
      1. 5.1.1 On-Premise | |
      2. 5.1.2 Cloud | |
      3. 5.1.3 Hybrid |
    2. 5.2 By Component | |
      1. 5.2.1 Solutions | |
      2. 5.2.2 Services |
    3. 5.3 By Application | |
      1. 5.3.1 Performance Management | |
      2. 5.3.2 Fault Management | |
      3. 5.3.3 Security & Anomaly Detection | |
      4. 5.3.4 Others (Billing Verification, Customer Experience) |
    4. 5.4 By End User | |
      1. 5.4.1 Communication Service Providers | |
      2. 5.4.2 Cloud Service Providers | |
      3. 5.4.3 Enterprises | |
      4. 5.4.4 Government
  6. 6 Regional Analysis |
    1. 6.1 North America | |
      1. 6.1.1 United States | |
      2. 6.1.2 Canada | |
      3. 6.1.3 Mexico |
    2. 6.2 Europe | |
      1. 6.2.1 Germany | |
      2. 6.2.2 United Kingdom | |
      3. 6.2.3 France | |
      4. 6.2.4 Italy | |
      5. 6.2.5 Spain | |
      6. 6.2.6 Nordic Countries | |
      7. 6.2.7 Russia | |
      8. 6.2.8 Rest of Europe |
    3. 6.3 Asia-Pacific | |
      1. 6.3.1 China | |
      2. 6.3.2 India | |
      3. 6.3.3 Japan | |
      4. 6.3.4 South Korea | |
      5. 6.3.5 ASEAN | |
      6. 6.3.6 Rest of Asia-Pacific |
    4. 6.4 South America | |
      1. 6.4.1 Brazil | |
      2. 6.4.2 Argentina | |
      3. 6.4.3 Rest of South America |
    5. 6.5 Middle East & Africa | |
      1. 6.5.1 Saudi Arabia | |
      2. 6.5.2 UAE | |
      3. 6.5.3 South Africa | |
      4. 6.5.4 Egypt | |
      5. 6.5.5 Rest of MEA
  7. 7 Competitive Landscape |
    1. 7.1 Market Share Analysis (2025) |
    2. 7.2 Competitive Benchmarking Matrix |
    3. 7.3 Company Profiles | |
      1. 7.3.1 Cisco Systems | |
      2. 7.3.2 IBM Corporation | |
      3. 7.3.3 Juniper Networks | |
      4. 7.3.4 Nokia Corporation | |
      5. 7.3.5 SolarWinds | |
      6. 7.3.6 NetScout Systems | |
      7. 7.3.7 Broadcom (VMware) | |
      8. 7.3.8 Huawei Technologies | |
      9. 7.3.9 Hewlett Packard Enterprise | |
      10. 7.3.10 Riverbed Technology
  8. 8 Future Outlook & Strategic Recommendations (2026–2035) |
    1. 8.1 AI-Driven Autonomous Network Operations |
    2. 8.2 Platform Economics and Data Monetization |
    3. 8.3 Network Security Convergence |
    4. 8.4 Sustainability and Energy-Aware Networking
  9. 9 Recent Developments & News
  10. 10 Frequently Asked Questions (FAQs)
  11. 11 Report Scope & Methodology |
    1. 11.1 Study Period & Base Year |
    2. 11.2 Data Sources & Citations |
    3. 11.3 Abbreviations
  12. 12 LIST OF TABLES |
  13. TABLE 1 Global Network Analytics Market Size & Forecast, by Revenue (USD Billion), 2021–2035 |
  14. TABLE 2 Global Network Analytics Market — Year-over-Year Growth Analysis, 2021–2035 |
  15. TABLE 3 Global Network Analytics Market — Driver Impact Analysis |
  16. TABLE 4 Global Network Analytics Market — Restraint Impact Analysis |
  17. TABLE 5 Global Network Analytics Market Size, by Deployment Model, 2021–2035 (USD Billion) |
  18. TABLE 6 Global Network Analytics Market Size, by Component, 2021–2035 (USD Billion) |
  19. TABLE 7 Global Network Analytics Market Size, by Application, 2021–2035 (USD Billion) |
  20. TABLE 8 Global Network Analytics Market Size, by End User, 2021–2035 (USD Billion) |
  21. TABLE 9 Global Network Analytics Market Size, by Region, 2021–2035 (USD Billion) |
  22. TABLE 10 North America Network Analytics Market Size, by Country, 2021–2035 (USD Billion) |
  23. TABLE 11 Europe Network Analytics Market Size, by Country, 2021–2035 (USD Billion) |
  24. TABLE 12 Asia-Pacific Network Analytics Market Size, by Country, 2021–2035 (USD Billion) |
  25. TABLE 13 South America Network Analytics Market Size, by Country, 2021–2035 (USD Billion) |
  26. TABLE 14 Middle East & Africa Network Analytics Market Size, by Country, 2021–2035 (USD Billion) |
  27. TABLE 15 Competitive Benchmarking Matrix — Global Network Analytics Market, 2025 |
  28. TABLE 16 Company Profiles — Key Players, Global Network Analytics Market |
  29. TABLE 17 Recent Developments & Strategic Announcements, 2023–2025 |
  30. TABLE 18 North America Network Analytics Market Size, by Deployment Model, 2021–2035 (USD Billion) |
  31. TABLE 19 North America Network Analytics Market Size, by Component, 2021–2035 (USD Billion) |
  32. TABLE 20 North America Network Analytics Market Size, by Application, 2021–2035 (USD Billion) |
  33. TABLE 21 North America Network Analytics Market Size, by End User, 2021–2035 (USD Billion) |
  34. TABLE 22 Europe Network Analytics Market Size, by Deployment Model, 2021–2035 (USD Billion) |
  35. TABLE 23 Europe Network Analytics Market Size, by Component, 2021–2035 (USD Billion) |
  36. TABLE 24 Europe Network Analytics Market Size, by Application, 2021–2035 (USD Billion) |
  37. TABLE 25 Europe Network Analytics Market Size, by End User, 2021–2035 (USD Billion) |
  38. TABLE 26 Asia-Pacific Network Analytics Market Size, by Deployment Model, 2021–2035 (USD Billion) |
  39. TABLE 27 Asia-Pacific Network Analytics Market Size, by Component, 2021–2035 (USD Billion) |
  40. TABLE 28 Asia-Pacific Network Analytics Market Size, by Application, 2021–2035 (USD Billion) |
  41. TABLE 29 Asia-Pacific Network Analytics Market Size, by End User, 2021–2035 (USD Billion) |
  42. TABLE 30 South America Network Analytics Market Size, by Deployment Model, 2021–2035 (USD Billion) |
  43. TABLE 31 South America Network Analytics Market Size, by Component, 2021–2035 (USD Billion) |
  44. TABLE 32 South America Network Analytics Market Size, by Application, 2021–2035 (USD Billion) |
  45. TABLE 33 South America Network Analytics Market Size, by End User, 2021–2035 (USD Billion) |
  46. TABLE 34 Middle East & Africa Network Analytics Market Size, by Deployment Model, 2021–2035 (USD Billion) |
  47. TABLE 35 Middle East & Africa Network Analytics Market Size, by Component, 2021–2035 (USD Billion) |
  48. TABLE 36 Middle East & Africa Network Analytics Market Size, by Application, 2021–2035 (USD Billion) |
  49. TABLE 37 Middle East & Africa Network Analytics Market Size, by End User, 2021–2035 (USD Billion) |
  50. TABLE 38 Report Scope & Methodology Summary |
  51. TABLE 39 Detailed Sources and Citations
  52. 13 LIST OF FIGURES |
  53. FIGURE 1 Global Network Analytics Market Dynamics — Drivers, Restraints & Opportunities |
  54. FIGURE 2 Industry Value Chain Analysis — Network Analytics Market |
  55. FIGURE 3 Porter's Five Forces Analysis — Network Analytics Market |
  56. FIGURE 4 Global Network Analytics Market Size Trend & Forecast, 2021–2035 (USD Billion) |
  57. FIGURE 5 Global Network Analytics Market Share, by Deployment Model, 2025 (%) |
  58. FIGURE 6 Global Network Analytics Market Share, by Component, 2025 (%) |
  59. FIGURE 7 Global Network Analytics Market Share, by Application, 2025 (%) |
  60. FIGURE 8 Global Network Analytics Market Share, by End User, 2025 (%) |
  61. FIGURE 9 Global Network Analytics Market Share, by Region, 2025 (%) |
  62. FIGURE 10 North America Network Analytics Market Size & Forecast, 2021–2035 (USD Billion) |
  63. FIGURE 11 Europe Network Analytics Market Size & Forecast, 2021–2035 (USD Billion) |
  64. FIGURE 12 Asia-Pacific Network Analytics Market Size & Forecast, 2021–2035 (USD Billion) |
  65. FIGURE 13 South America Network Analytics Market Size & Forecast, 2021–2035 (USD Billion) |
  66. FIGURE 14 Middle East & Africa Network Analytics Market Size & Forecast, 2021–2035 (USD Billion) |
  67. FIGURE 15 Competitive Landscape — Market Share Analysis, 2025

Segmentation Quick Reference

DimensionSub-SegmentsDominant SegmentFastest Growing Segment
Deployment ModelOn-Premise, Cloud, HybridOn-Premise (59.0% share, 2025)Cloud (21.5% CAGR)
ComponentSolutions, ServicesSolutions (USD 2.96B, 2025)Services (24.4% CAGR)
ApplicationPerformance Management, Fault Management, Security & Anomaly Detection, OthersPerformance Management (31.5% share, 2025)Security & Anomaly Detection (21.2% CAGR)
End UserCommunication Service Providers, Cloud Service Providers, Enterprises, GovernmentCommunication Service Providers (43.8% share, 2025)Cloud Service Providers (24.1% CAGR)
GeographyNorth America, Europe, Asia-Pacific, South America, Middle East & AfricaNorth America (34.8% share, 2025)Asia-Pacific (21.4% CAGR)


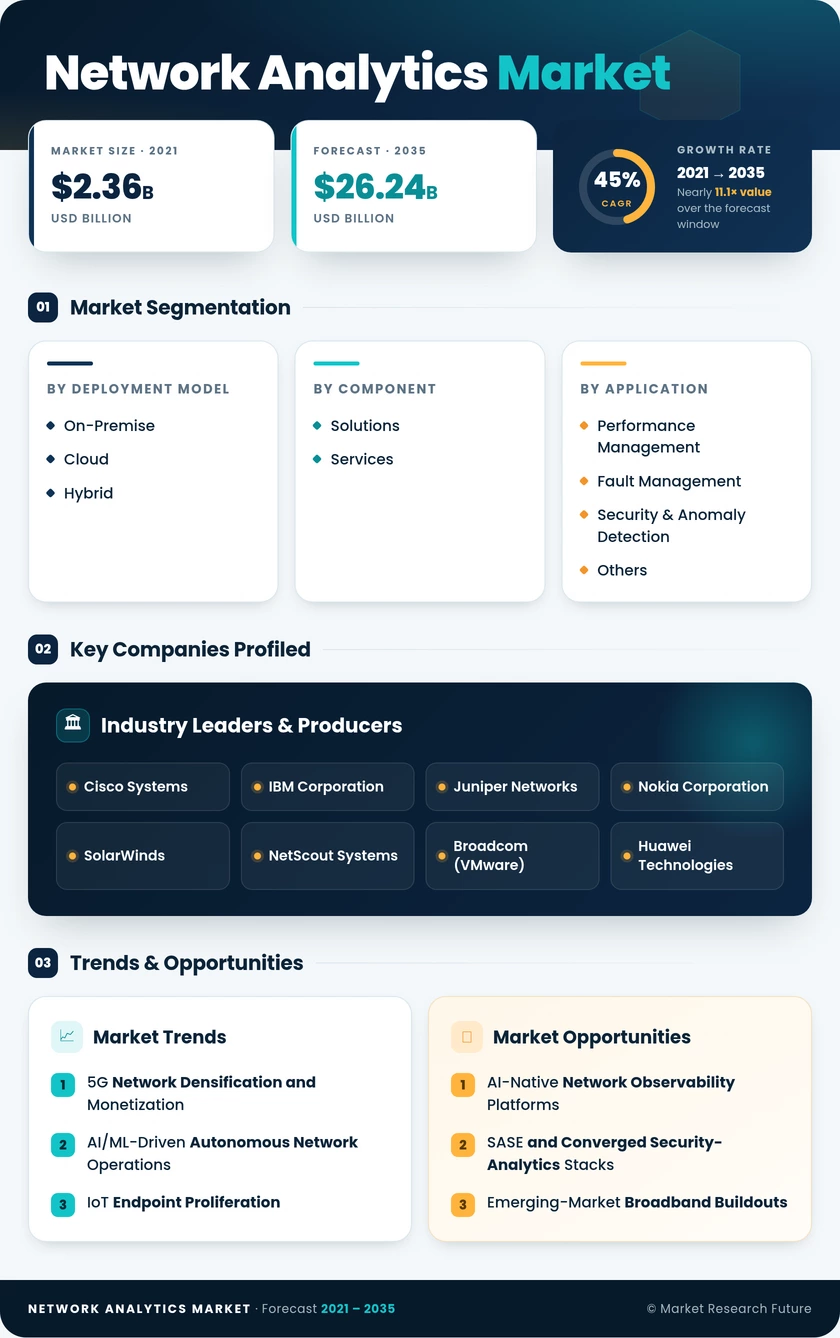
Market Segmentation Overview

By Deployment Model

Sub-SegmentKey Trend
On-PremiseSustained demand in regulated industries prioritizing data sovereignty and low-latency analytics
CloudRapid SaaS adoption driven by consumption pricing and managed-service accessibility
HybridGrowing preference among multi-cloud enterprises seeking unified visibility


On-premise deployments anchor revenue today, but the cloud trajectory is reshaping vendor roadmaps. Hybrid models bridge enterprise transition cycles, enabling gradual migration without disrupting existing network performance management workflows.

By Component

Sub-SegmentKey Trend
SolutionsAI-embedded analytics platforms replacing legacy monitoring suites
ServicesManaged analytics and professional services, expanding as skill gaps persist


Solutions remain the revenue core, yet services are emerging as a strategic growth vector as enterprises outsource network traffic analysis to specialized partners for continuous, 24/7 coverage.

By Application

Sub-SegmentKey Trend
Performance ManagementSLA assurance and capacity planning remain foundational enterprise use cases
Fault ManagementAutomated root-cause analysis, reducing MTTR through machine-learning models
Security & Anomaly DetectionZero-trust and XDR adoption are accelerating investment in real-time threat analytics
OthersBilling verification, subscriber analytics, and customer experience optimization


Performance management and security represent two poles of investment — one protecting uptime, the other protecting against intrusion — and both increasingly depend on shared network behavior intelligence data pipelines.

By End User

Sub-SegmentKey Trend
Communication Service Providers5G slicing and programmable-network monetization driving analytics investment
Cloud Service ProvidersHyperscaler expansion is creating outsized demand for bandwidth monitoring tools
EnterprisesDigital transformation and hybrid work are expanding network analytics beyond IT departments
GovernmentNational broadband and cybersecurity programs are seeding public-sector demand


Communication service providers and cloud service providers collectively account for over two-thirds of current spending, but enterprise and government adoption is accelerating as analytics platforms become more accessible through SaaS delivery.